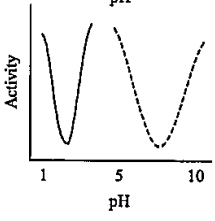
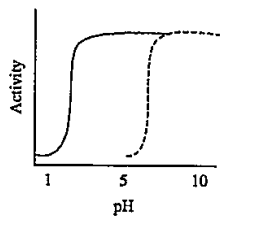
Solid and dotted lines represent the activities of pepsin and salivary amylase enzymes of the digestive tract, respectively. Which one of the following graphs best represents their activity vs pH?


To solve the question regarding the activity of pepsin and salivary amylase enzymes with respect to pH, we can follow these steps:
1. Identify the Enzymes and Their Functions:
- Pepsin is a proteolytic enzyme that breaks down proteins.
- Salivary amylase is an enzyme that breaks down carbohydrates.
2. Determine the Optimum pH for Each Enzyme:
- The optimum pH for pepsin is between 1.0 to 2.0. This acidic environment is maintained by hydrochloric acid (HCl) in the stomach.
- The optimum pH for salivary amylase is between 6 to 7. This is a more neutral pH, which is found in the mouth and the initial part of the small intestine.
3. Analyze the Graphs:
- Look for a graph where the solid line (representing pepsin) shows maximum activity at a pH of 1 to 2.
- The dotted line (representing salivary amylase) should show maximum activity at a pH of 6 to 7.
4. Evaluate Each Graph:
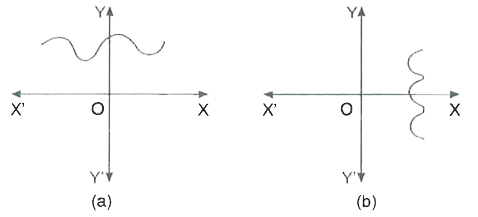
- Graph 1: If it shows pepsin's activity peaking at pH 1-2 and amylase peaking at pH 6-7, this is the correct graph.
- Graph 2: If it shows lower activity for both enzymes, it is incorrect.
- Graph 3 and Graph 4: If they show constant activity or incorrect peaks, they are also incorrect.
5. Select the Correct Graph:
- Based on the analysis, the first graph is the one that accurately represents the activities of pepsin and salivary amylase with respect to pH.
Final Answer:
The correct graph that represents the activity of pepsin and salivary amylase vs. pH is Graph 1.
- Pepsin is a proteolytic enzyme that breaks down proteins.
- Salivary amylase is an enzyme that breaks down carbohydrates.
- The optimum pH for pepsin is between 1.0 to 2.0. This acidic environment is maintained by hydrochloric acid (HCl) in the stomach.
- The optimum pH for salivary amylase is between 6 to 7. This is a more neutral pH, which is found in the mouth and the initial part of the small intestine.
- Look for a graph where the solid line (representing pepsin) shows maximum activity at a pH of 1 to 2.
- The dotted line (representing salivary amylase) should show maximum activity at a pH of 6 to 7.
- Graph 1: If it shows pepsin's activity peaking at pH 1-2 and amylase peaking at pH 6-7, this is the correct graph.
- Graph 2: If it shows lower activity for both enzymes, it is incorrect.
- Graph 3 and Graph 4: If they show constant activity or incorrect peaks, they are also incorrect.
- Based on the analysis, the first graph is the one that accurately represents the activities of pepsin and salivary amylase with respect to pH.
The correct graph that represents the activity of pepsin and salivary amylase vs. pH is Graph 1.
Similar Questions
Knowledge Check
- Question 1 - Select One
Which one of the following graphs represents motion?
A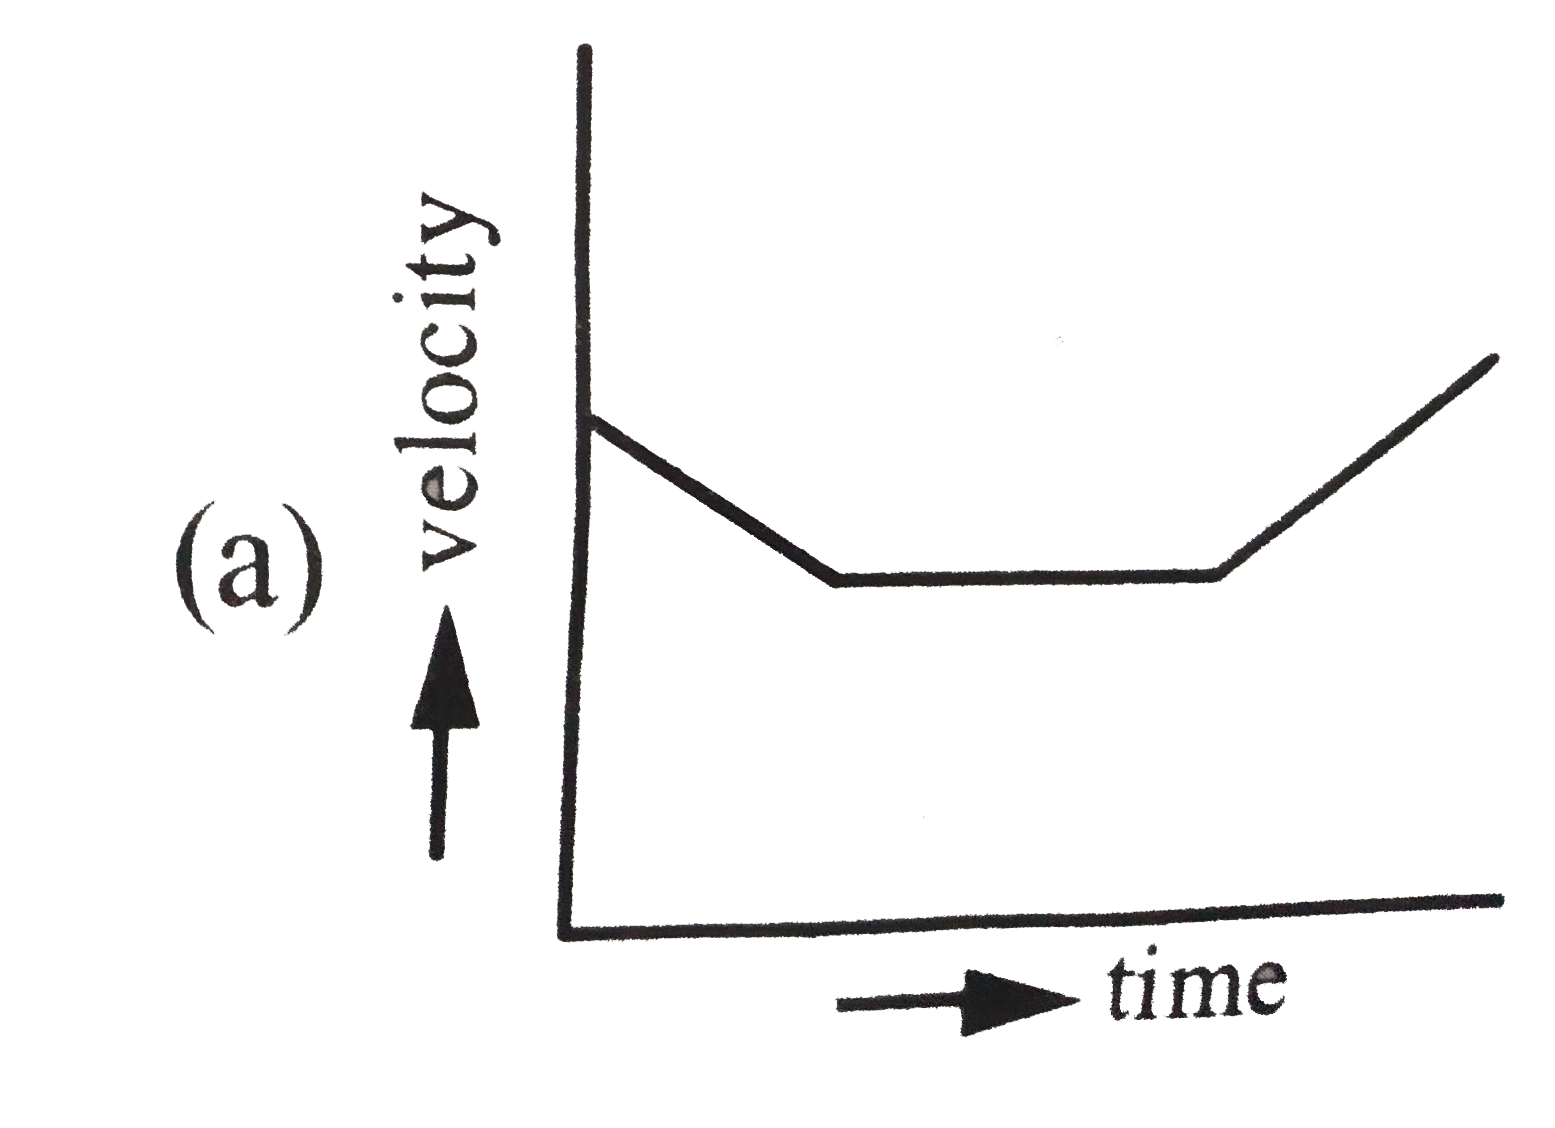 B
B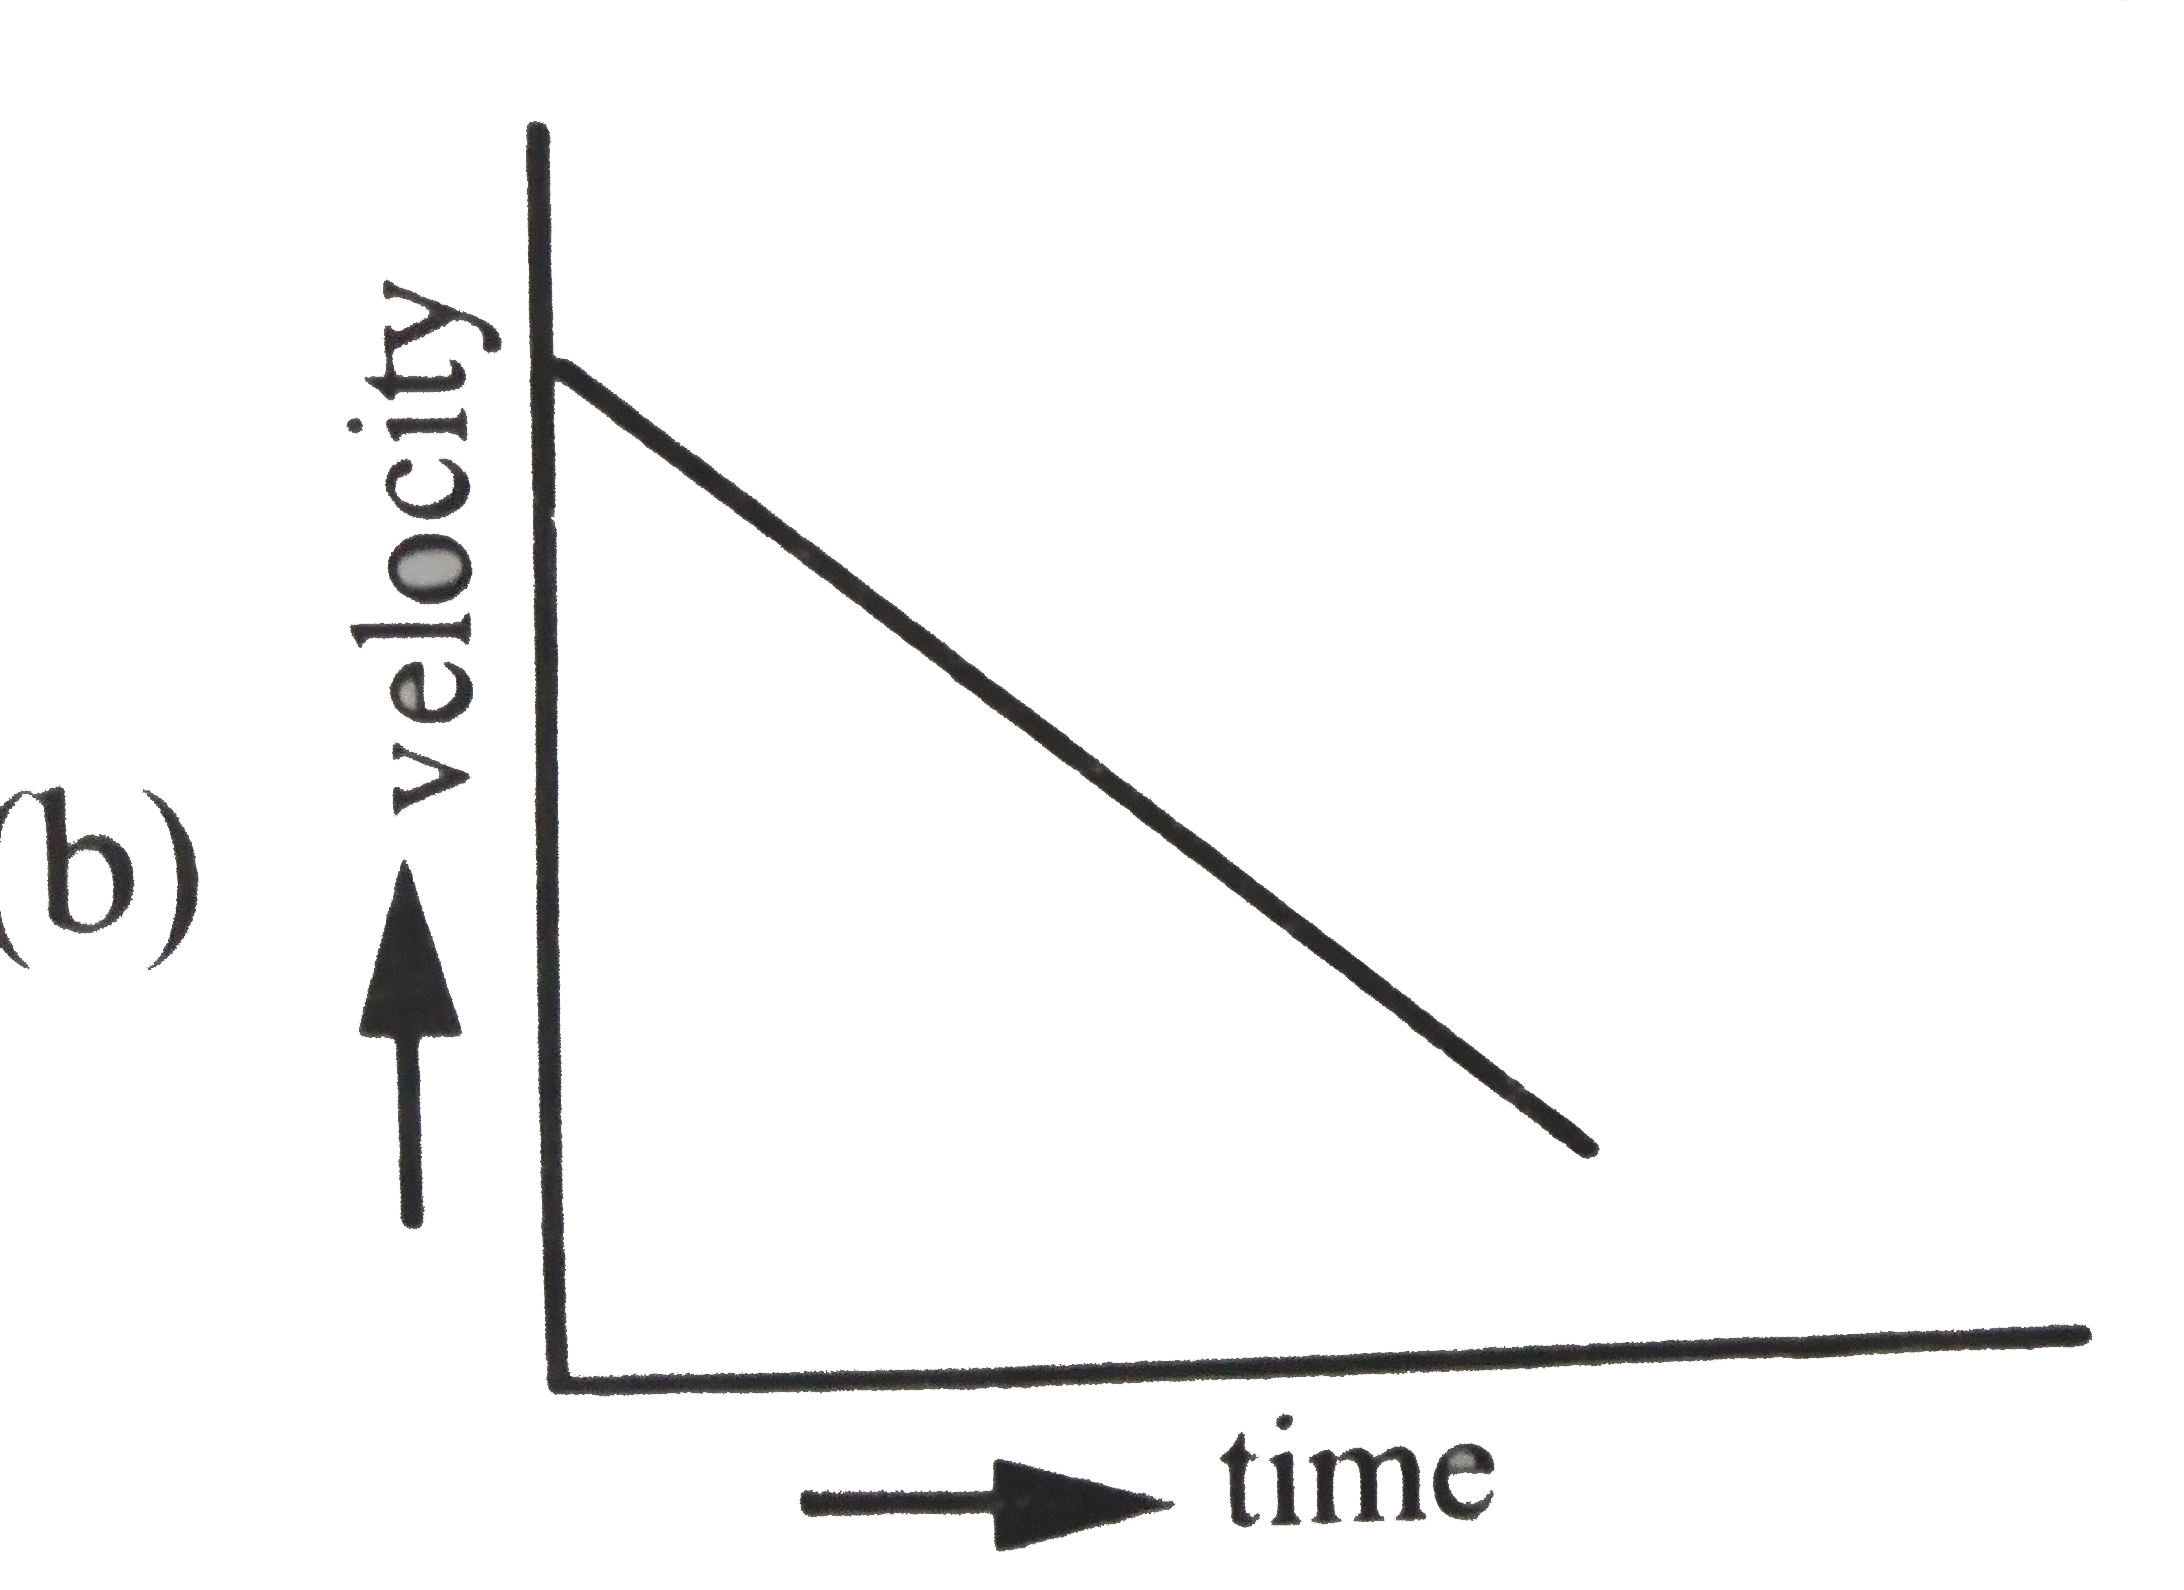 C
C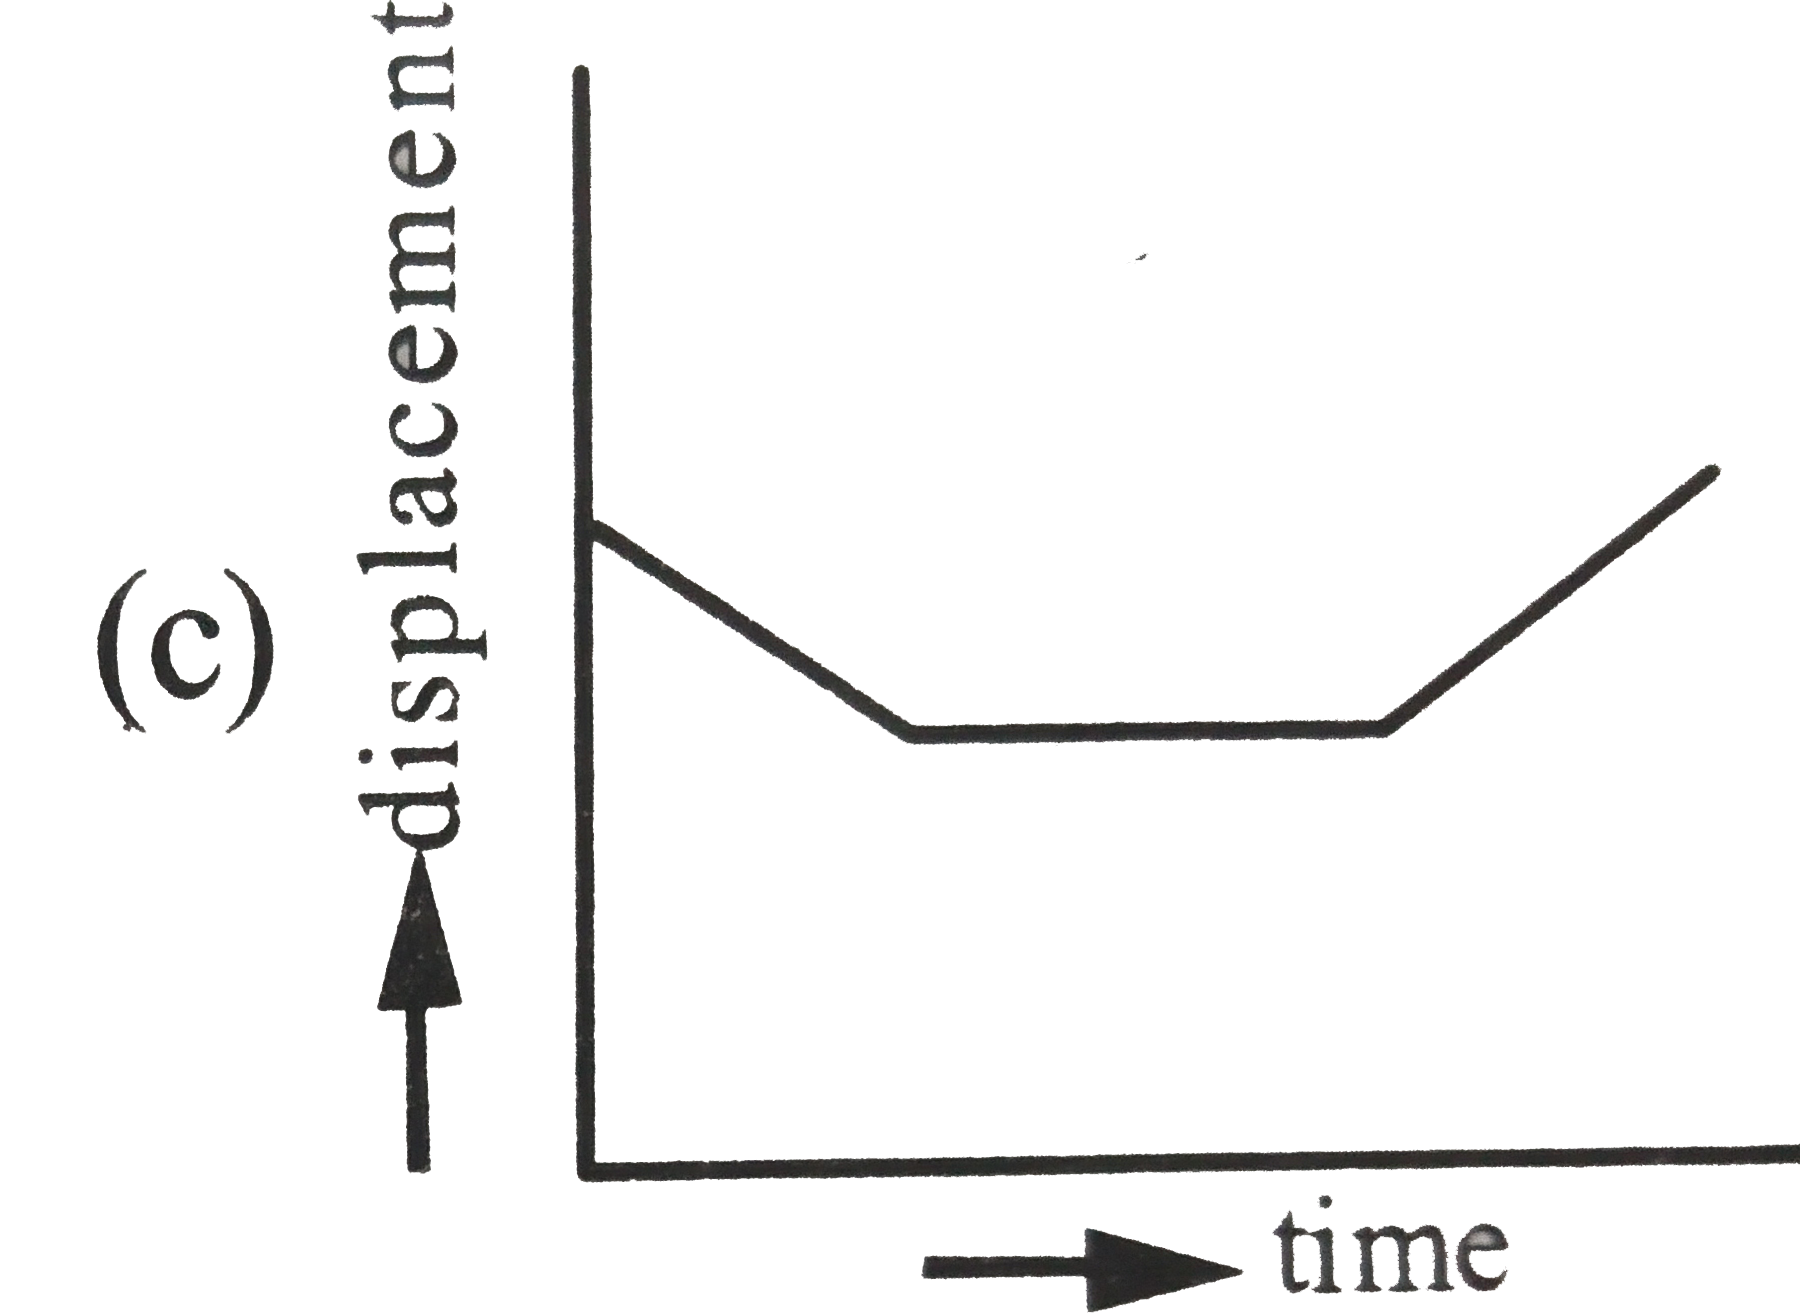 D
D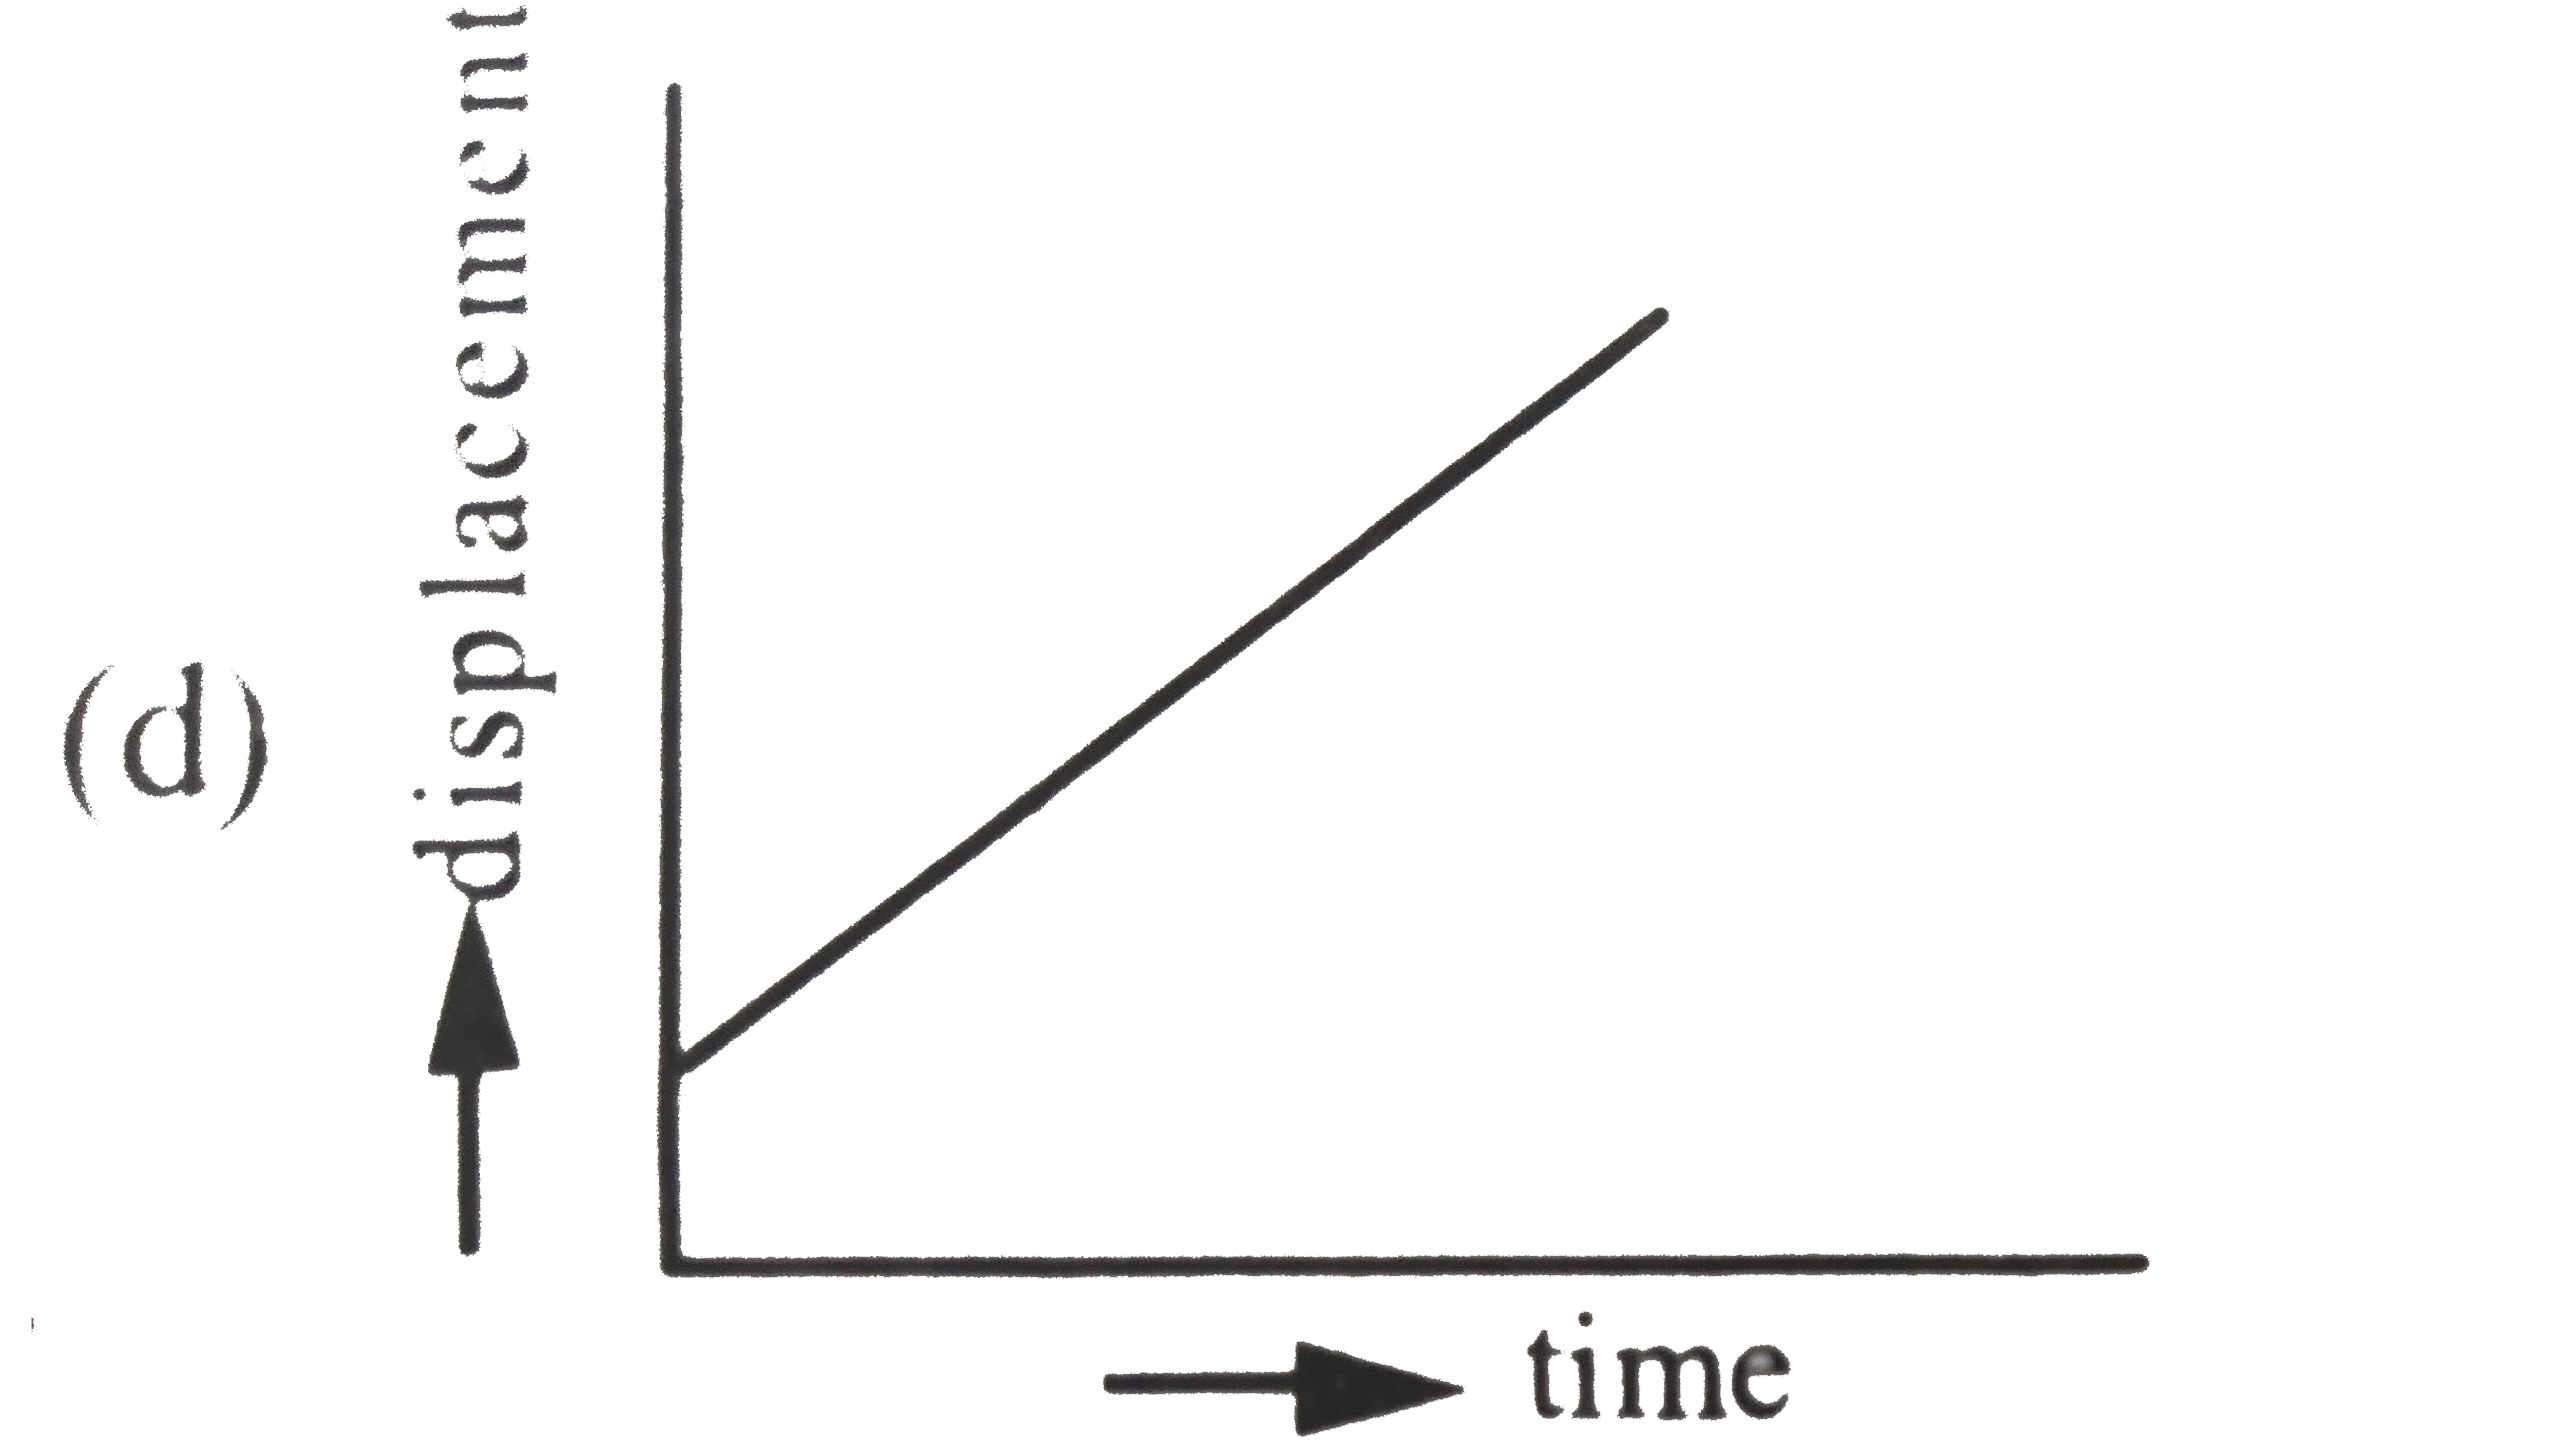
- Question 2 - Select One
Which of the following graphs best represents the motion of a raindrop?
A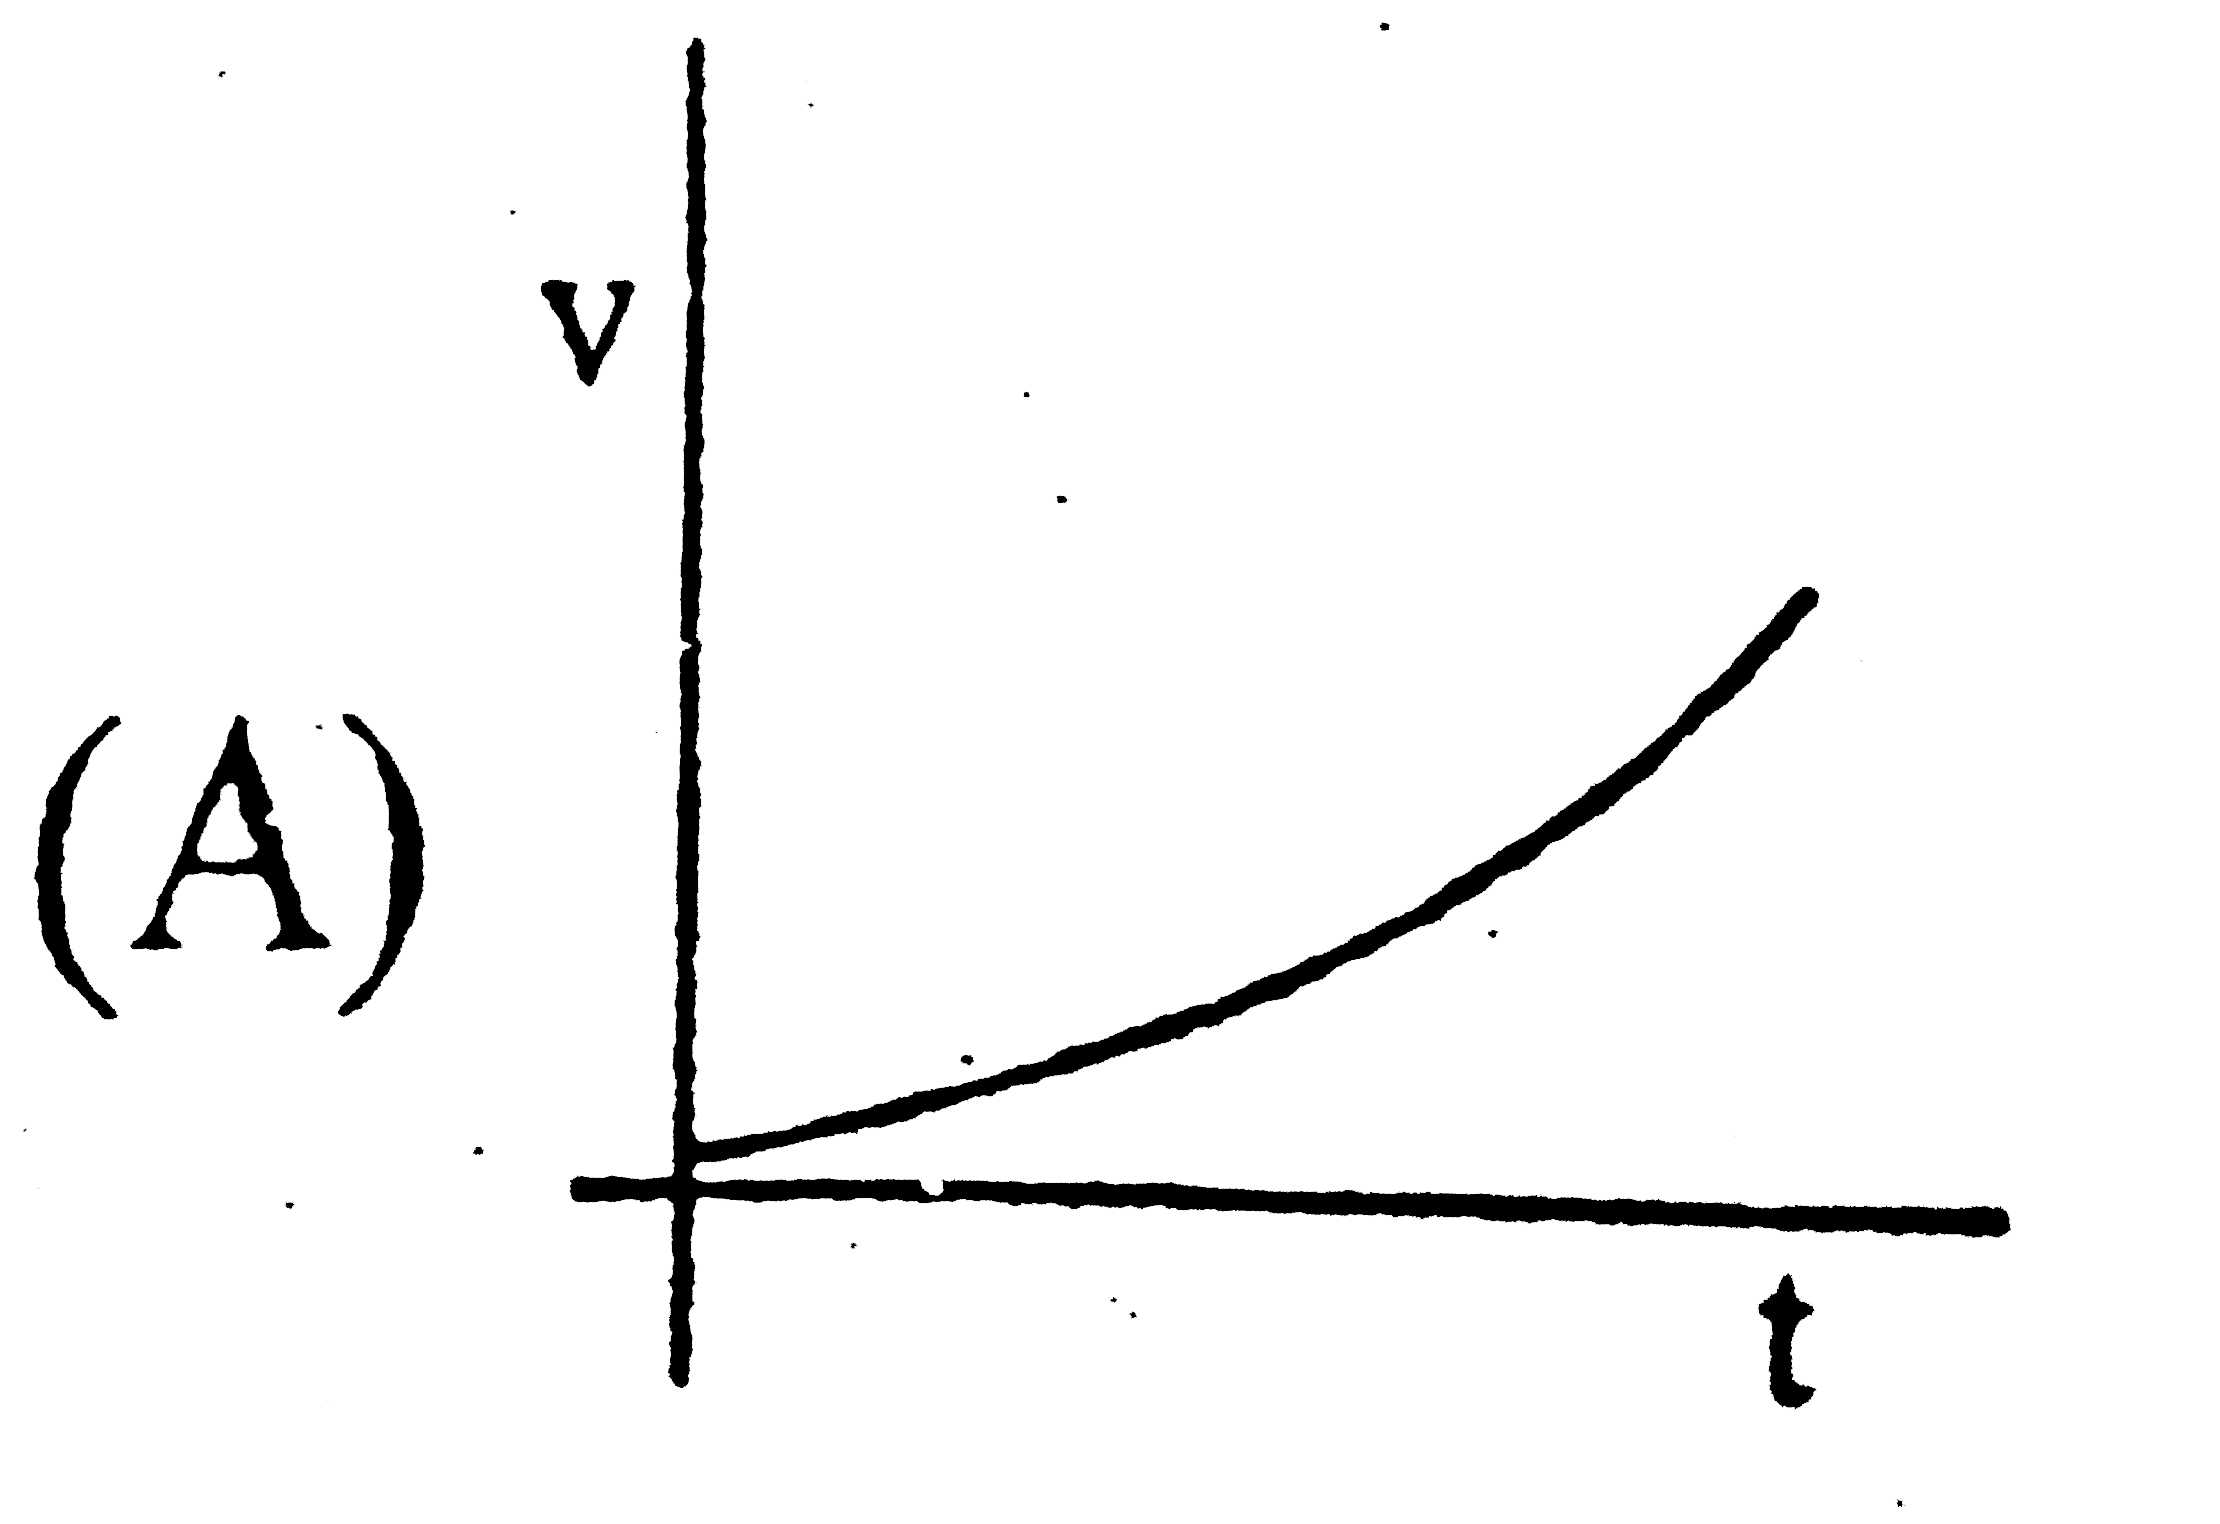 B
B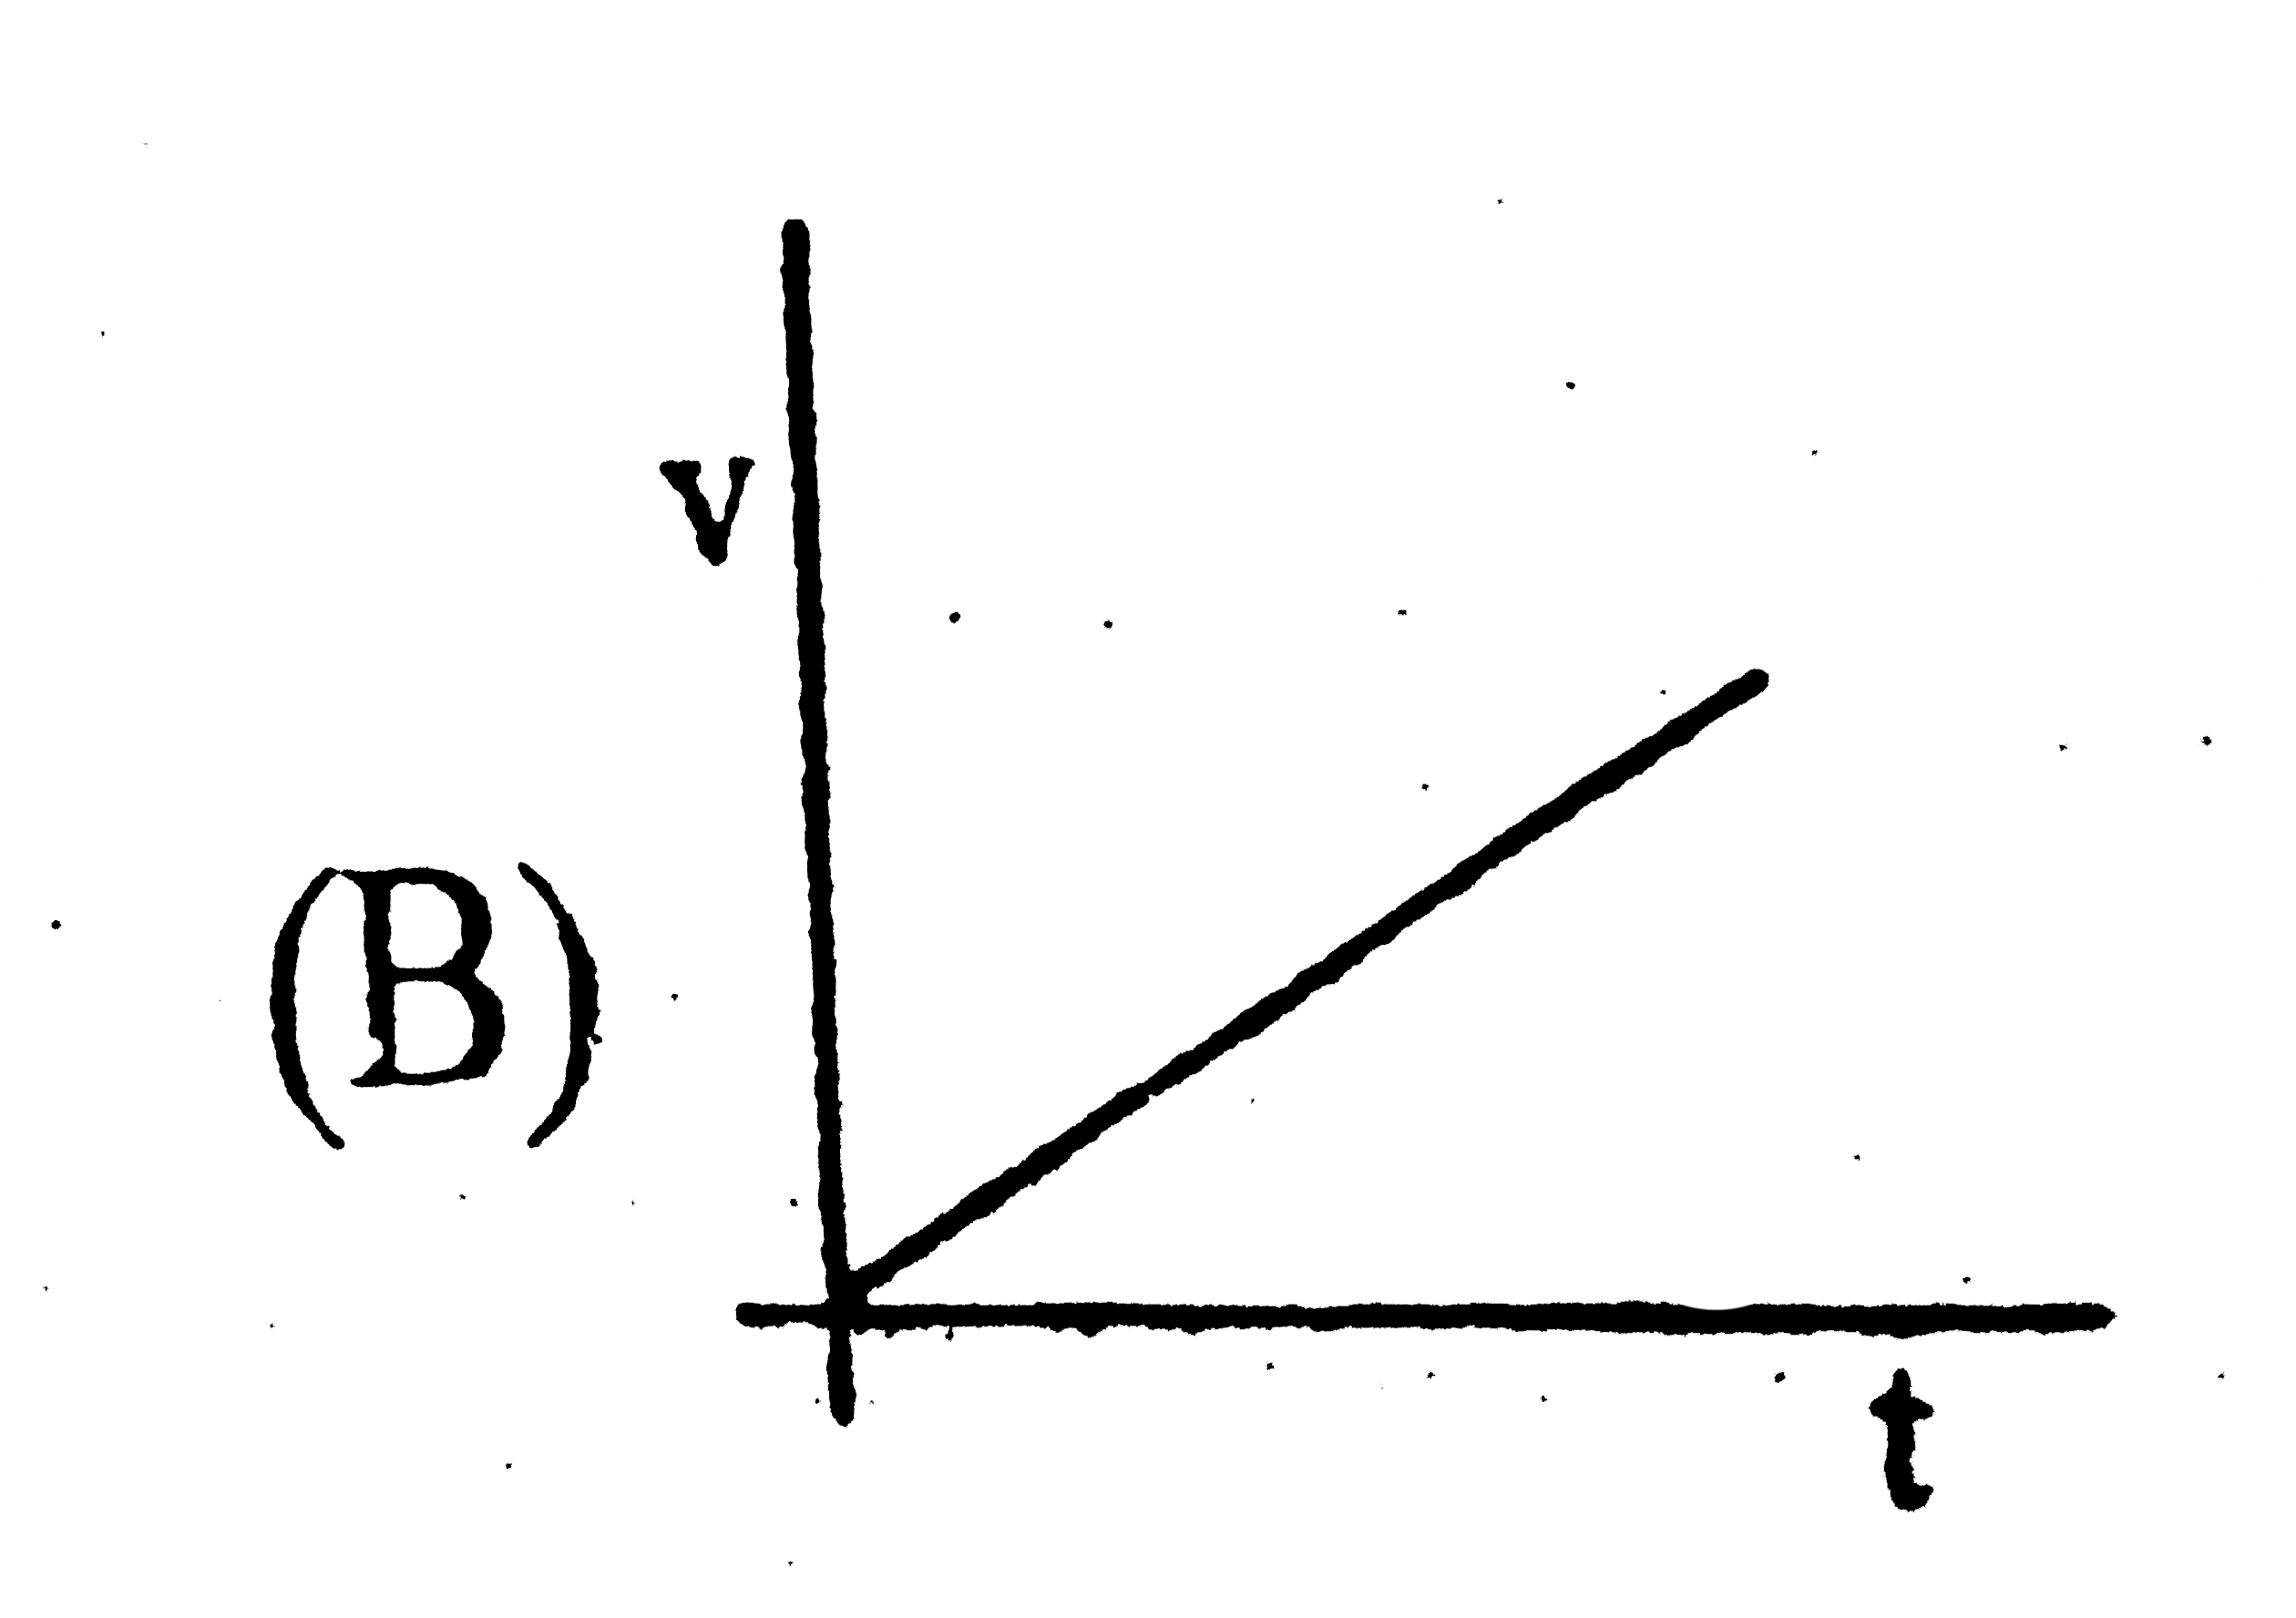 C
C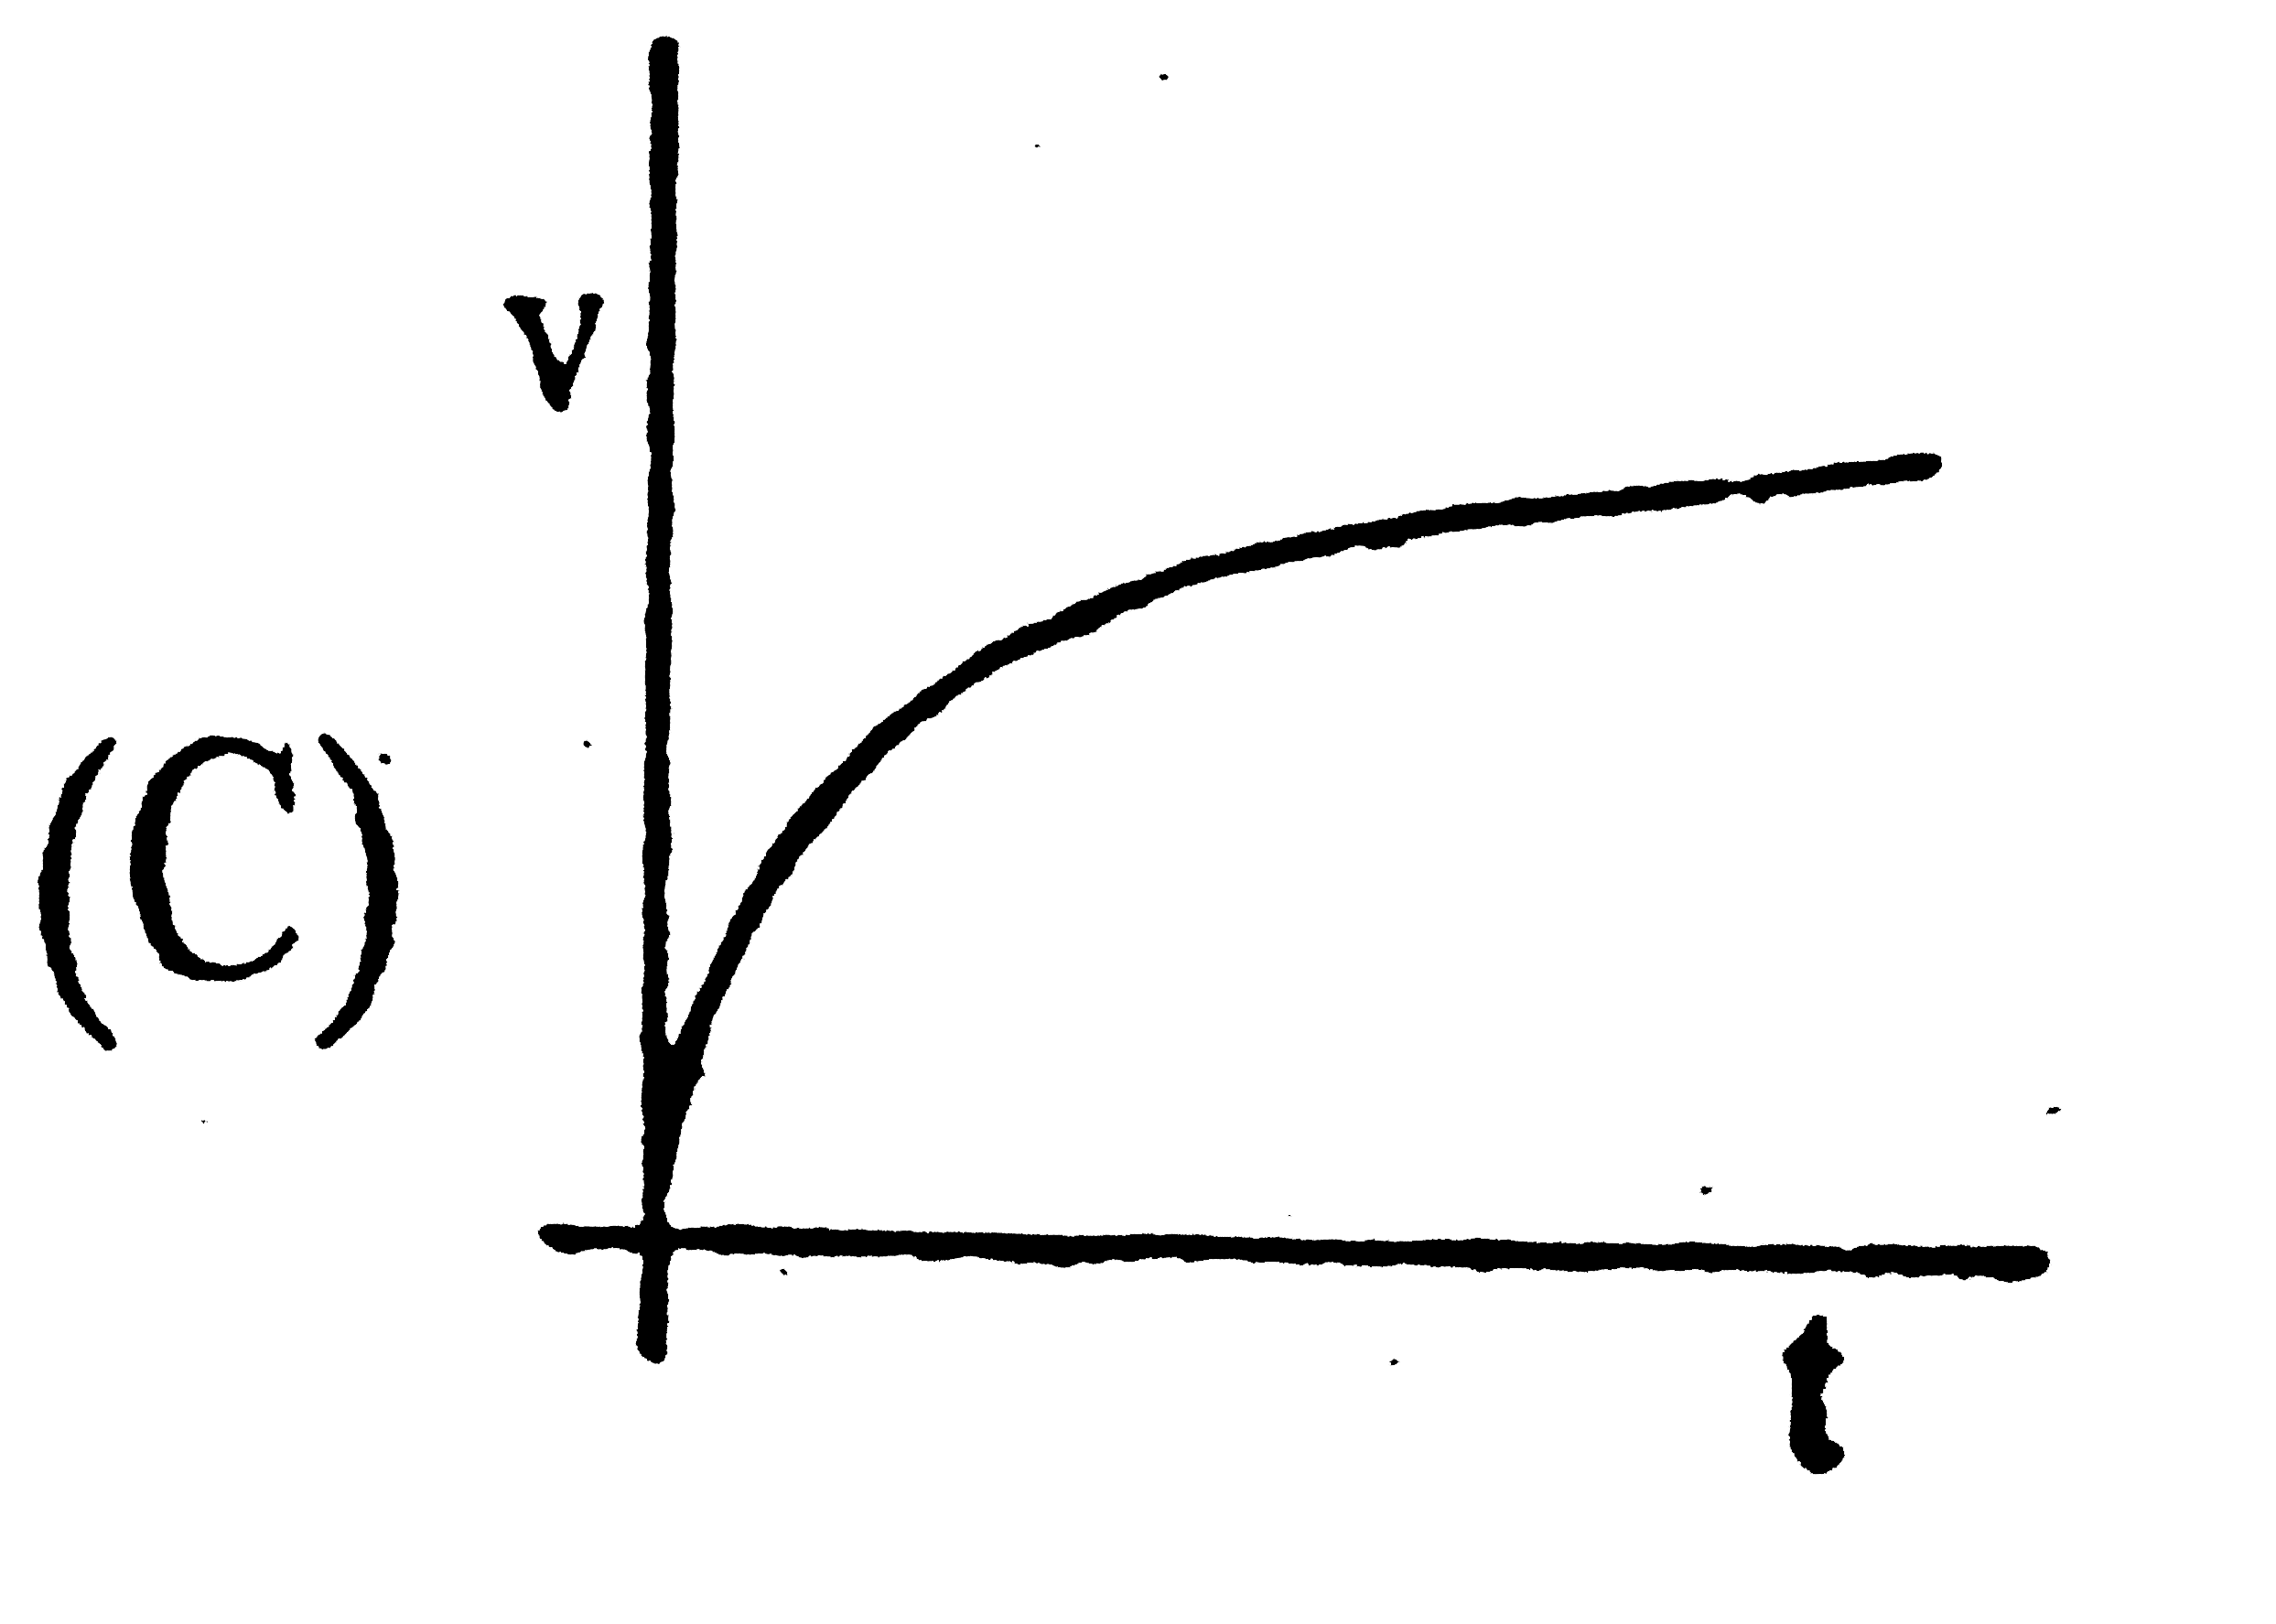 D
D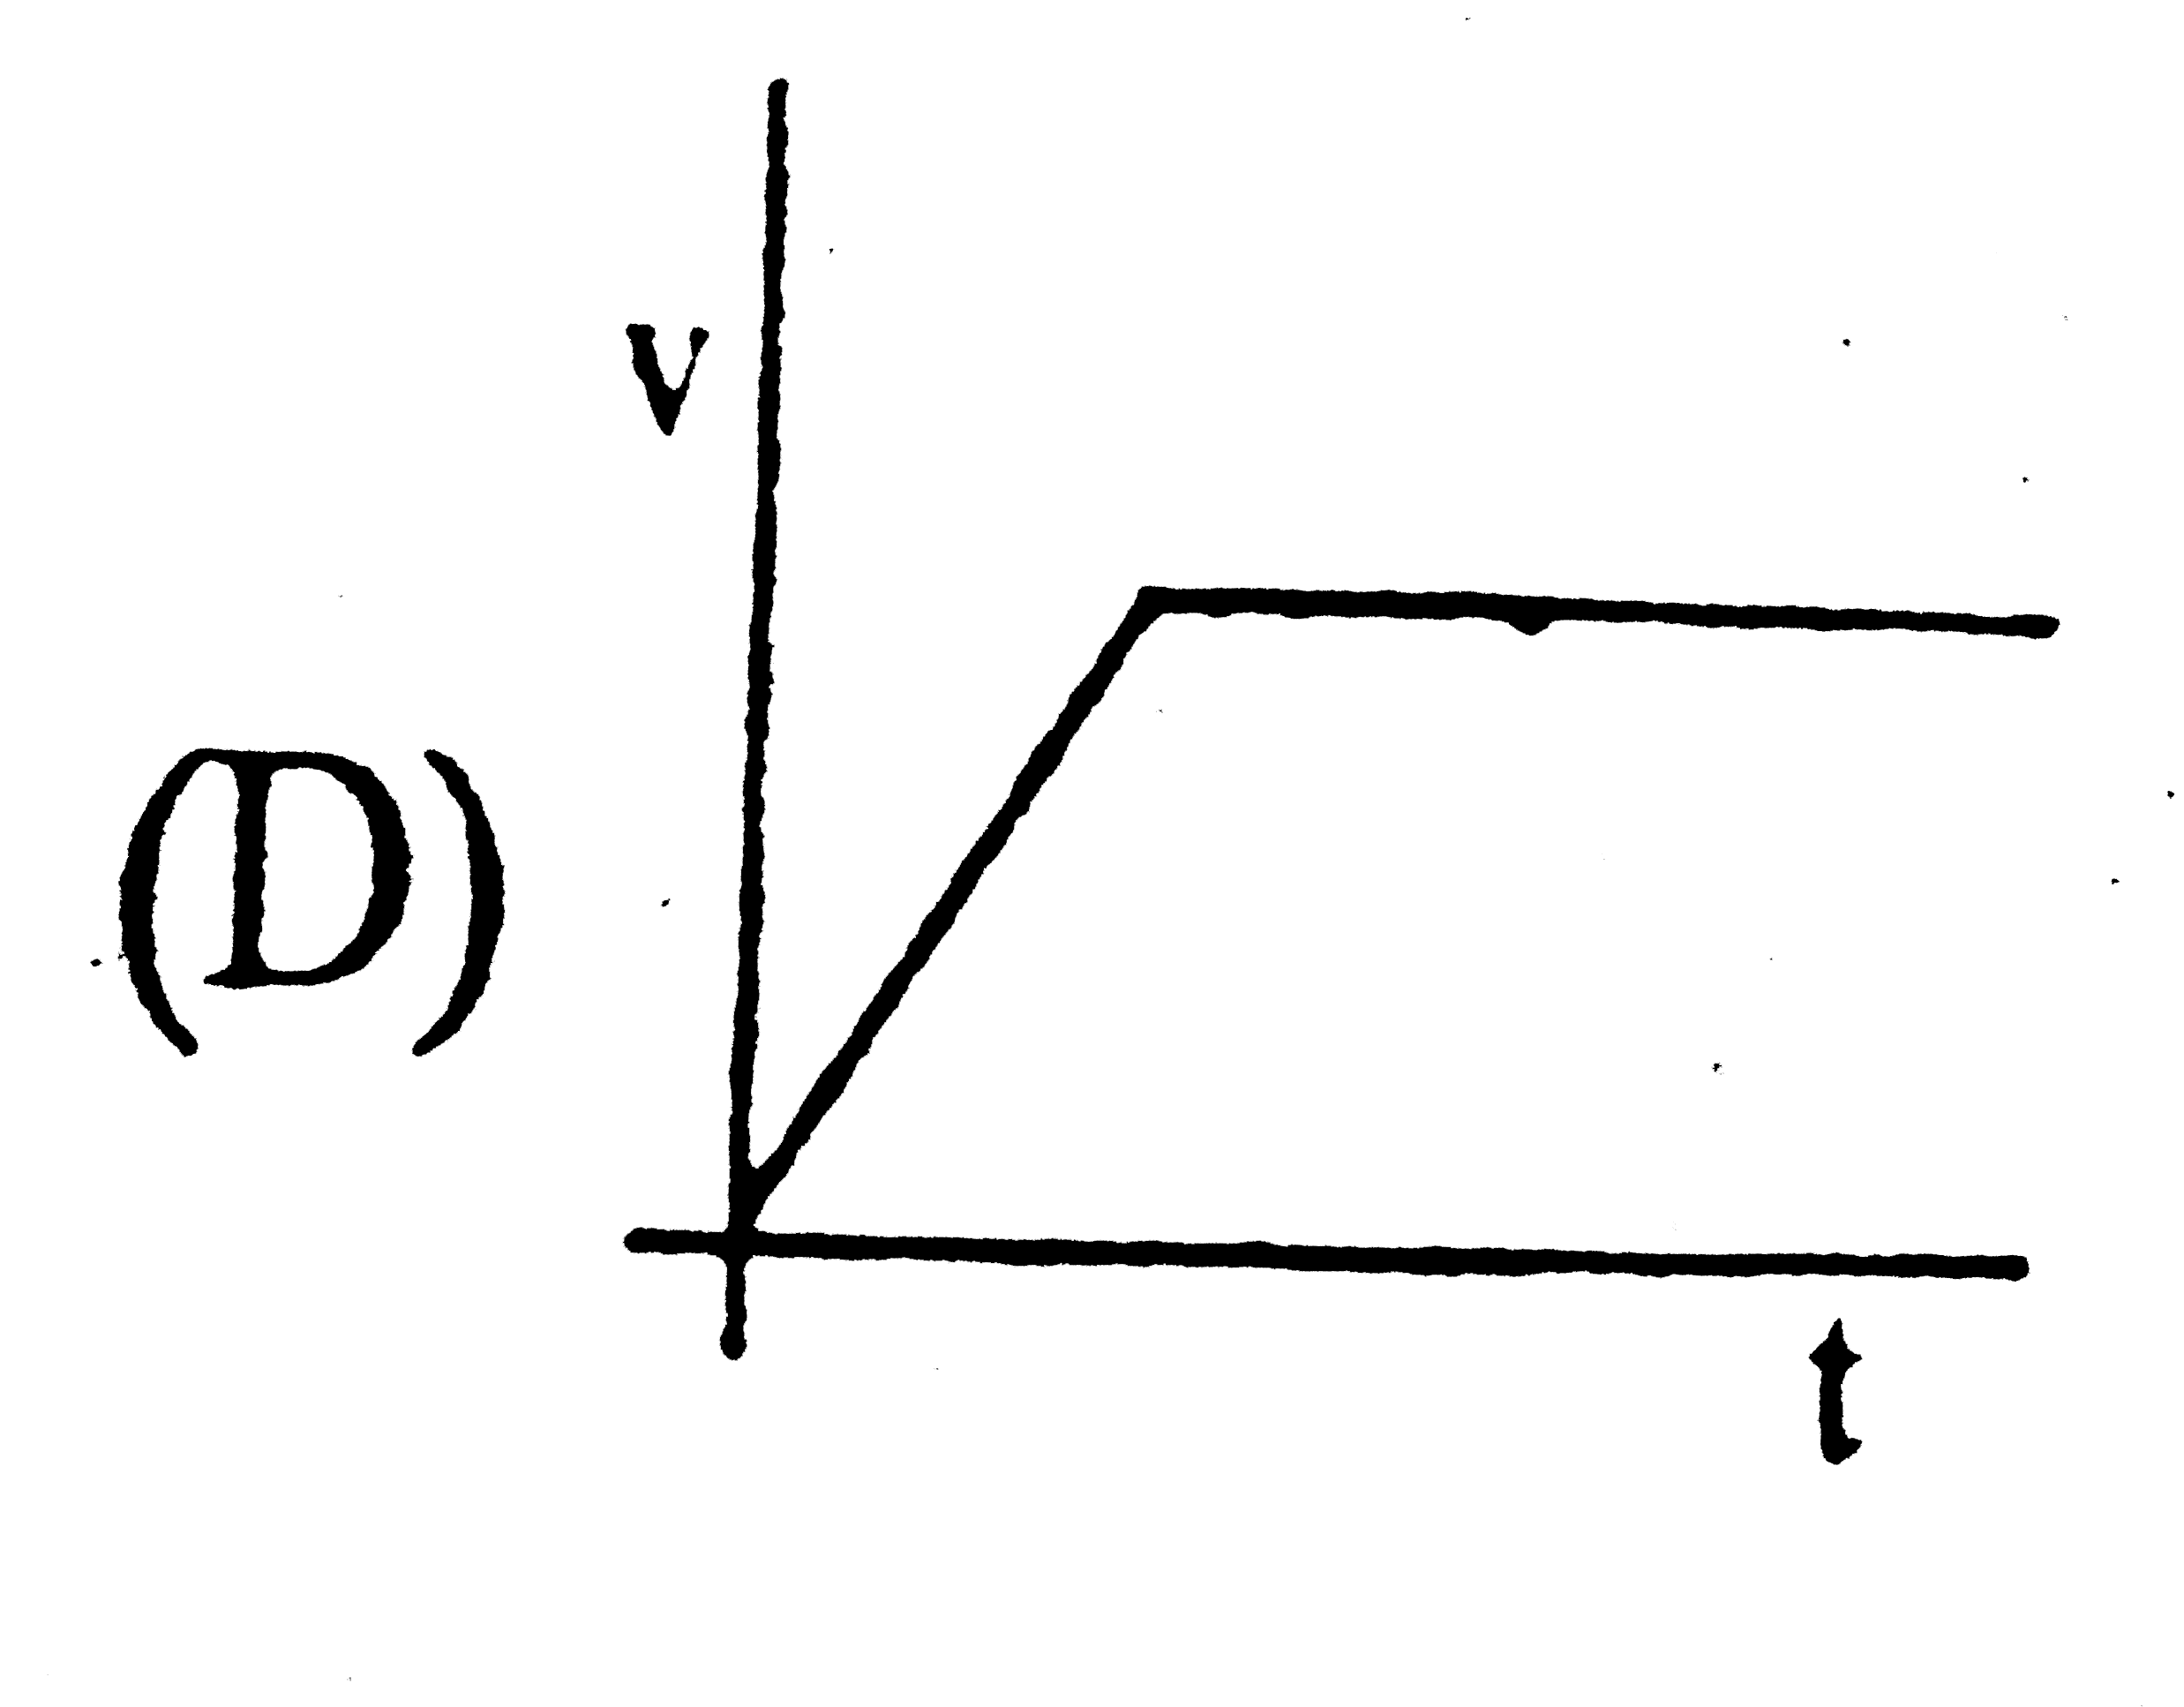
- Question 3 - Select One
The following graph represents the titration of pH vs volume
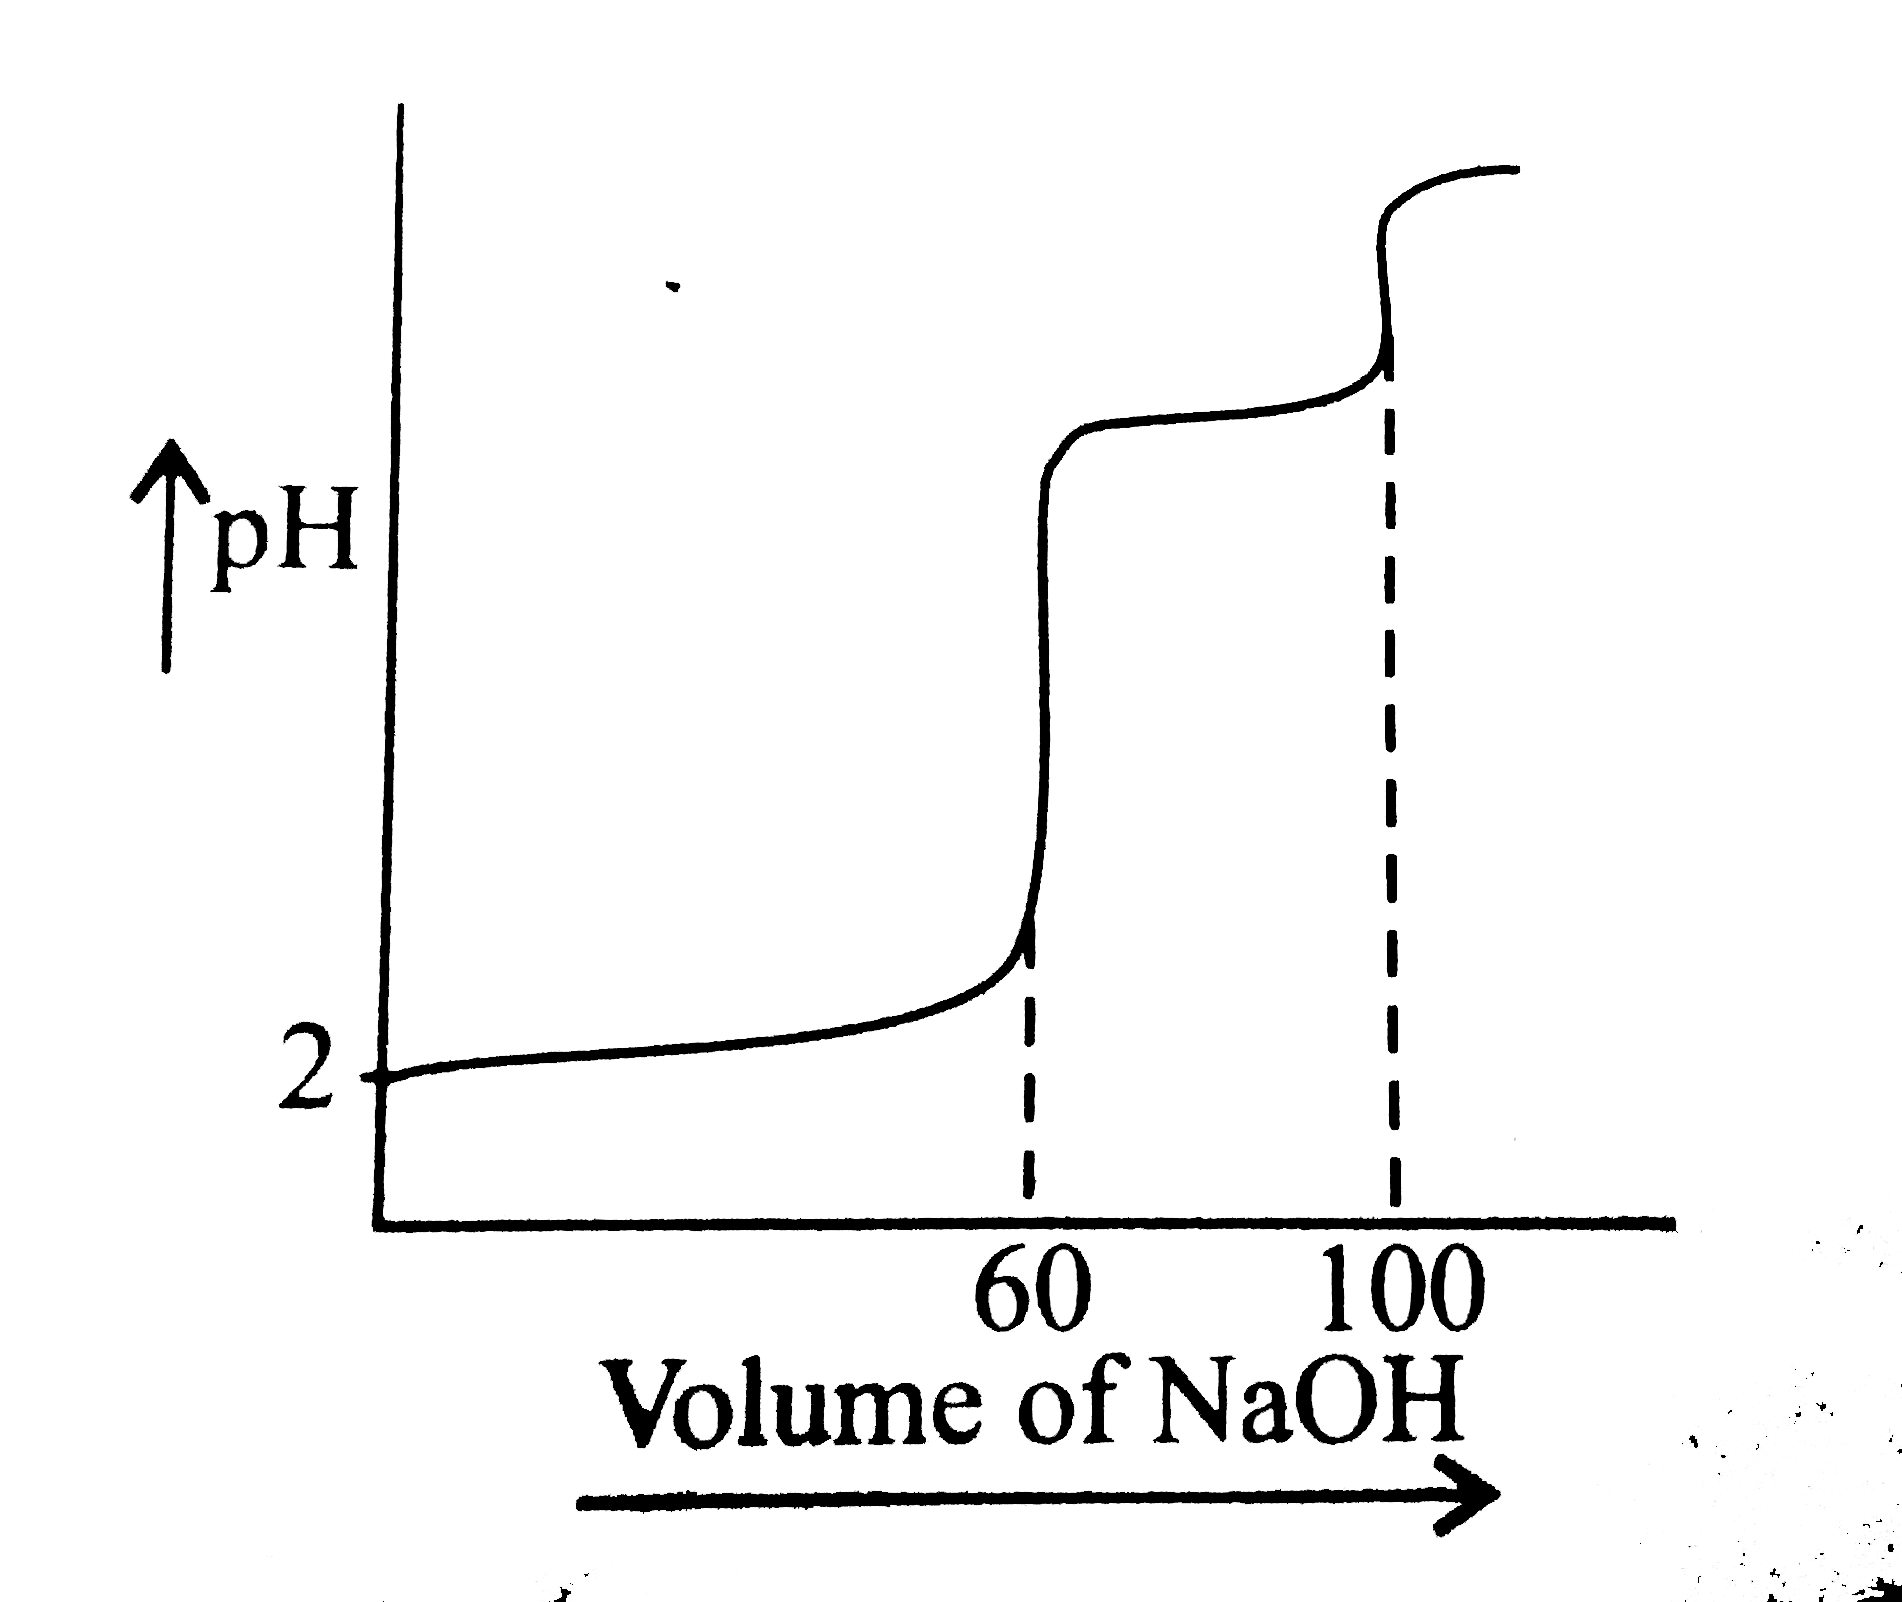 AA diprotic acid.BTwo monoprotic acids with the same Ka but different concentrations.CTwo monoprotic acids with different Ka but the same concentration.DTwo monoprotic acids with differnet Ka and different concentartions.
Which one of the following function best represent the graphs as shown below?
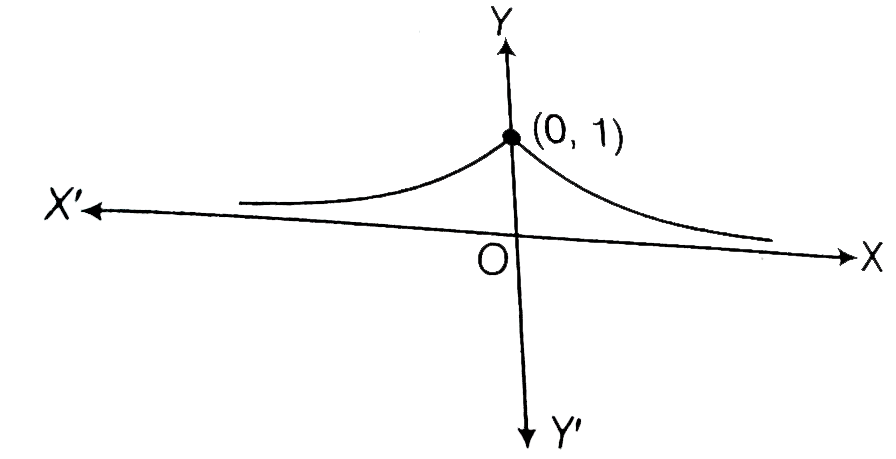 View Solution
29. Which one of following best represents the graph of y=xlogxπ
View SolutionWhich one of the following sets is best represented in the adjoining diagram?
View SolutionA body is thrown vertically upwards. Which one of the following graphs correctly represent the velocity vs time?
View SolutionIn problem No. 1 which of the following graphs best represents the current flowing from X to Y ?
View Solution


