The following graph shows the temperature forecast and the actual temperature for each day of a week.
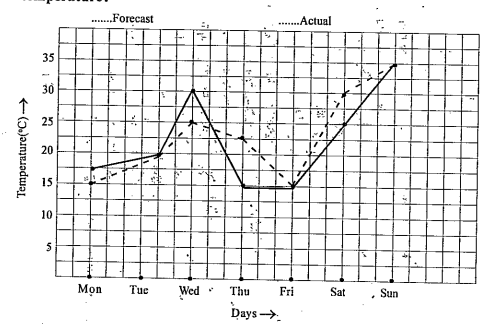
On which days was the forecast temperature the same as the actual temperature?Solution in Assamese
Step by step video & image solution for The following graph shows the temperature forecast and the actual temperature for each day of a week. On which days was the forecast temperature the same as the actual temperature? by Maths experts to help you in doubts & scoring excellent marks in Class 8 exams.
Updated on:21/07/2023Topper's Solved these Questions
Similar Questions
Find the common factors of the given terms.
12x,36
View SolutionSolve the following equations.
x−2=7
View SolutionThe following graph shows the temperature forecast and the actual temperature for each day of a week.(a) On which days was the forecast temperature the same as the actual temperature? (b) What was the maximum forecast temperature during the week?(c) What was the minimum actual temperature during the week?(d) On which day did the actual temperature differ the most from the forecast temperature?
View SolutionThe inequation that best describes the following graph is _________
View SolutionThe following line graph shows the temperature forecast and the actual temperature for each day of a week.
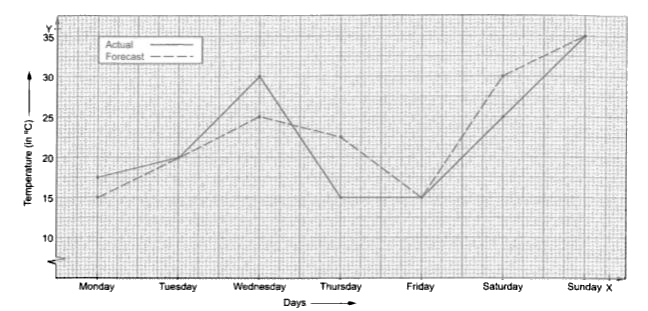
Study the above double line graph carefully and answer the questions given below:
(i) On which days was the forecast temperature the same as the actual temperature?
(ii) What was the maximum forecast temperature during the week ?
(iv) On which day did the actual temperature differ the most from the forecast temperature?
View SolutionThe following graph shows the temperature forecast and the actual temperature for each day of a week.(a) On which days was the forecast temperature the same as the actual temperature? (b) What was the maximum forecast temperature during the week?(c) What was the minimum actual temperature during the week?(d) On which day did the actual temperature differ the most from the forecast temperature?
View SolutionThe following graph shows the temperature forecast and the actual temperature for each day of a week.
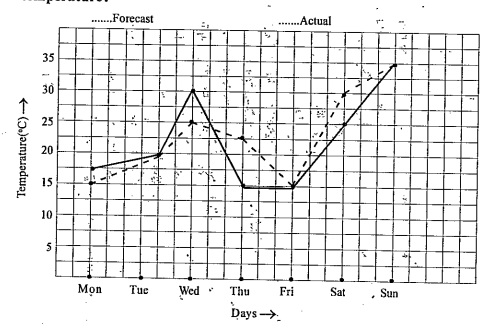
What was the maximum forecast temperature during the week?
View SolutionThe following graph shows the temperature forecast and the actual temperature for each day of a week.
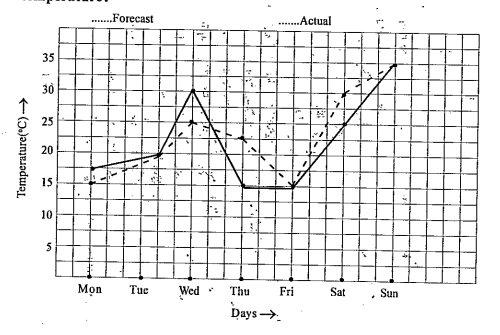
What was the minimum actual temperature during the week?
View SolutionThe following graph shows the temperature forecast and the actual temperature for each day of a week.
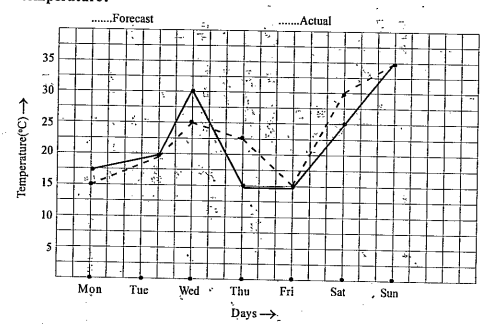
On which day did the actual temperature differ the most from the forecast temperature?
View SolutionThe graph below shows the forecast and actual temperature for each day of a week: Which day are the forecast temperature and the actual same?
View SolutionThe graph below shows the forecast and actual temperature for each day of a week: What was the maximum forecast temperature for the week?
View SolutionThe graph below shows the forecast and actual temperature for each day of a week: What was the minimum actual temperature for the week?
View SolutionThe graph below shows the forecast and actual temperature for each day of a week: On which day the difference between the actual temperature and the forecast temperature was greater?
View Solutionनिम्न आलेख, किसी सप्ताह के प्रत्येक दिन के लिए पूर्वानुमानित तापमान तथा वास्तविक तापमान दर्शाता है-
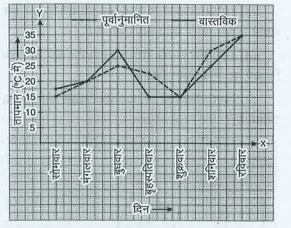 किस दिन पूर्वानुमानित तापमान व वास्तविक तापमान समान था?
View Solutionनिम्न आलेख, किसी सप्ताह के प्रत्येक दिन के लिए पूर्वानुमानित तापमान तथा वास्तविक तापमान दर्शाता है-
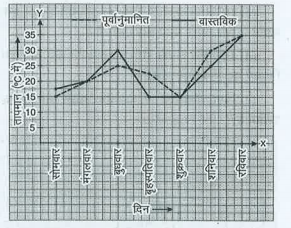 सप्ताह में पूर्वानुमानित अधिकतम तापमान क्या था?
View Solutionनिम्न आलेख, किसी सप्ताह के प्रत्येक दिन के लिए पूर्वानुमानित तापमान तथा वास्तविक तापमान दर्शाता है:
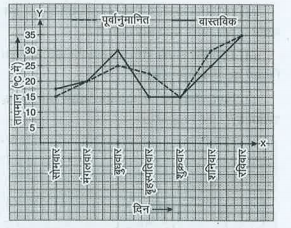 सप्ताह में वास्तविक न्यूनतम तापमान क्या था?
View Solution
