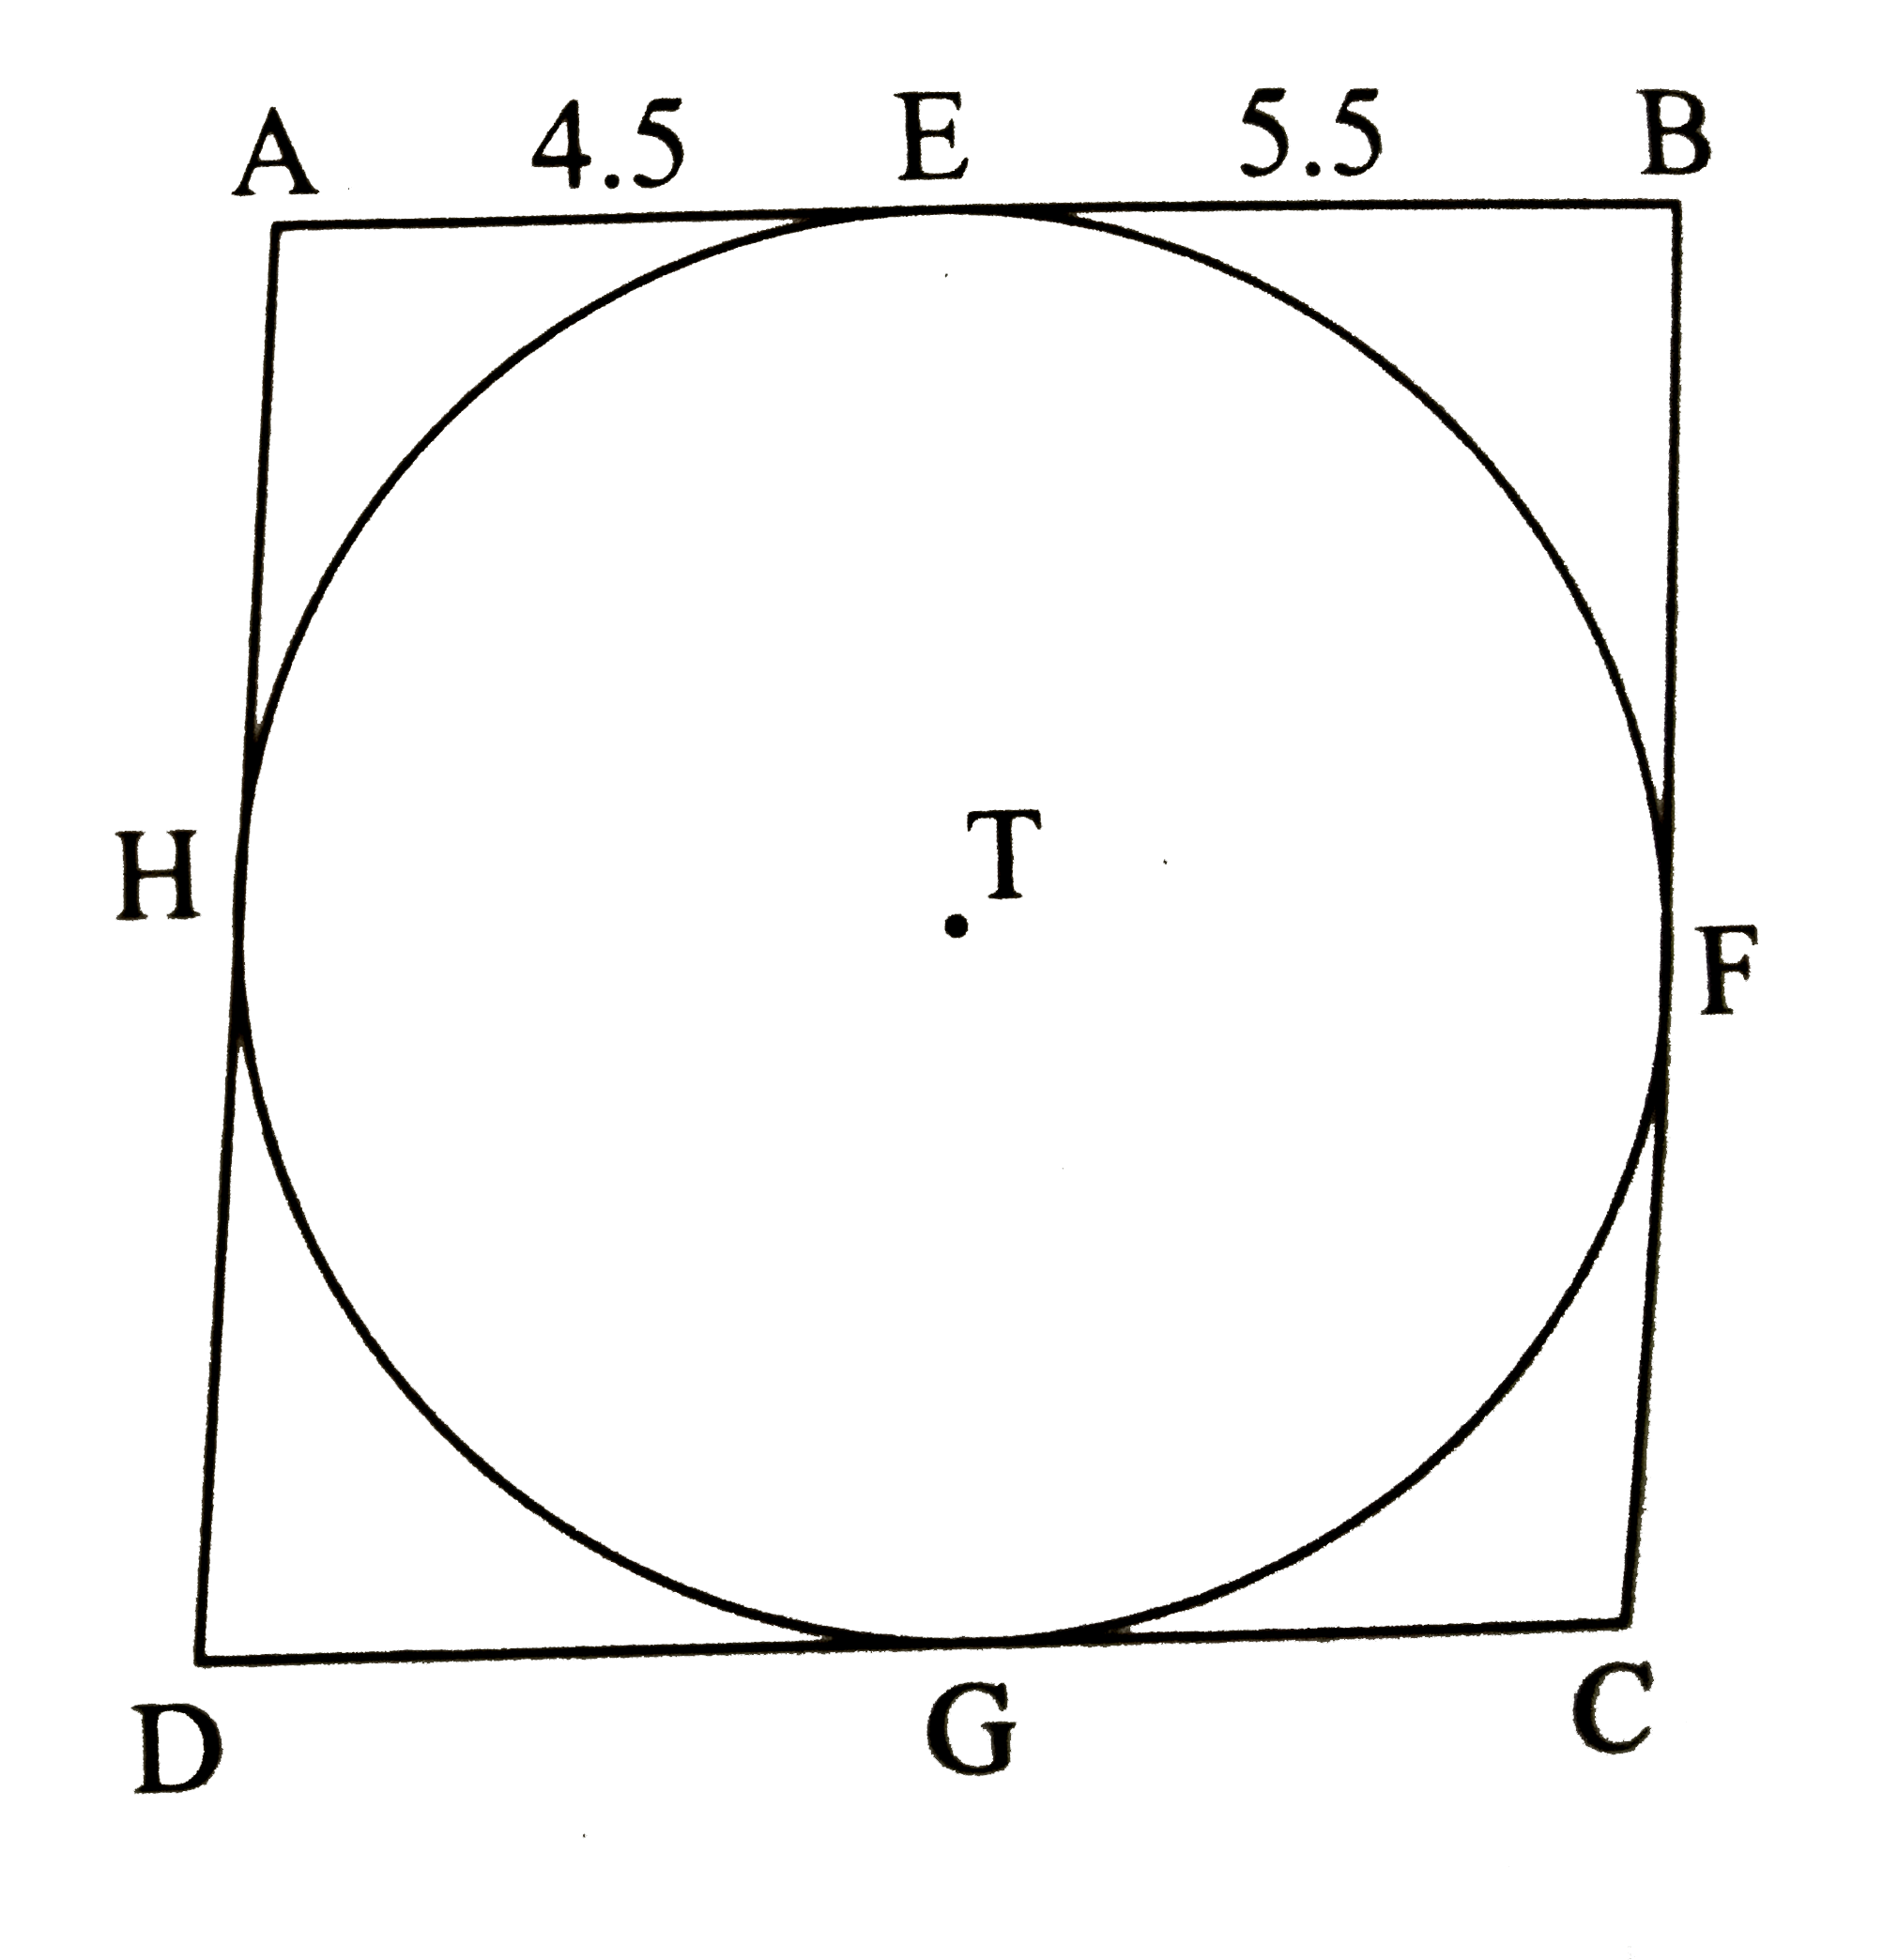
In the figure, □ABCD is a parallalogram. It circumscribes the
cirlcle with centre T. Point E,F,G,H are touching points. If AE = 4.5,
EB = 5.5, find AD.
 Solution in Marathi
The correct Answer is:∴AD=10 units
Step by step video & image solution for In the figure, square ABCD is a parallalogram. It circumscribes the cirlcle with centre T. Point E,F,G,H are touching points. If AE = 4.5, EB = 5.5, find AD. by Maths experts to help you in doubts & scoring excellent marks in Class 10 exams.
Updated on:21/07/2023Topper's Solved these Questions
- CIRCLEBOOK - TARGET PUBLICATIONCHAPTER - CIRCLEEXERCISE - Activities for Practice
3 Videos
- CIRCLEBOOK - TARGET PUBLICATIONCHAPTER - CIRCLEEXERCISE - Multiple Choice Question
27 Videos
- CIRCLEBOOK - TARGET PUBLICATIONCHAPTER - CIRCLEEXERCISE - Practice Set 3.5
3 Videos
- CHALLENGING QUESTIONS BOOK - TARGET PUBLICATIONCHAPTER - CHALLENGING QUESTIONS EXERCISE - CHAPTER-1 :Linear Equations in Two Variable
1 Videos
- CO-ORDINATE GEOMETRYBOOK - TARGET PUBLICATIONCHAPTER - CO-ORDINATE GEOMETRYEXERCISE - CHAPTER ASSESSMENT
15 Videos
Similar Questions
Complete the activity by filling the boxes.
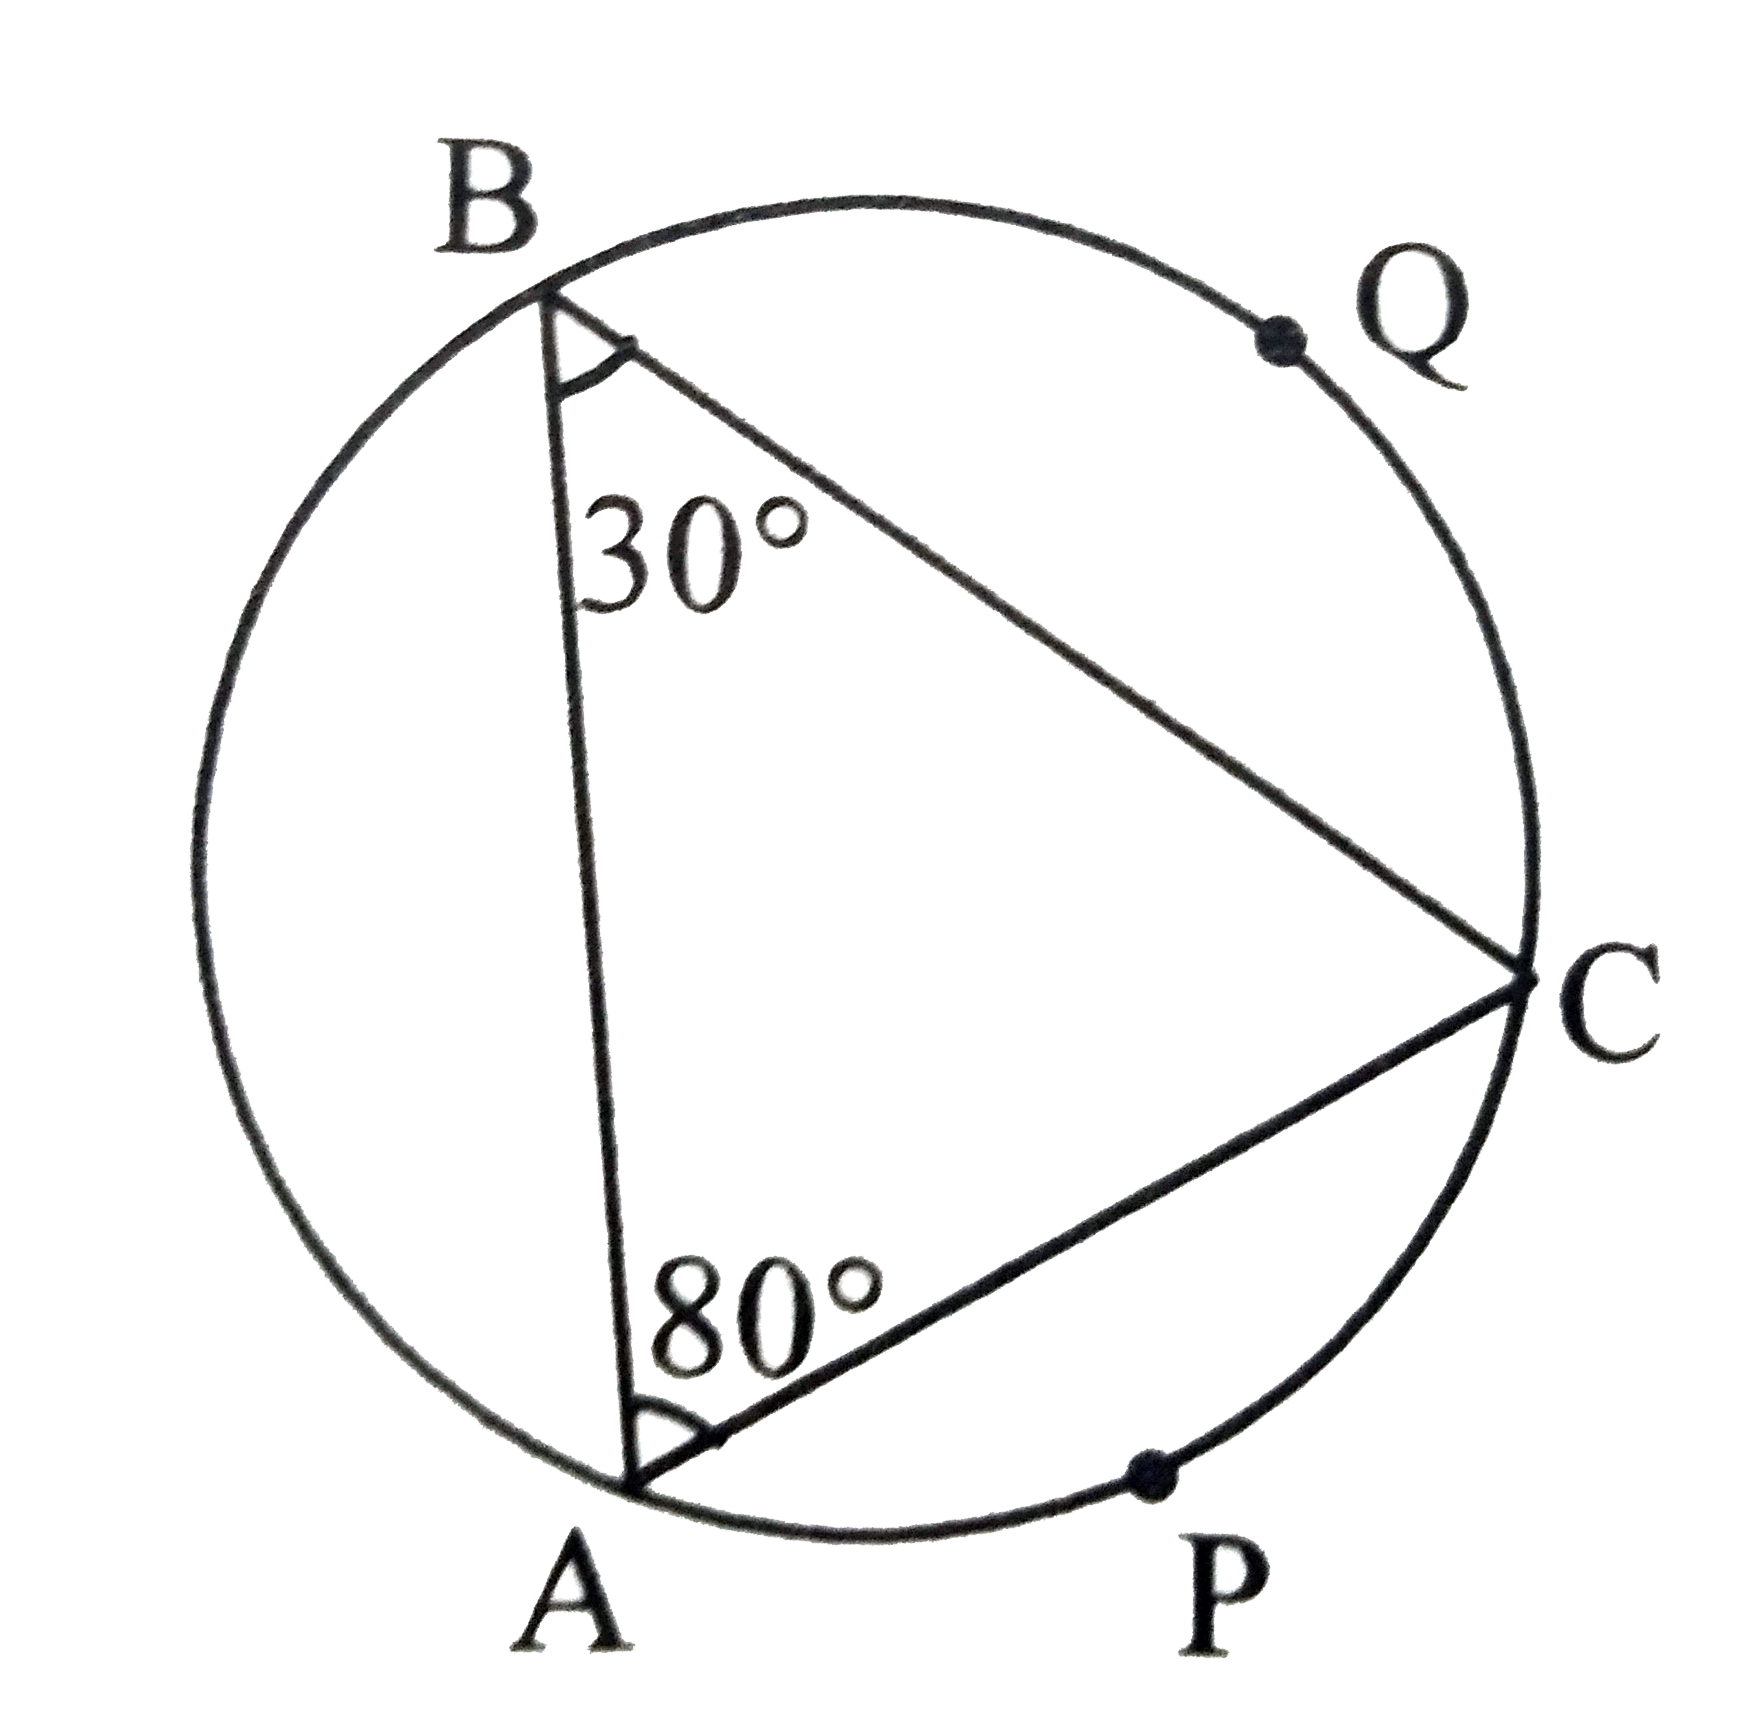
In the given figure , ∠BAC=80∘ ,∠ABC=30∘ and
m(arcBQC)=160∘.
Find (i) m(arcAPC) (ii) m(arcAB).

View SolutionConcentric Circles have the same______.
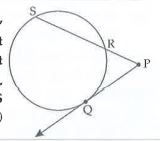
View SolutionIn the adjoining figure, point Q is the point of contact of tangent and the circle. If PQ=12, PR=8, then find PS and RS.

View SolutionSum of two numbers is 97. If the greater number is divided by the the smaller, the quotient is 7 and the remainder is 1. Find the numbers.
View SolutionChoose the correct alternative.
(i) The distance of Q (3,-1) from the origin is
View SolutionDetermine the point of symmetry of a regular hexagon.
View SolutionMatch the following Column A to Column B

View SolutionMatch the following Column A to Column B

View SolutionMatch the following Column A to Column B

View SolutionFind the area of figure given below.

View SolutionFind the perimeter of the figure given below.

View SolutionFind the area of the figure given below.

View SolutionThe inequation represented by the graph given below is :
View SolutionThe inequation that best describes the graph given below is _________
View SolutionThe inequation that best describes the following graph is _________
View Solution
