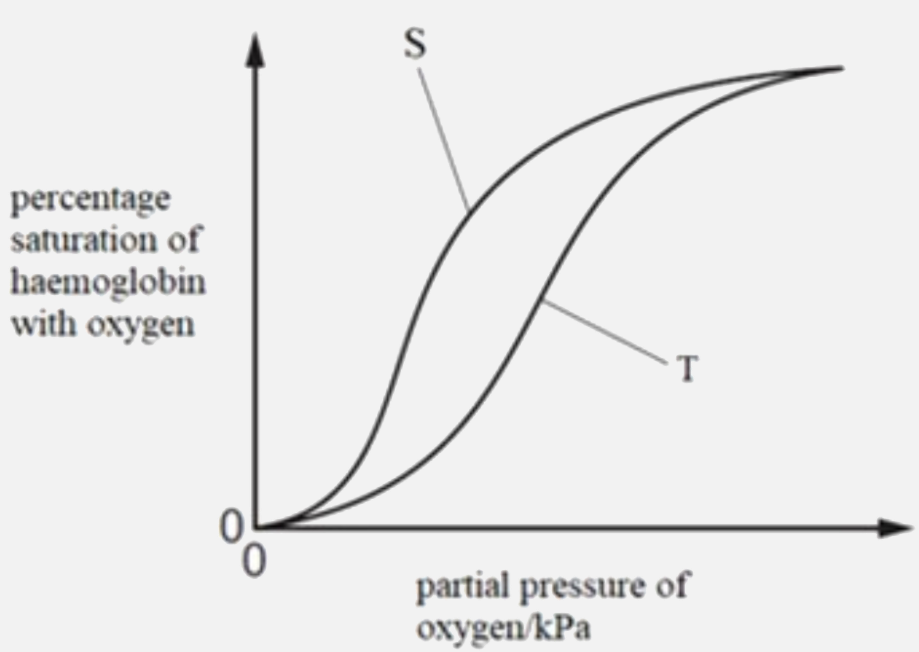
The graph shows the oxygen dissociation curves of haemoglobin from two species of mammals, s and T .

Which statements could explain the difference in the oxygen dissociation curves of species S and species T ?
I. Species T has higher haemoglobin concentration in its red blood cells than species S.
II. The haemoglobin in species T has a lower affinity for oxygen than the haemoglobin in species S.
III. Species T may be living at a higher altitudes than species S.
I, and III only
II and III only
I,II and III
III only
The correct Answer is:C
Step by step video & image solution for The graph shows the oxygen dissociation curves of haemoglobin from two species of mammals, s and T . Which statements could explain the difference in the oxygen dissociation curves of species S and species T ? I. Species T has higher haemoglobin concentration in its red blood cells than species S. II. The haemoglobin in species T has a lower affinity for oxygen than the haemoglobin in species S. III. Species T may be living at a higher altitudes than species S. by Biology experts to help you in doubts & scoring excellent marks in Class 12 exams.
Updated on:21/07/2023Similar Questions
Knowledge Check
The oxygen dissociation curve is
AparabolaBslopeCsigmoidDstright line.Fetal haemoglobin has X affinity for oxygen than that of mother's haemoglobin during gestation. X is
AsameBhigherClowerDlower affinity earlier but higher later.The oxygen dissociation curve will show a right shift in case of:
Ahigh PCO2Bhigh PO2Clow PCO2Dless H+ concentration
What is the shape of O2 dissociation curve for haemoglobin ?
View SolutionIn which conditon oxygen dissociation curve of haemoglobin shift to right of normal curve ?
View SolutionHaemoglobin has greater affinity for
View SolutionPercentage of oxygen supplied by haemoglobin is
View SolutionWhen parital pressure of CO2(pCO2) rises the oxygen dissociation curve of haemoglobin will
View Solution
