The same enzyme catalyzed reaction showed tow differenet kinetic patterns as shown in the graph. Y-axis indicates prouduct formed and X-axis indicates time. Mark the correct interpretation.
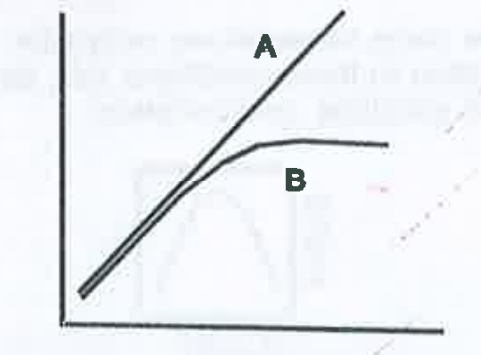
Reaction A is carried out at higher tempreature than B
Reaction B is carried out at a pH higher than that for reaction A.
Substrate in replensihed form time to time in reaction A and not in B
Only reaction A is carried out at optimumion concentraion
The correct Answer is:C
Step by step video & image solution for The same enzyme catalyzed reaction showed tow differenet kinetic patterns as shown in the graph. Y-axis indicates prouduct formed and X-axis indicates time. Mark the correct interpretation. by Biology experts to help you in doubts & scoring excellent marks in Class 11 exams.
Updated on:21/07/2023Topper's Solved these Questions
- ANIMAL TISSUES BOOK - TRUEMEN BIOLOGY ENGLISHCHAPTER - ANIMAL TISSUES EXERCISE - MULTIPLE CHOICE QUESTIONS
193 Videos
- CELL- THE BASIC UNIT OF LIFE ( CELL AND ITS STRUCTURAL ORGANISATION )BOOK - TRUEMEN BIOLOGY ENGLISHCHAPTER - CELL- THE BASIC UNIT OF LIFE ( CELL AND ITS STRUCTURAL ORGANISATION )EXERCISE - MULTIPLE CHOICE ANSWER TYPE
308 Videos
Similar Questions
Knowledge Check
Scientists plotted data for two animal populations on a scatterplot: population A, which they graphed along the x-axis, and population B, which they graphed along the y-axis. The data showed a strong negative correlation. Which of the following statements is justified ?
AThe rise in population A caused the decline in population B.BThe decline in population B caused the rise in population A.CBecause the correlation is negative, there cannot be causation between the two populations.DThe rise in populatin A is correlated to the decline in population B, but causation is unknown.
For a particle moving along x-axis, a scaled x-6 graph is shown in figure. Mark the correct statement (s).
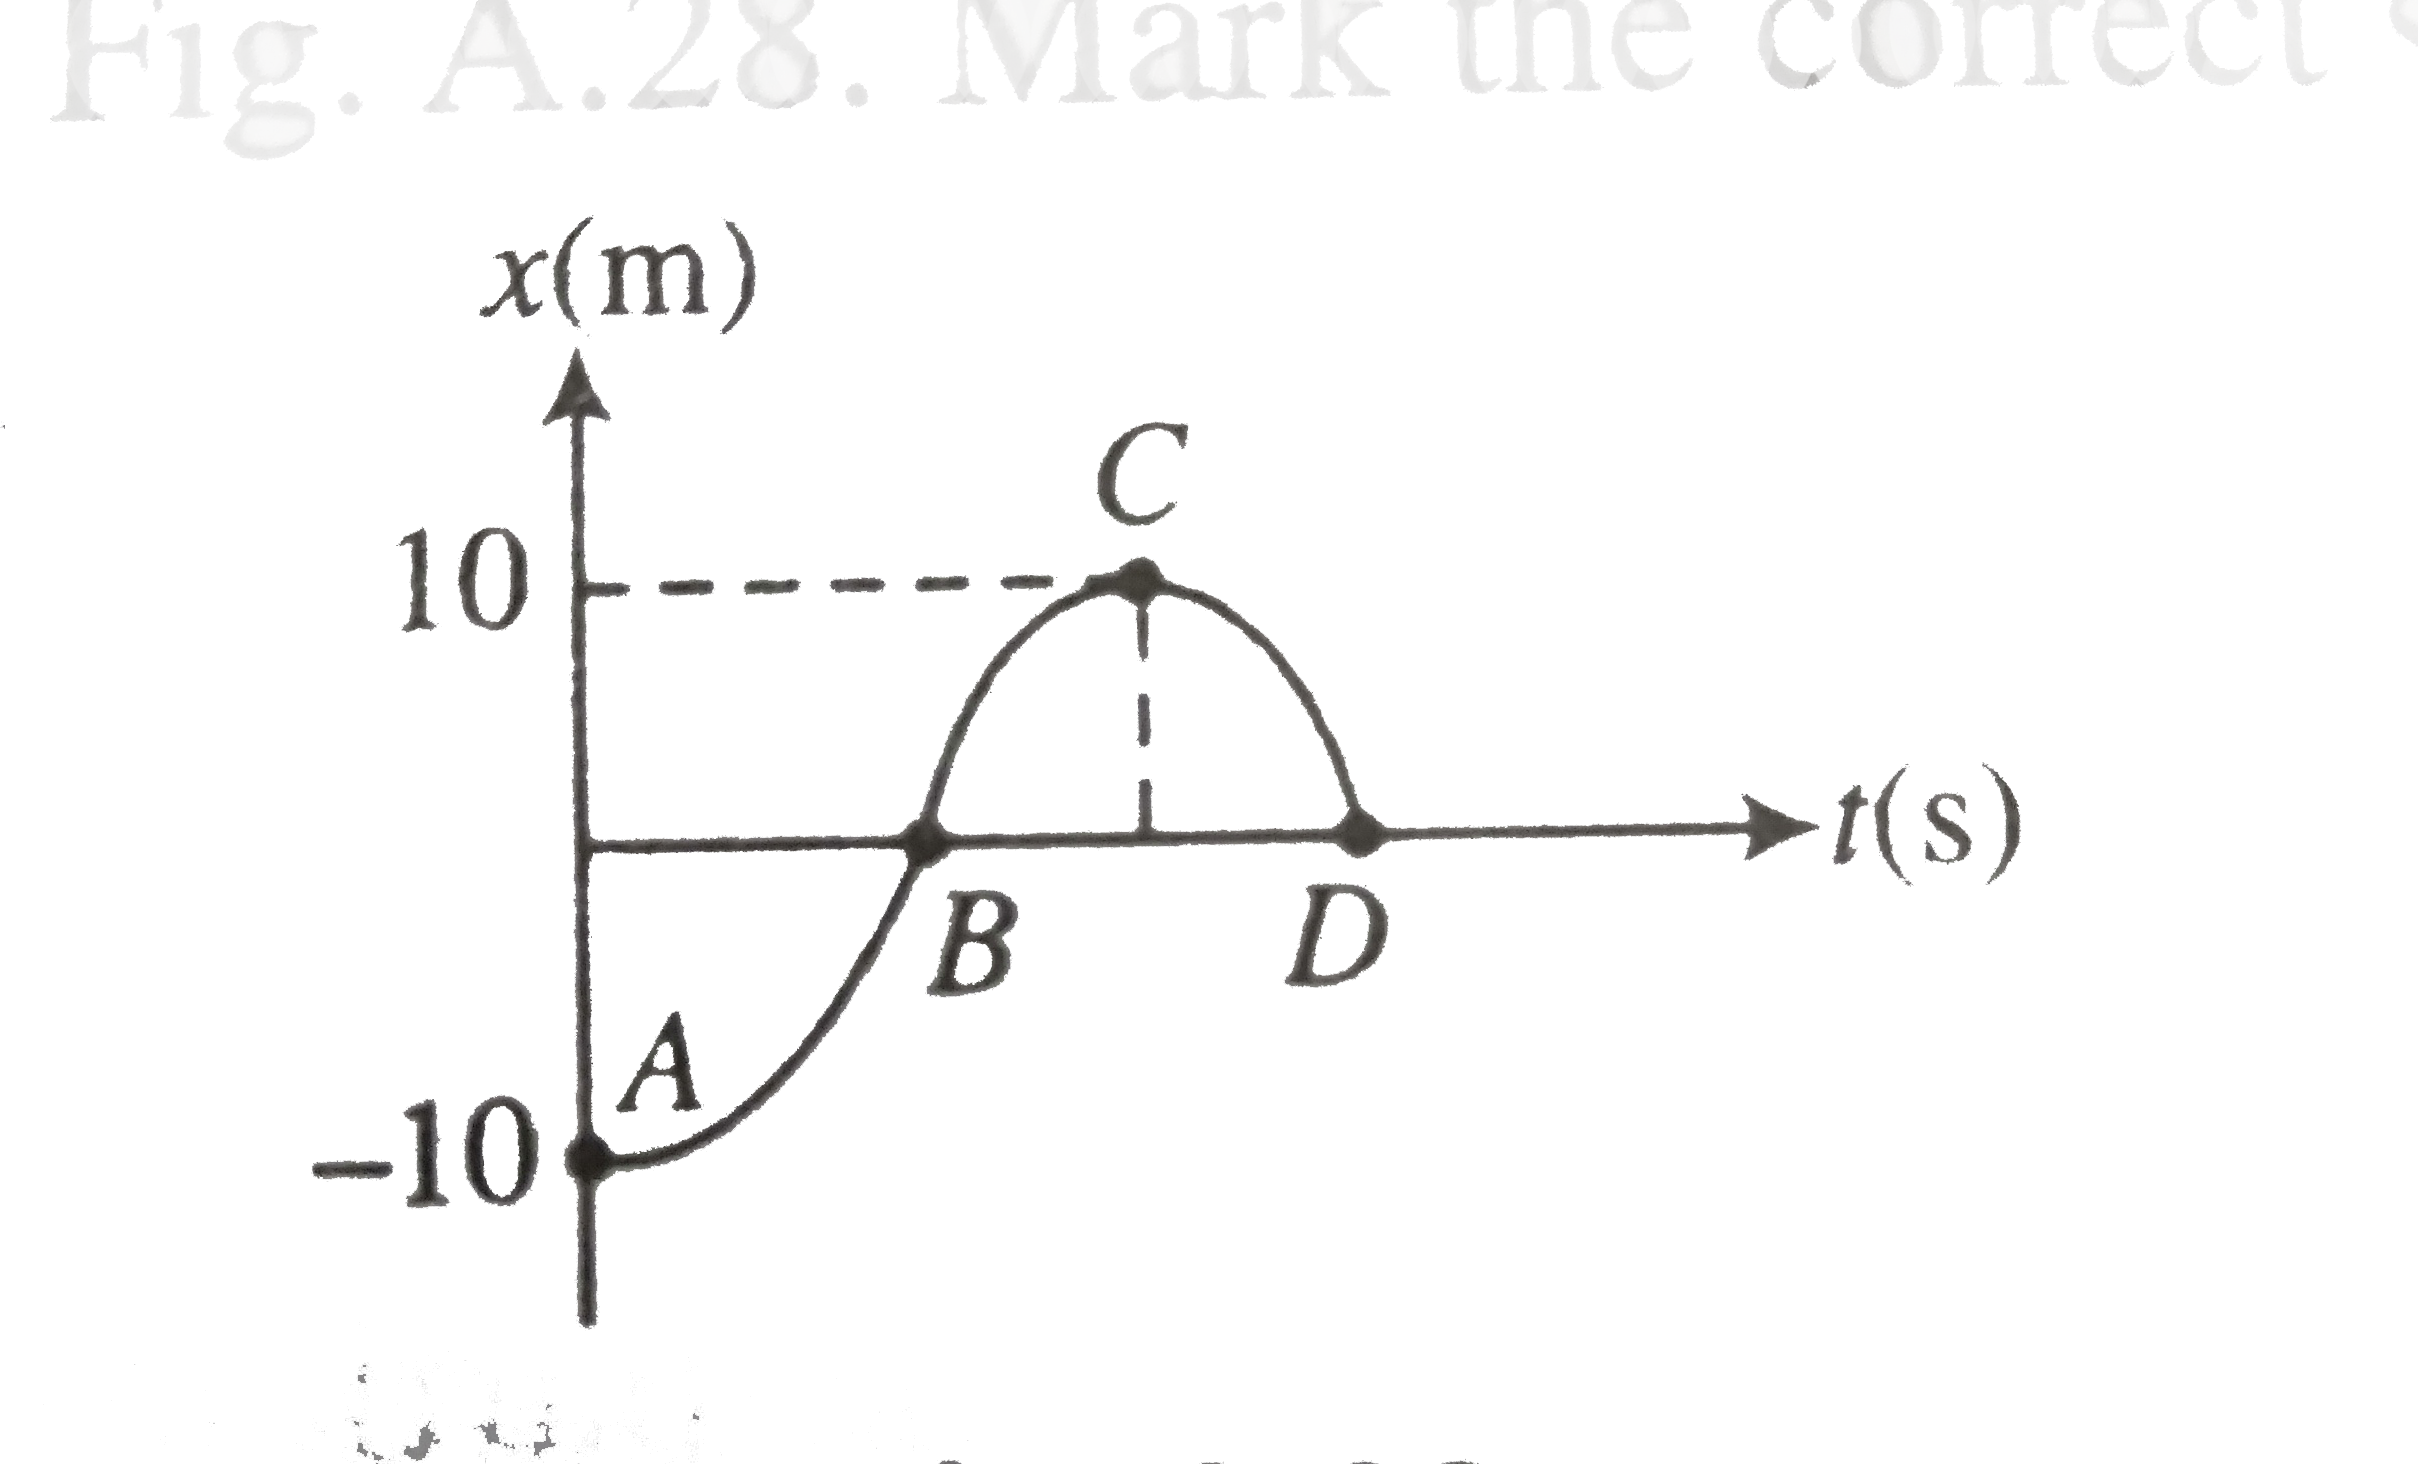
View SolutionFigure shows the displacement-time graph of a particle moving on the X-axis
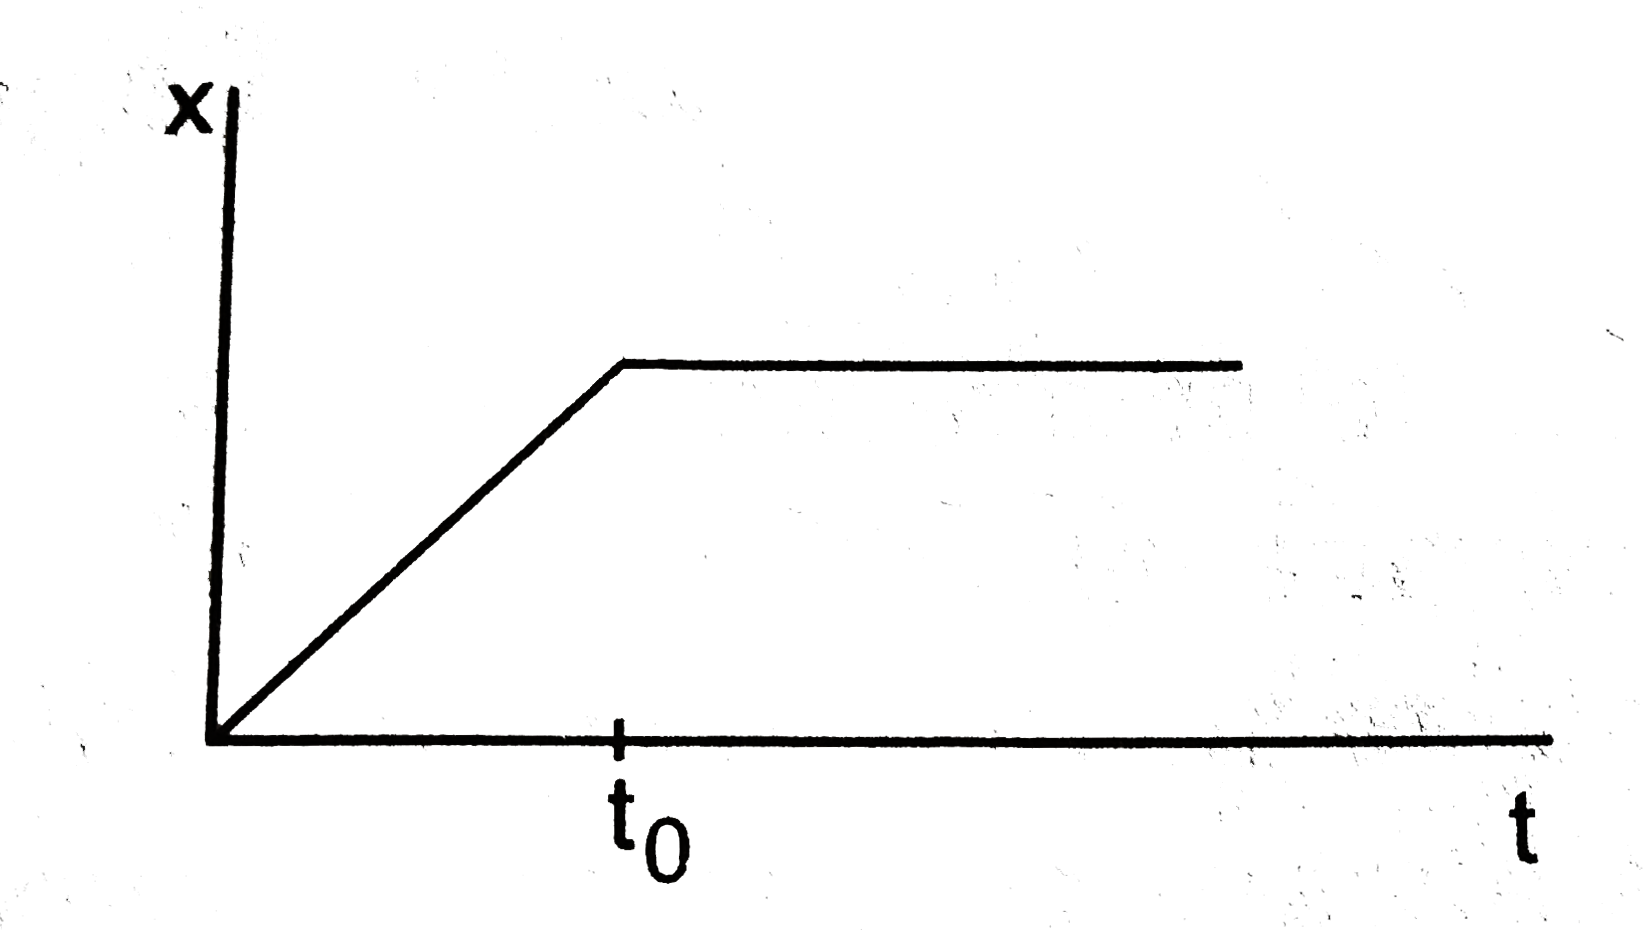
View SolutionIf doubling the concentration of a reactant X in a reaction X+Y→ Products, increases the rate four times and tripling its concentration increases the rate nine times, this indicates that the rate of reaction is proportional to the ………….of the concentration of.............and thus rate is given by........... .
View SolutionIn the graph shown in fig. the time is plotted along x-axis. Which quantity associated with the projectile motion is plotted along the y -axis:-
View Solution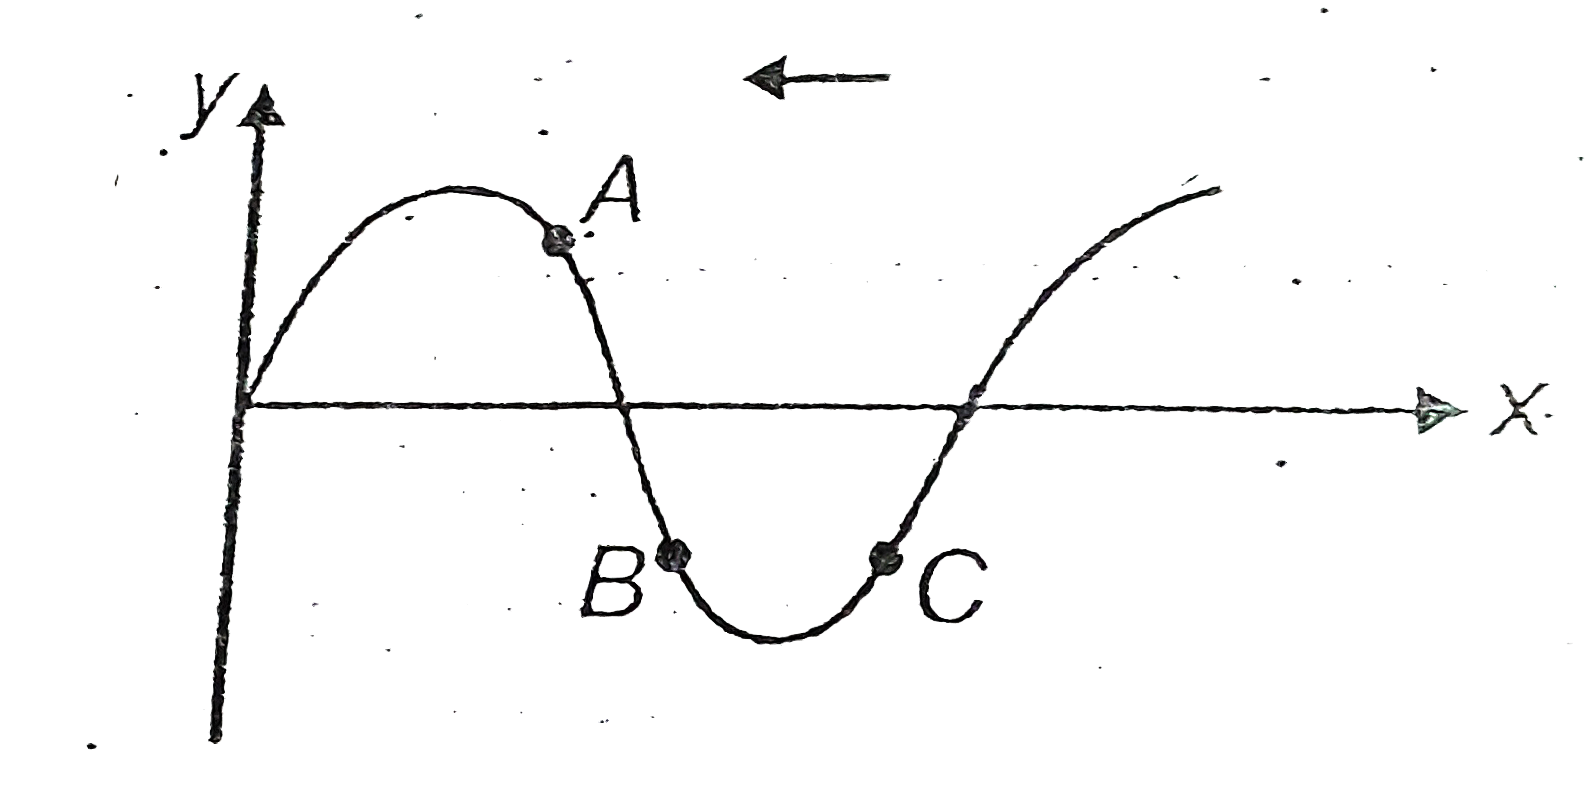
The figure shows a transverse wave travelling in a string in negative x-axis direction. Three points A, B and C are indicated on the string at the instant shown
The correct statement(s) is/are.
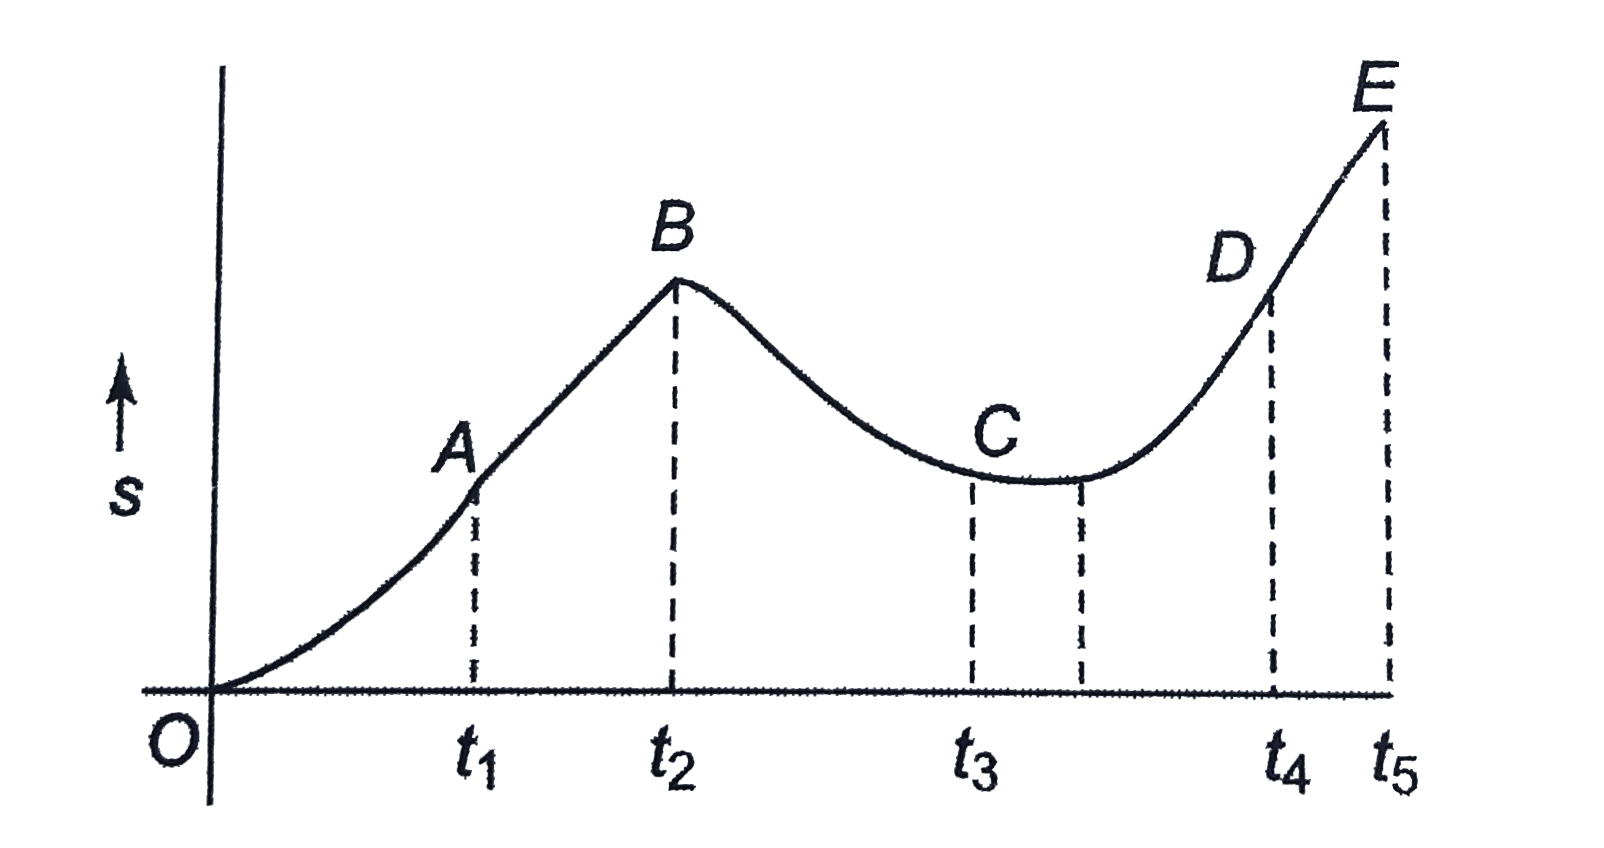
View SolutionA particle is moving along the x-axis and its position-time graph is shown. Determine the sign of acceleration.
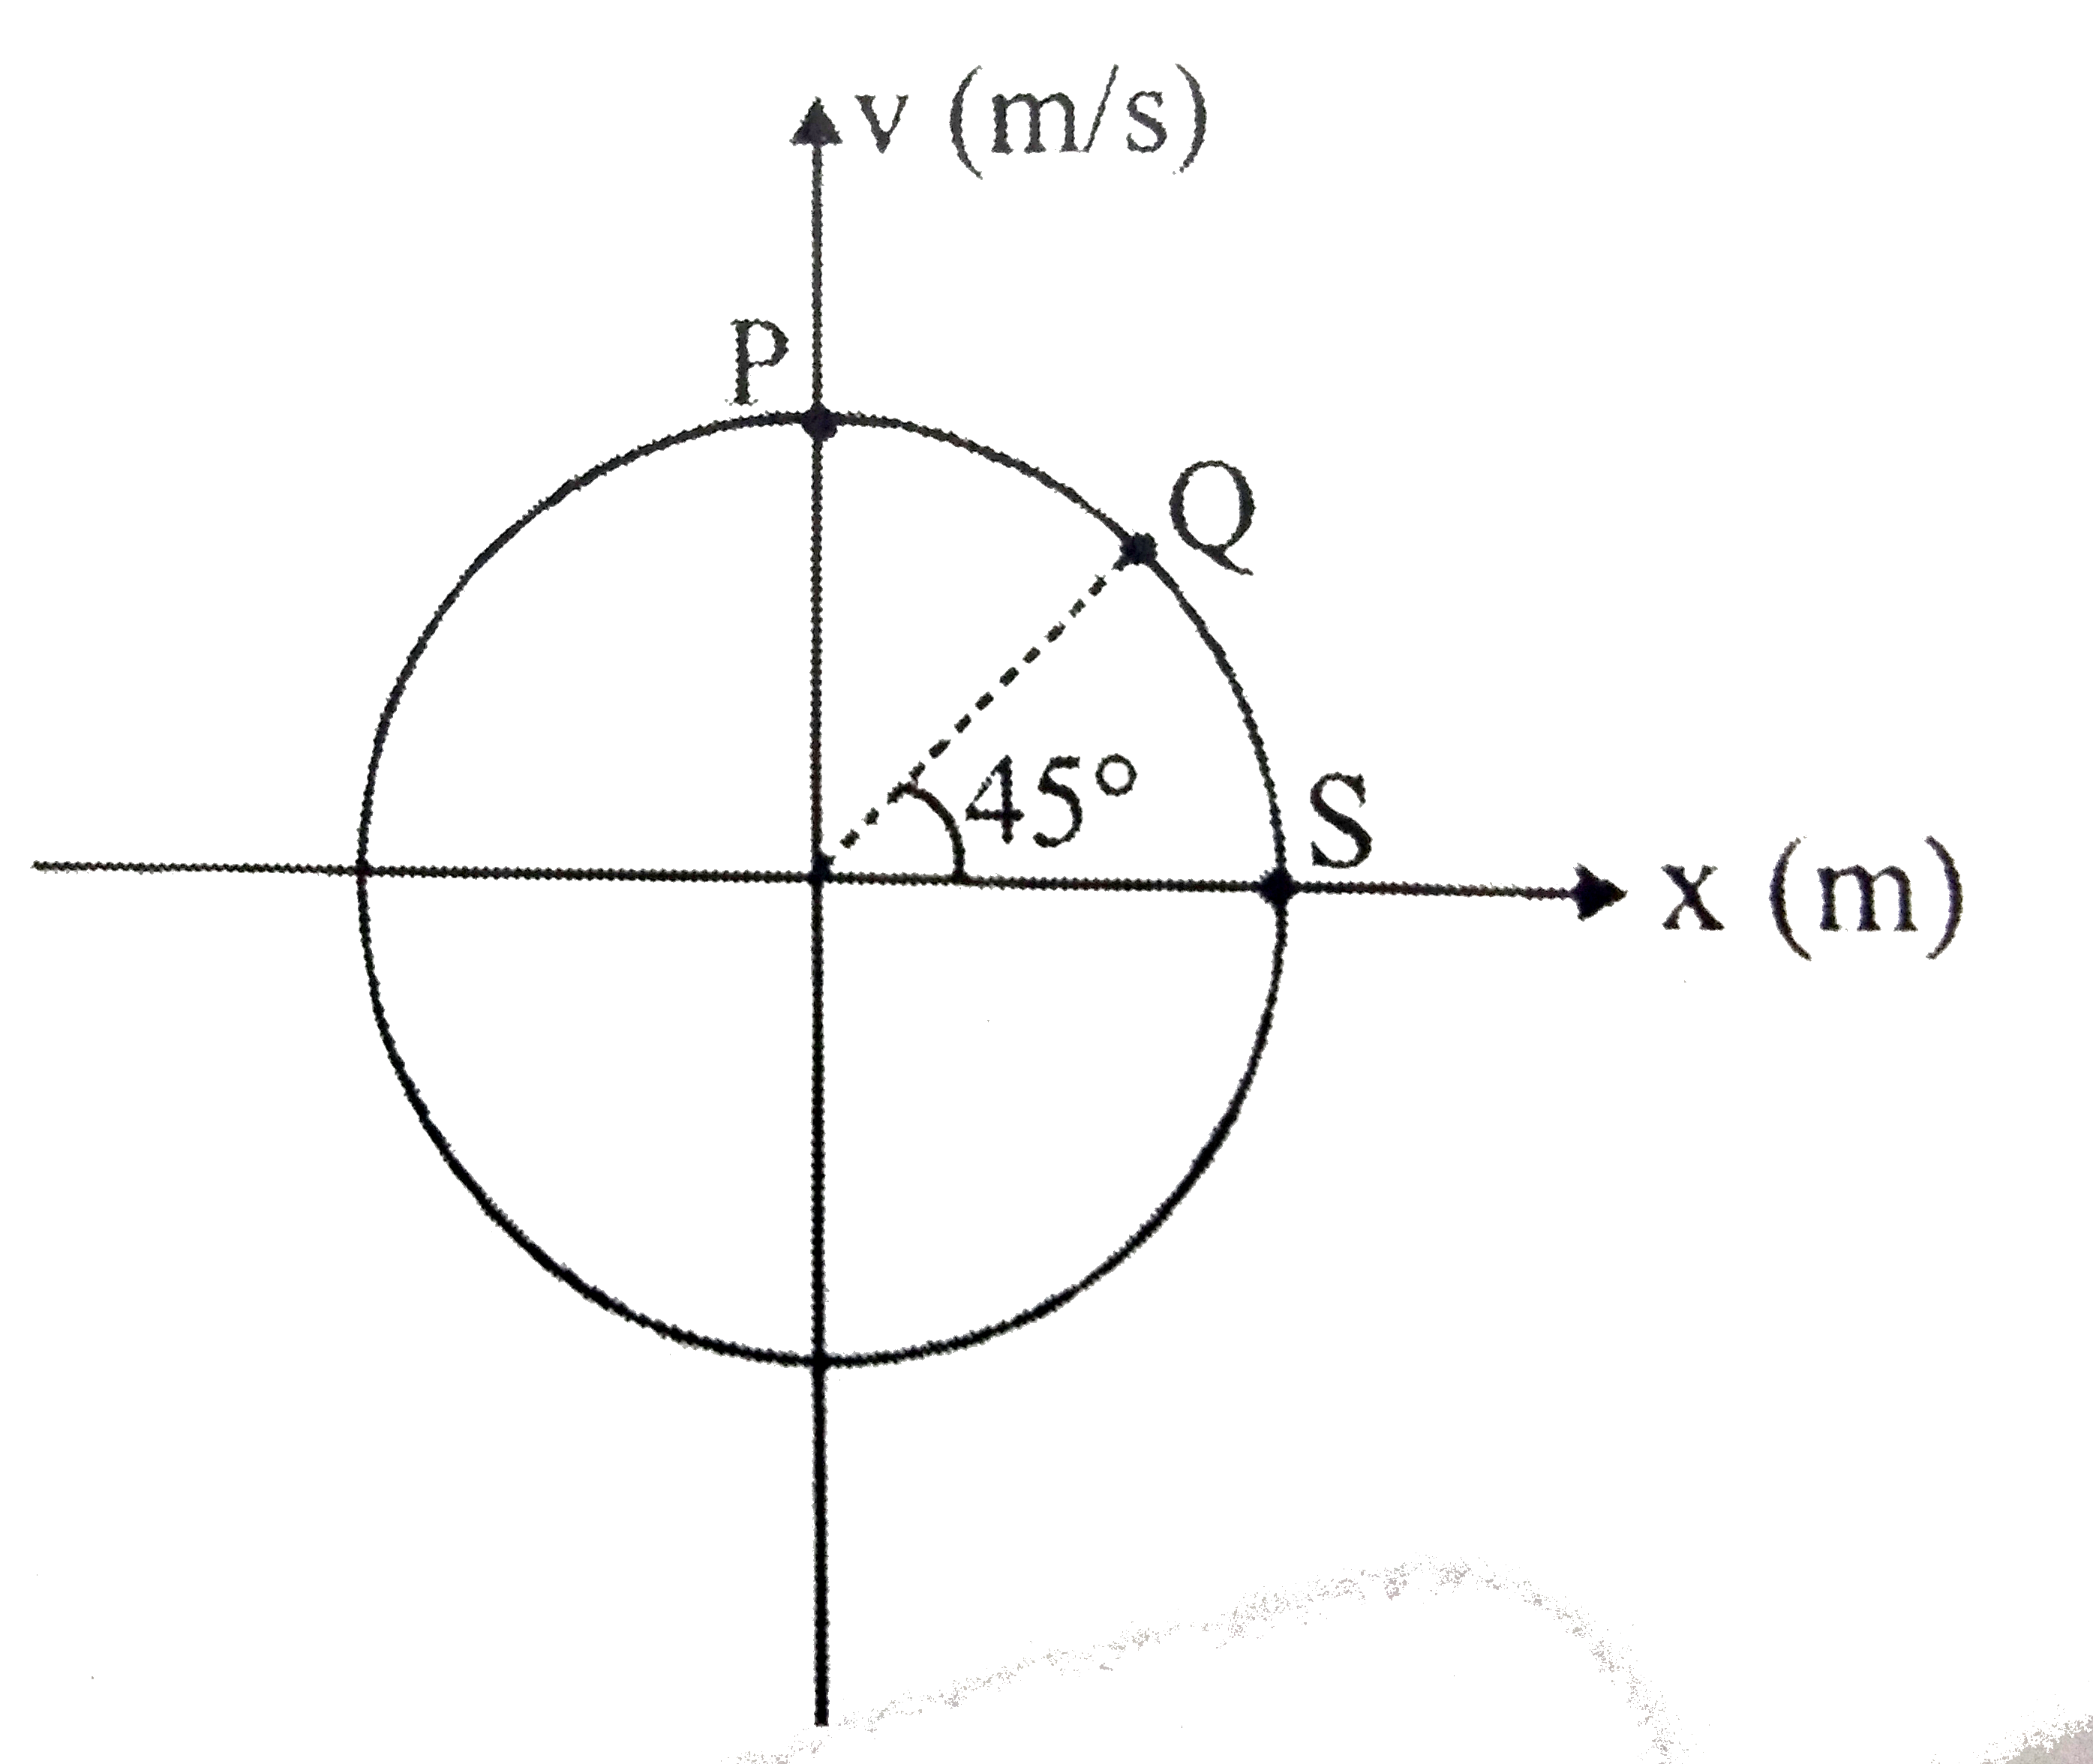
View SolutionA particle is in motion on the x-axis. The variation ofits velocity with position is as shown. The graph is circle and its equation is x2+v2=1, where x is in m and v in m/s. The correct statement(s) is/are:-
View Solution
