If in a population showing sigmoid growth curve the value of K-N/K is 0.95 then what is true for this population.
The carrying capacity has been nearly realized
The carrying capacity has not been substantially realized and it can accmmodate many more organisms
The carrying capacity is only 50% realized
Data is insufficient to comment anything
The correct Answer is:B
To solve the question regarding the population showing a sigmoid growth curve with the value of K−NK=0.95, we can follow these steps:
1. Understanding the Variables:
- In the logistic growth model, K represents the carrying capacity of the environment, which is the maximum population size that the environment can sustain.
- N represents the current population size.
- The expression K−NK indicates how much of the carrying capacity is still available for the population to grow.
2. Substituting the Given Value:
- We are given that K−NK=0.95.
- This means that K−N=0.95K.
3. Rearranging the Equation:
- From the equation K−N=0.95K, we can rearrange it to find N:
N=K−0.95K=0.05K
4. Interpreting the Result:
- The result N=0.05K indicates that the current population size N is only 5% of the carrying capacity K.
- This implies that there is still a significant amount of capacity available for the population to grow.
5. Conclusion:
- Since N is much less than K, the population is currently under the carrying capacity, which means it has the potential to increase significantly.
- Therefore, the population can accommodate more individuals, and it is not yet at its maximum sustainable level.
Final Answer:
The population can accommodate more organisms, as it is currently at only 5% of its carrying capacity.
- In the logistic growth model, K represents the carrying capacity of the environment, which is the maximum population size that the environment can sustain.
- N represents the current population size.
- The expression K−NK indicates how much of the carrying capacity is still available for the population to grow.
- We are given that K−NK=0.95.
- This means that K−N=0.95K.
- From the equation K−N=0.95K, we can rearrange it to find N:
N=K−0.95K=0.05K
- The result N=0.05K indicates that the current population size N is only 5% of the carrying capacity K.
- This implies that there is still a significant amount of capacity available for the population to grow.
- Since N is much less than K, the population is currently under the carrying capacity, which means it has the potential to increase significantly.
- Therefore, the population can accommodate more individuals, and it is not yet at its maximum sustainable level.
The population can accommodate more organisms, as it is currently at only 5% of its carrying capacity.
Topper's Solved these Questions
- NEURAL CONTROL AND COORDINATIONBOOK - TRUEMEN BIOLOGY ENGLISHCHAPTER - NEURAL CONTROL AND COORDINATIONEXERCISE - MCQ
246 Videos
- PLANT GROWTH AND DEVELOPMENT AND PLANT MOVEMENTS BOOK - TRUEMEN BIOLOGY ENGLISHCHAPTER - PLANT GROWTH AND DEVELOPMENT AND PLANT MOVEMENTS EXERCISE - MULTIPLE CHOICE QUESTIONS
158 Videos
Similar Questions
Knowledge Check
In a population per capita birth rate is 0.15 and per capita death rate is 0.08 during a unit time period. What is the value of r (intrinsic rate of natural increases) for the given population ?
A0.23B0.07C0.05D0.25What is true about the isolated small tribal population.?
AThere is a decline in population as boys marry girls only from their own tribeBHereditary diseases like colour blindness do not spread in the isolated populationCWrestlers who develop slrong body muscle in their life time pass this character on to their progeny.DThere is no change in population size as they have a large gene poolStudy the population growth curves (A and B) in the given graph and select the incorrect option.
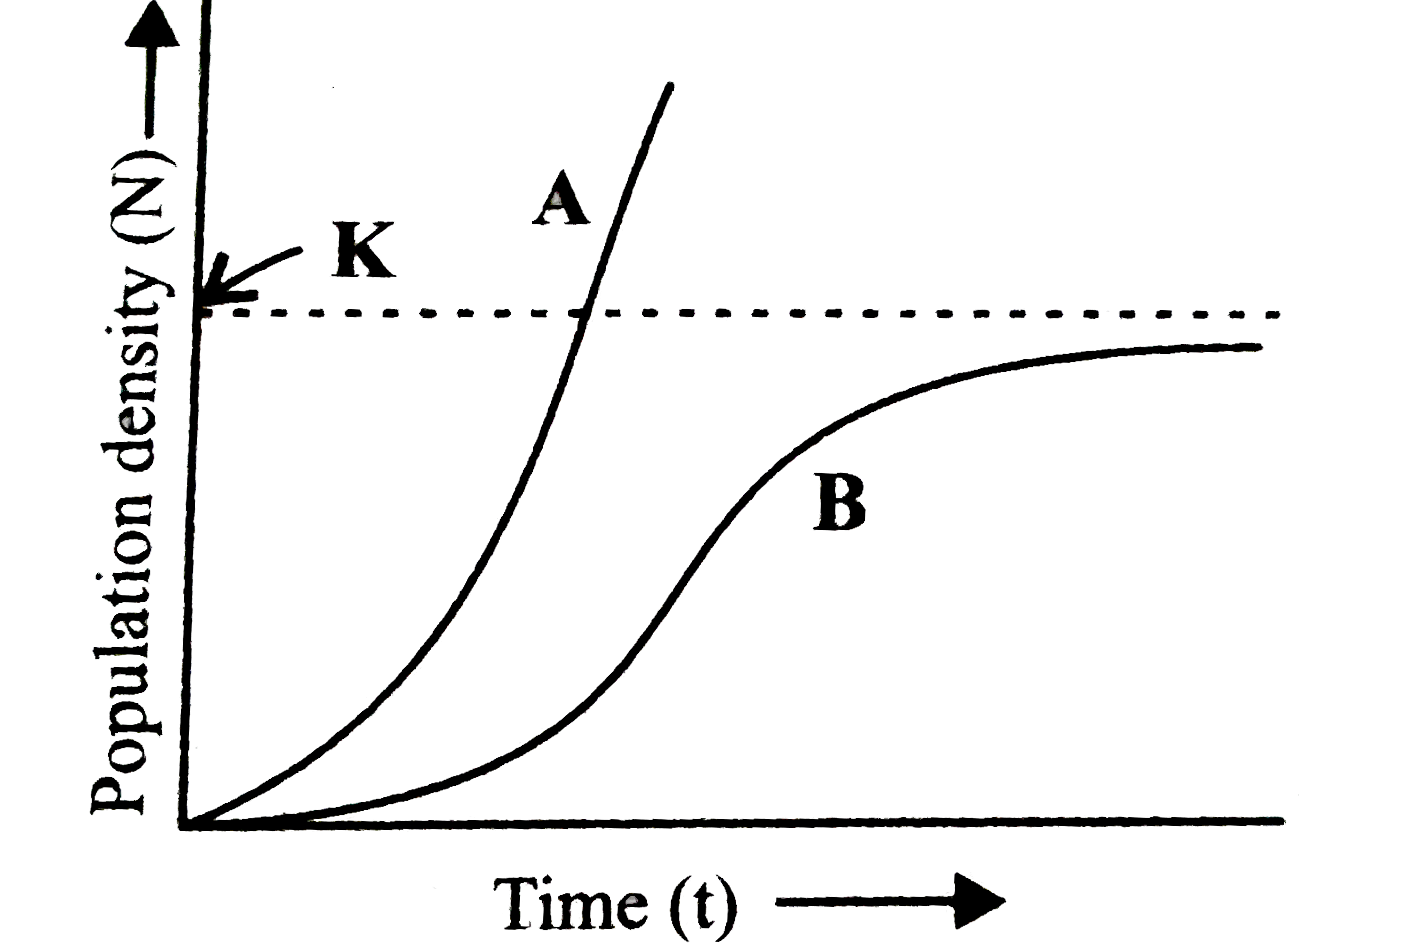
 ACurve 'A' shows exponential growth, represented by equation dNdt=rN.BCurve 'B' shows logistic growth, represented by equation dNdt=rN(K−NK)CExponential growth curve is considered as more realistic than the logistic growth curve.DCurve 'A' can also be represented by equation Nt=N0ert.
The growth of human population shows
View SolutionWhat is true about the isolated small tribal populations ?
View SolutionPopulation growth curve in most animals , except humans, is
View SolutionThe graph in case of a population showing maximum intrinsic growth will be
View Solution(a) Name the two growth models that represent population growth and draw the respective growth curves they represent.
(b) State the basis for the difference in the shape of these curves.
(c) Which one of the curves represent the human population growth at present? Do you think such a curve is sustainable ? Give reason in support of your answer.
View Solution
