When does the growth rate of a population following the logistic model equal zero ? The logistic model is given as dN/dt = rN(1-N/K):
when death rate is greater than birth rate.
when N/K is exactly one
when N nears the carrying capacity of the habitat
when N/K equals zero
To solve the question of when the growth rate of a population following the logistic model equals zero, we can follow these steps:
1. Understand the Logistic Growth Model:
The logistic growth model is represented by the equation:
dNdt=rN(1−NK)
where:
- dNdt is the rate of change of the population over time.
- r is the intrinsic rate of natural increase.
- N is the current population density.
- K is the carrying capacity of the environment.
2. Set the Growth Rate to Zero:
To find when the growth rate equals zero, we set:
dNdt=0
3. Solve the Equation:
From the logistic growth equation, we have:
0=rN(1−NK)
This equation can be satisfied in two scenarios:
- rN=0 (which occurs when N=0, meaning no population)
- 1−NK=0
4. Determine the Condition for Zero Growth:
Solving 1−NK=0:
1=NK
This implies:
N=K
Thus, the growth rate equals zero when the population density N reaches the carrying capacity K.
5. Conclusion:
Therefore, the growth rate of the population following the logistic model equals zero when:
N=K
The logistic growth model is represented by the equation:
dNdt=rN(1−NK)
where:
- dNdt is the rate of change of the population over time.
- r is the intrinsic rate of natural increase.
- N is the current population density.
- K is the carrying capacity of the environment.
To find when the growth rate equals zero, we set:
dNdt=0
From the logistic growth equation, we have:
0=rN(1−NK)
This equation can be satisfied in two scenarios:
- rN=0 (which occurs when N=0, meaning no population)
- 1−NK=0
Solving 1−NK=0:
1=NK
This implies:
N=K
Thus, the growth rate equals zero when the population density N reaches the carrying capacity K.
Therefore, the growth rate of the population following the logistic model equals zero when:
N=K
Topper's Solved these Questions
Similar Questions
What is 'r' in the population equation given : dN/dt = rN
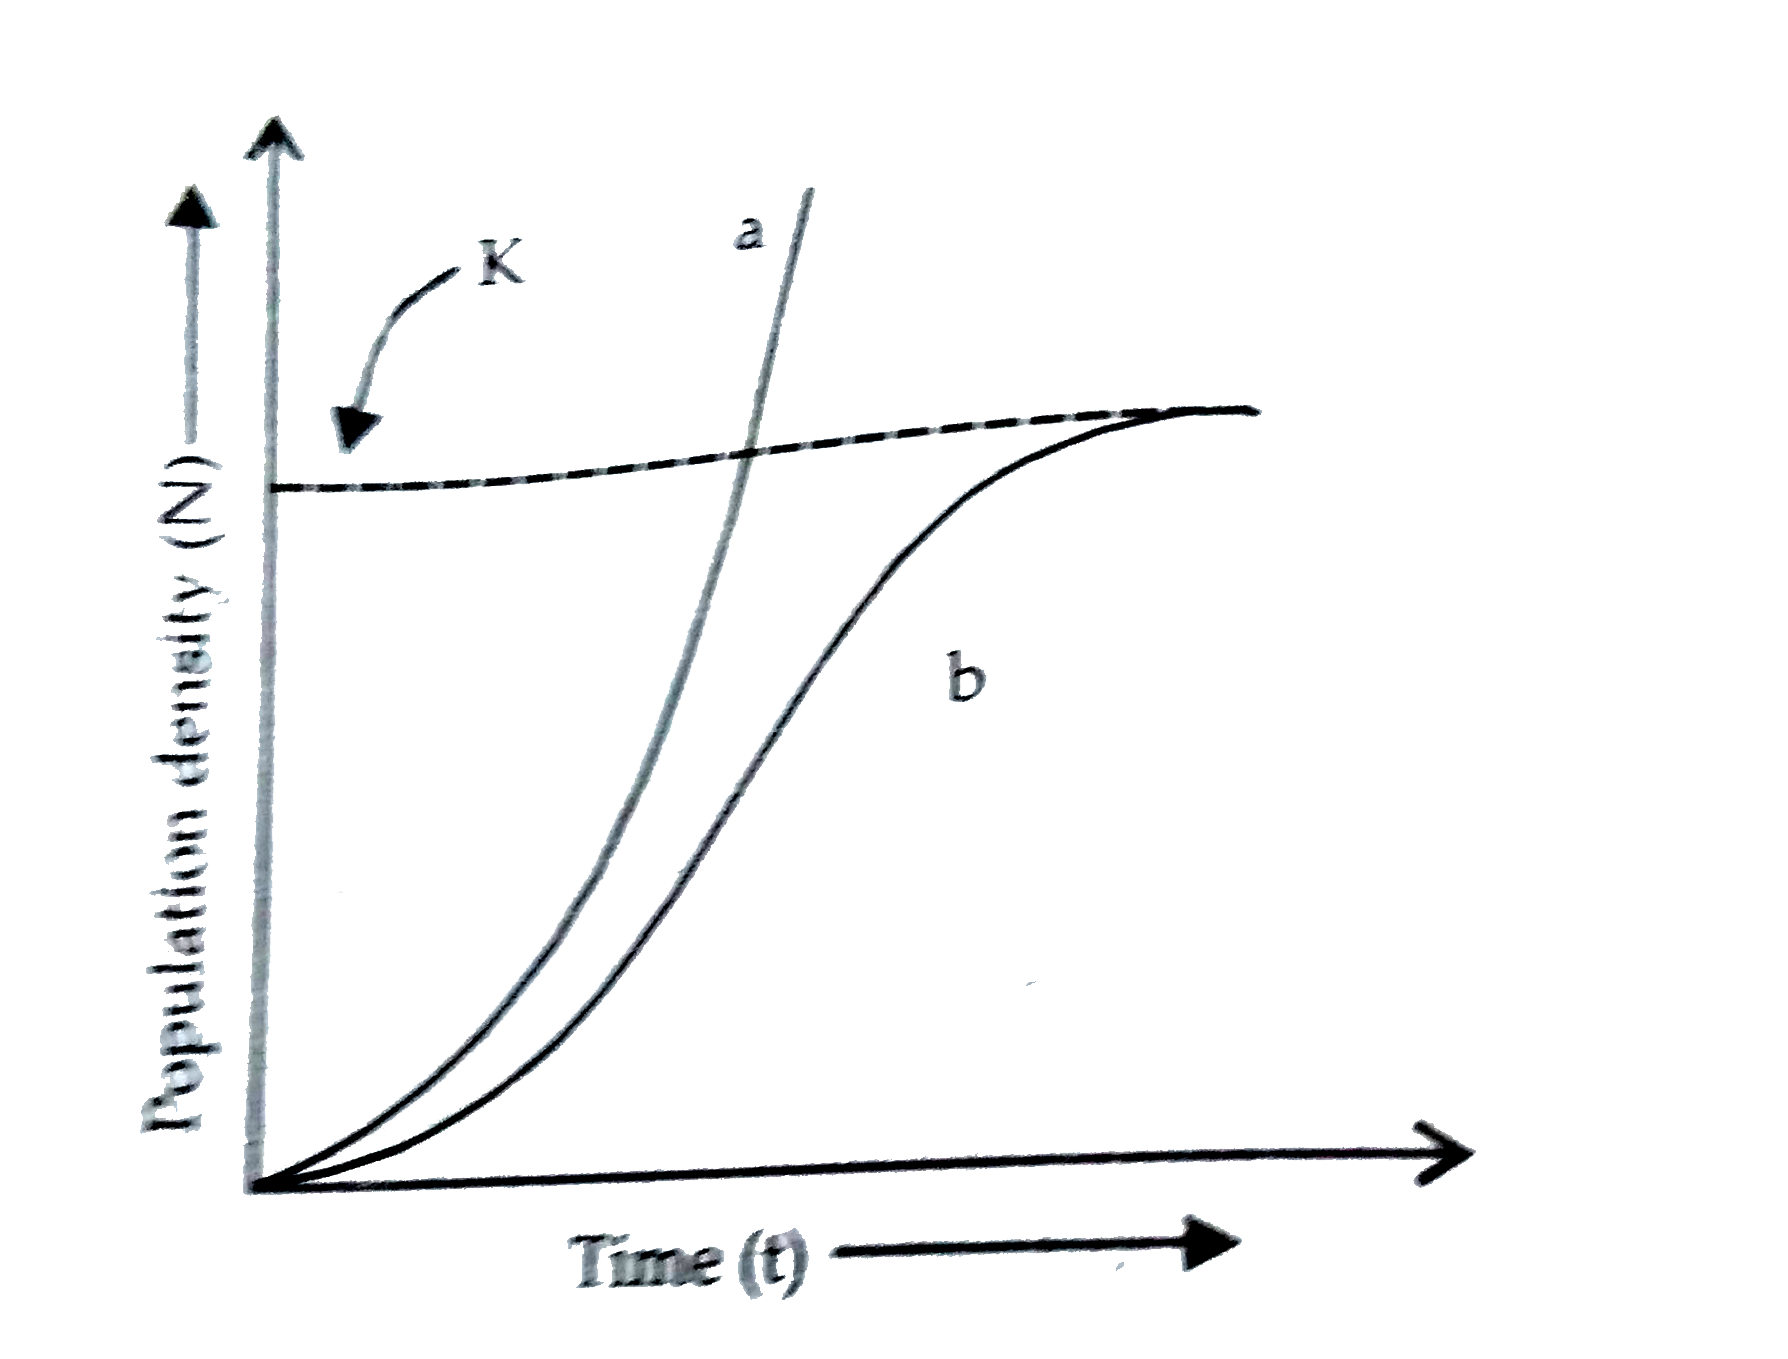
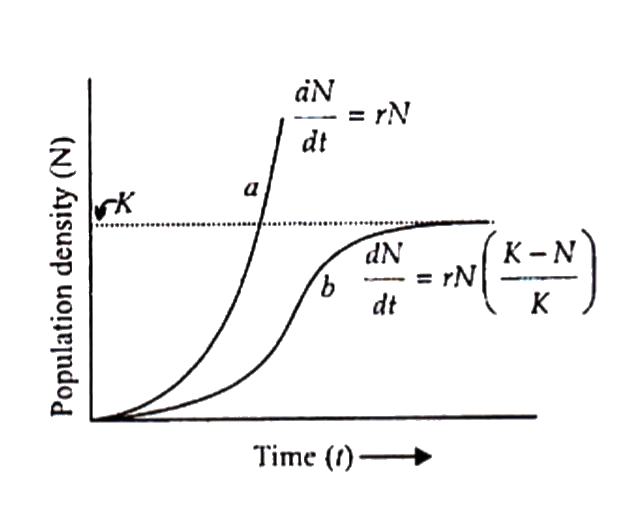
View SolutionStudy the population growth curves in the graph given below and answer the questions which follow :
(i) Identify the growth curves ‘a’ and ‘b’.

(ii) Which one. of them is considered a more realistic one and why ?
If dN9dt)=rN(K−NK) is the equation of the logistic growth curve, what does K stand for ?
(iv) What is symbolised by N ?
View Solution
Knowledge Check
Keith modeled the growth over several hundred years of a tree population by estimating the number of the trees’ pollen grains per square centimeter that were deposited each year within layers of a lake’s sediment. He estimated there were 310 pollen grains per square centimeter the first year the grains were deposited, with a 1% annual increase in the number of grains per square centimeter thereafter. Which of the following functions models P(t), the number of pollen grains per square centimeter t years after the first year the grains were deposited?
AP(t)=310tBP(t)=3101.01tCP(t)=310(0.99)tDP(t)=310(1.01)t
What does 'K' represent in the equation given below?
dNdt=rN(K−NK)
View Solutionwhich of the following option is true for verhulst Pearl logistic growth?
(A)population growth is decreased by the equation dNdt=rN[KK−N].
(B) r' represents biotic potential.
(C) applicable to a population growing in habitat with limited resources.
(D)K represents carrying capacity
View SolutionThe rate of growth of a population is proportional to the number present. if the population of a city doubled in the past 25 years, and the present population is 100000, when will the city have a population of 500000? [Given, loge5=1.609 , loge2=0.6931 . ]
View SolutionIf birth and death rates were equal, a zero population growth rate would result. It is known as
View SolutionFor a reaction scheme Ak1−−→Bk2−−→D , If the rate of formation if B is set to be Zero then the concentration of B is given by :
View SolutionThe graph shows two types of the population growth curve, 'a' - Exponential and 'b' - Logistic. Which of the following graph models is considered to be the more realistic one?

View SolutionWhich of the following curve represents Verhulst Pearl Logistic growth in a populations ?
View Solution
