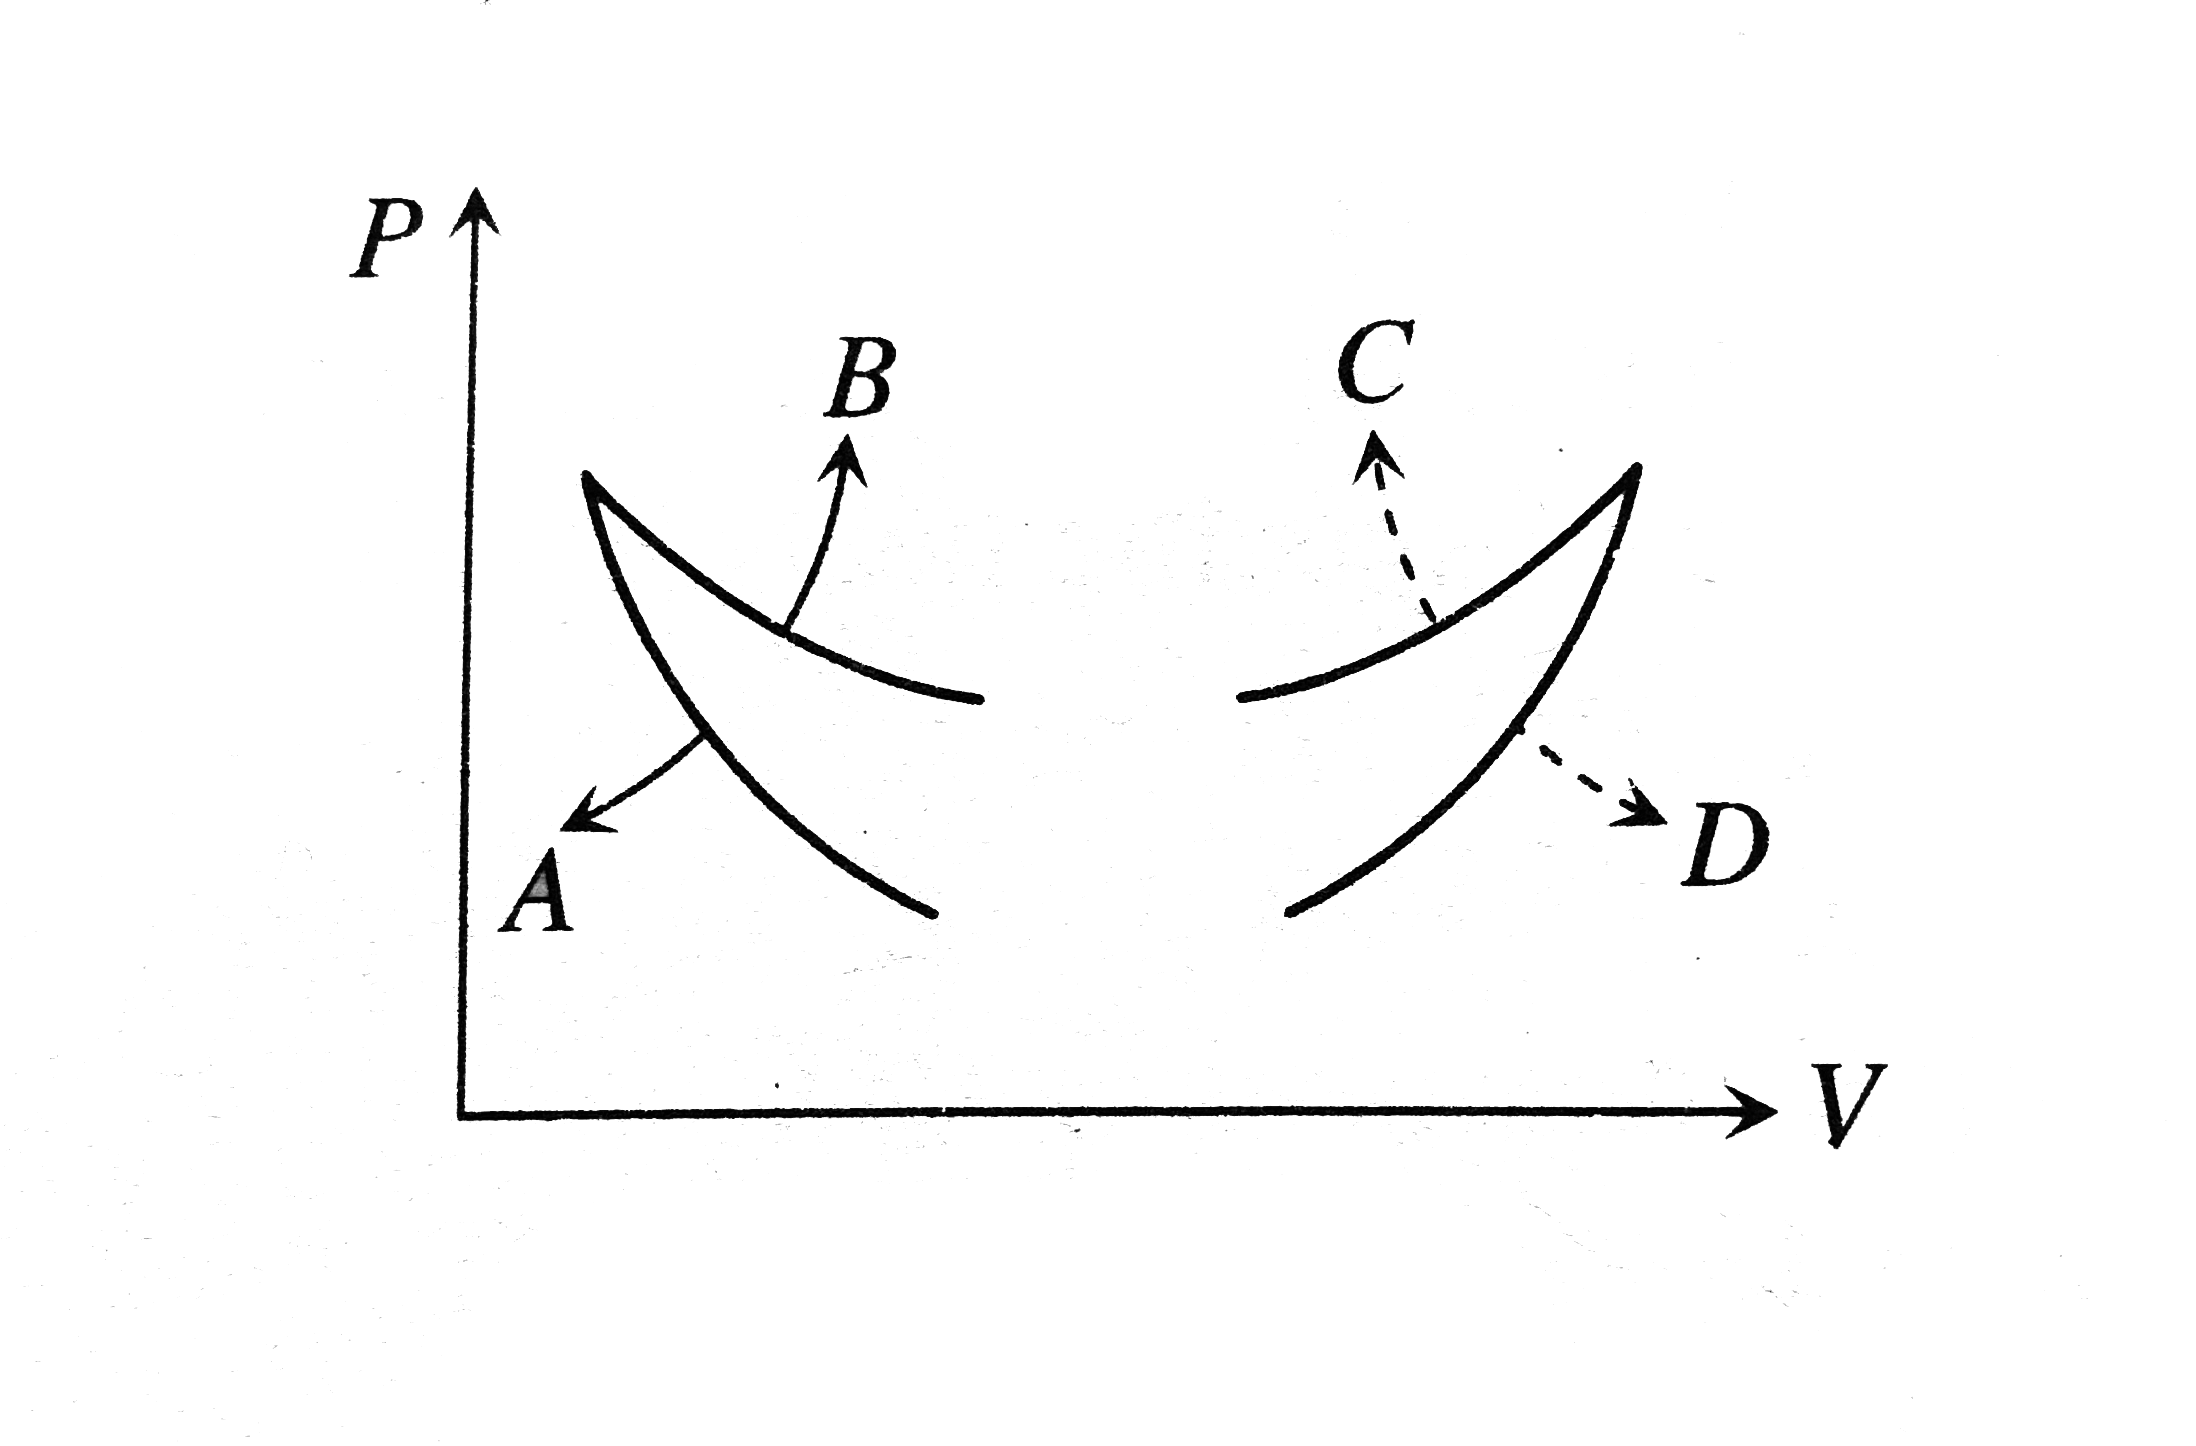
Four curves A, B, Cand Dare drawn in the figure for a given amount of gas. The curves which represent adiabatic and isothermal changes are
 Solution in Marathi
C and D respectively
D and C respectively
A and B respectively
B and A respectively
The correct Answer is:dia
Step by step video & image solution for Four curves A, B, Cand Dare drawn in the figure for a given amount of gas. The curves which represent adiabatic and isothermal changes are by Physics experts to help you in doubts & scoring excellent marks in Class 12 exams.
Updated on:21/07/2023Topper's Solved these Questions
Similar Questions
A gas initially at 17∘C issuddenly compressed to 1/8 of its original volume. Find the temperature after compression ? [gamma=53]
View SolutionDistinguish between progressive waves and stationary waves .
View SolutionIf the refractive indices of glass and water with respect to air is 32 and 43 respectively. Calculate the velocity of light in glass and water.From these results calculate the refractive index of glass with respect to water. Given velocity of light in air is 3×10⁸m/s.
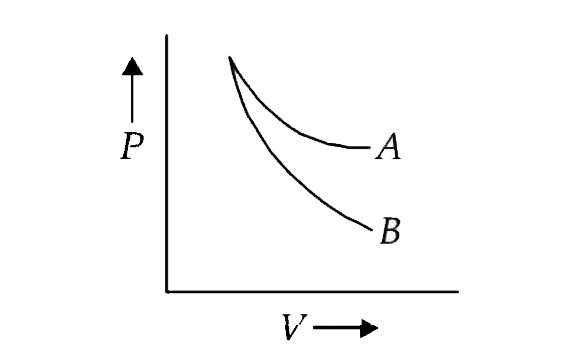
View SolutionThe curves A and B in the figure shown P-V graphs for an isothermal and an adiabatic process for an idea gas. The isothermal process is represented by the curve A.
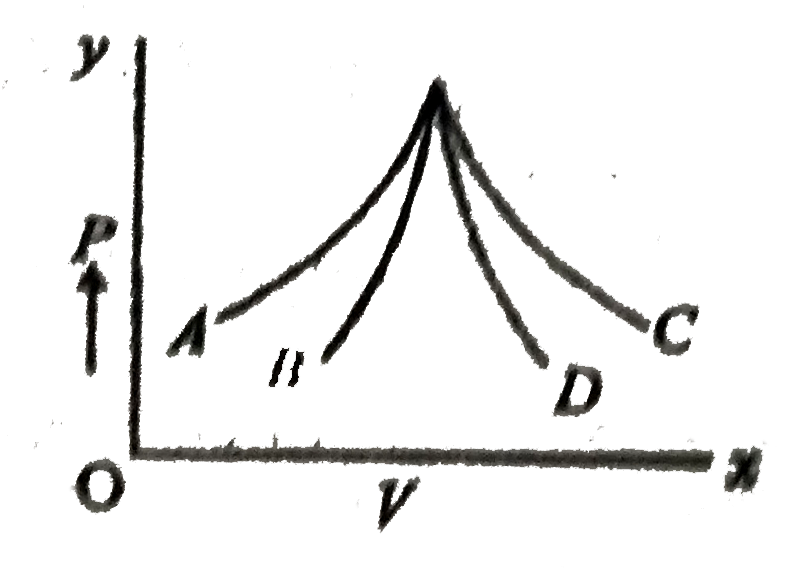
View SolutionFour curves A,B,C and D are drawn in figure for a given amount of gas. The curve which represents adiabatic and isothermal changes, respectively, is
View SolutionFour curves A,B,C and D are drawn in Fig. for a given amount of gas. The curves which represent adabatic and isothermal changes

View SolutionFigure shows four PV diagrams. Which of these curves represent isothermal and adiabatic processes?

View SolutionWhich curve in figure represents the curve of ideal gas ?
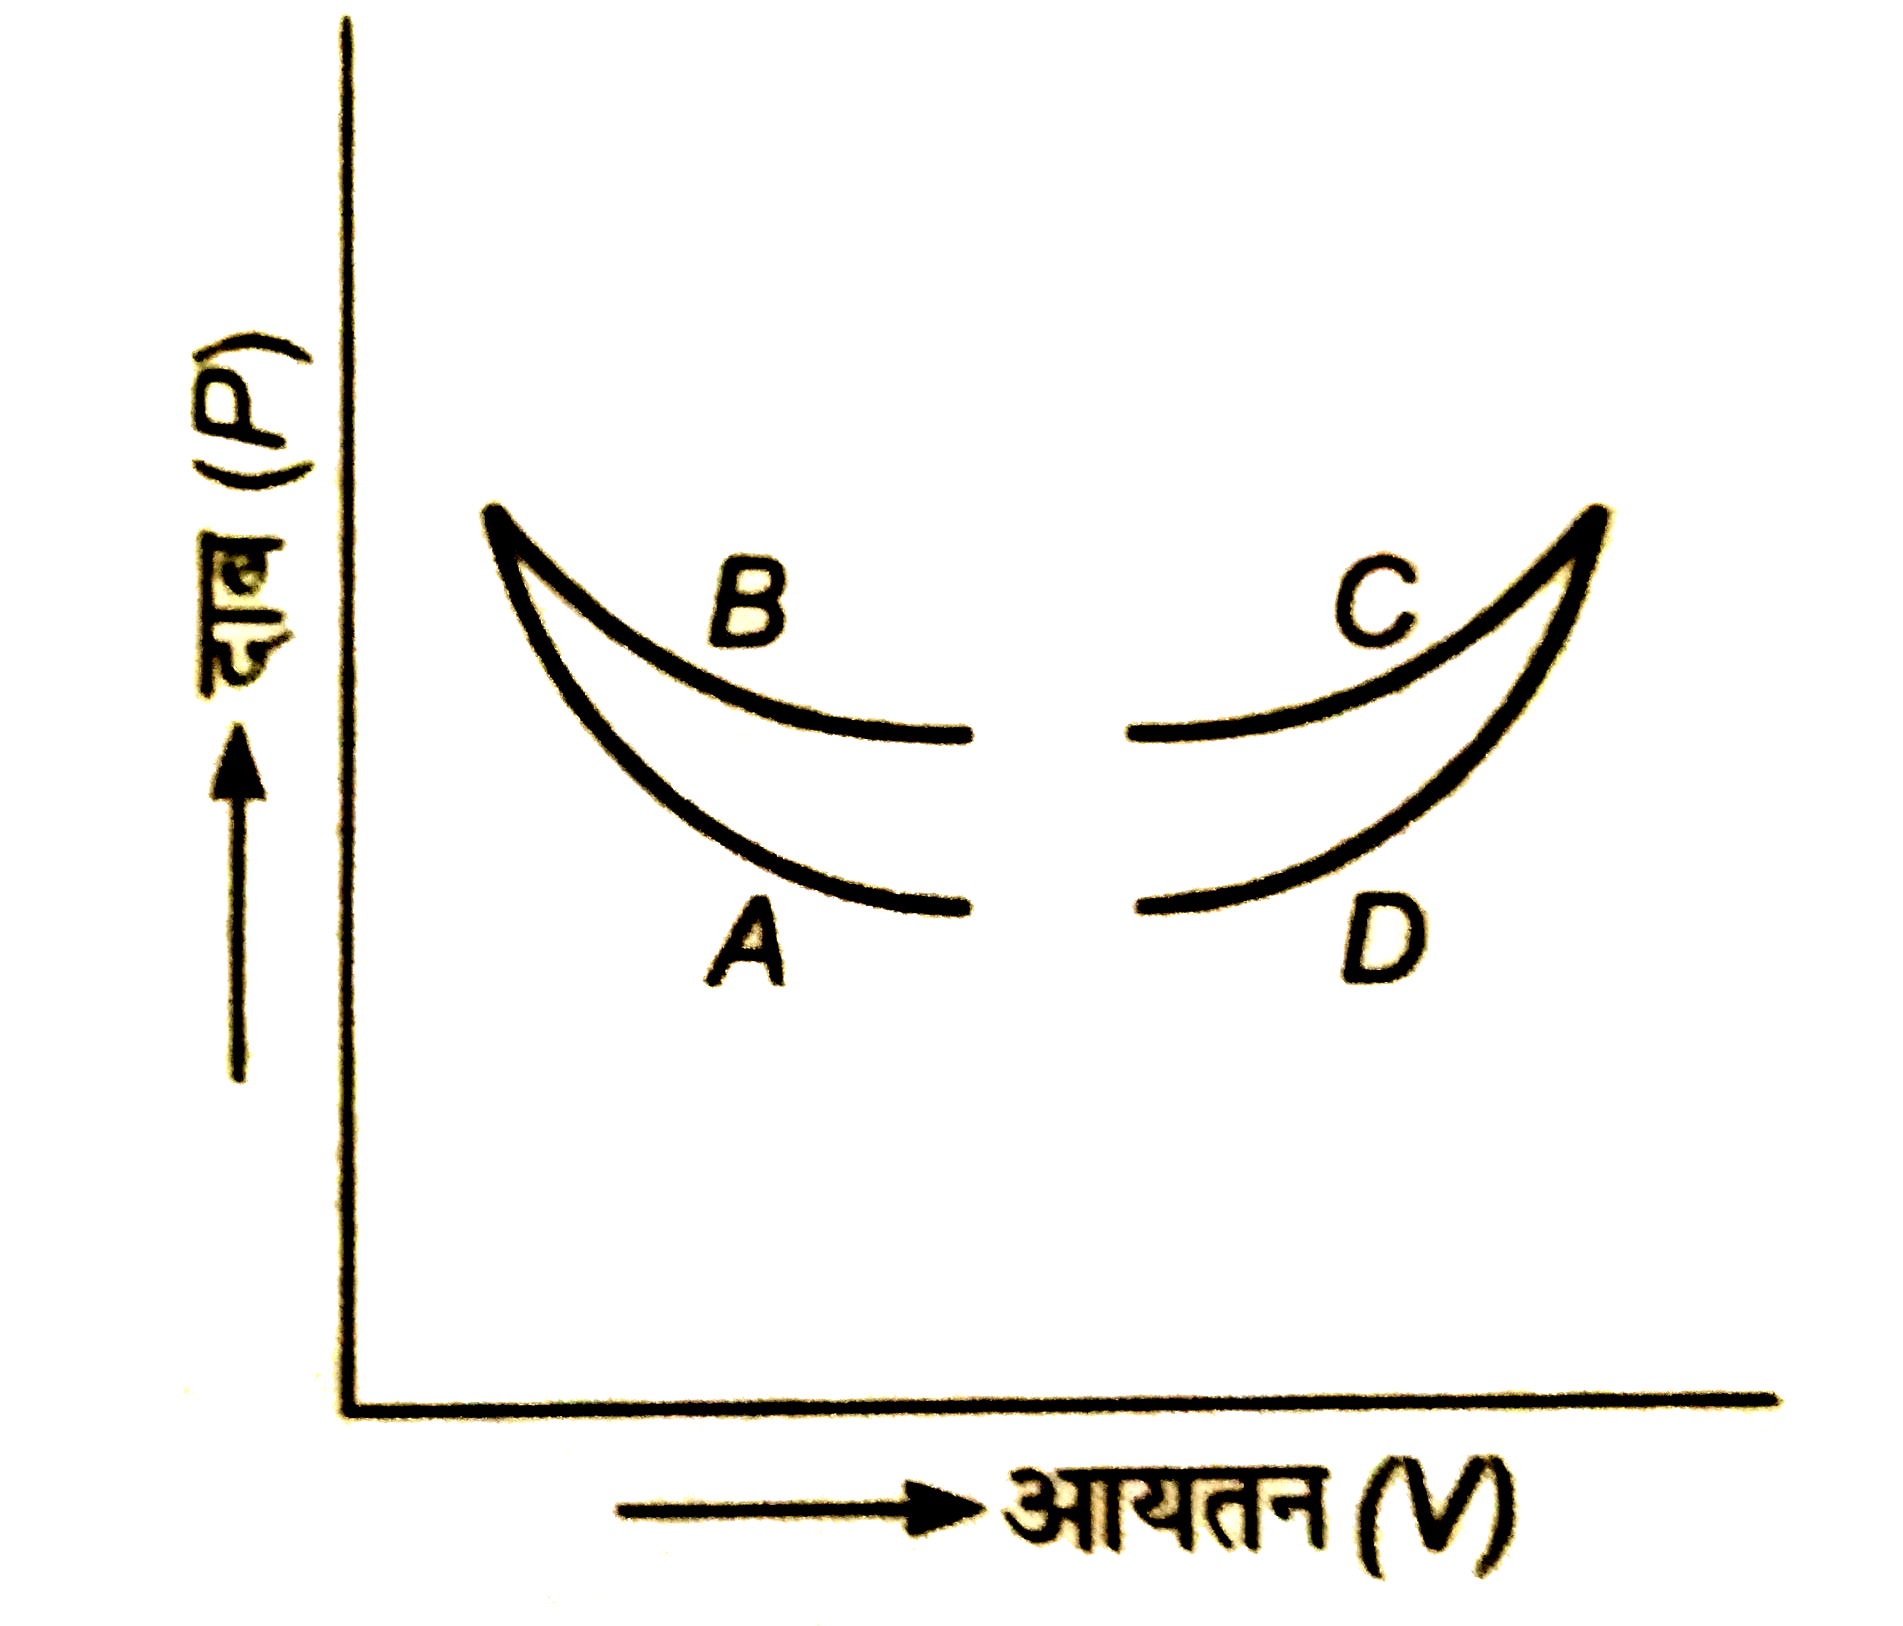
View Solutionसंलग्न चित्र 22.8 में गैस की किसी दी हुई मात्रा के लिए चार वक्र A, B, C तथा D खींचे गये हैं वक्र जो रुद्धोष्म व समतापी प्रक्रमों को निरूपित करते हैं।

View Solutionab and bc curves in the figure represent an isothermal and an adiabatic process respectively. Show that at the point b the ratio of the slopes of isothermal and adiabatic curves is equal to C_P/C_V .
View SolutionWhich curve in figure represents the curve of ideal gas ?
View SolutionFour curves A,B,C and D are drawn in Fig. for a given amount of gas. The curves which represent adabatic and isothermal changes

View SolutionThe curves A and B in the figure shown P-V graphs for an isothermal and an adiabatic process for an idea gas. The isothermal process is represented by the curve A.

View SolutionFigure shows four PV diagrams. Which of these curves represent isothermal and adiabatic processes?

View SolutionFour curves A, B, C and D are drawn in Fig. for a given amount of gas. The curves which represent adiabatic and isothermal changes
View Solution