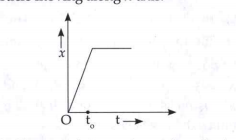
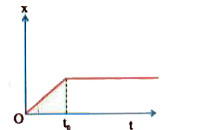
Figures shows the displacement-time graph of a particle moving along x-axis.
 Solution in Marathi
The particle is continously going in positive x-direction
The particle is at rest
The velocity increases upto time t0 and then becomes constant.
The particle moves at a constant velocity upto a time t0 and then stops
Step by step video & image solution for Figures shows the displacement-time graph of a particle moving along x-axis. by Physics experts to help you in doubts & scoring excellent marks in Class 11 exams.
Updated on:21/07/2023Topper's Solved these Questions
Similar Questions
What is a deforming force?
View SolutionWhat is light?
View SolutionFigure shows the displacement time graph of a particle moving on the X-axis

View SolutionFigures (i) and (ii) below show the displacement-time graphs of two particles moving along the x -axis. We can say that
View SolutionThe velocity-time graph for a particle moving along X-axis is shown in the figure. The corresponding displacement-time graph is correctly shown by
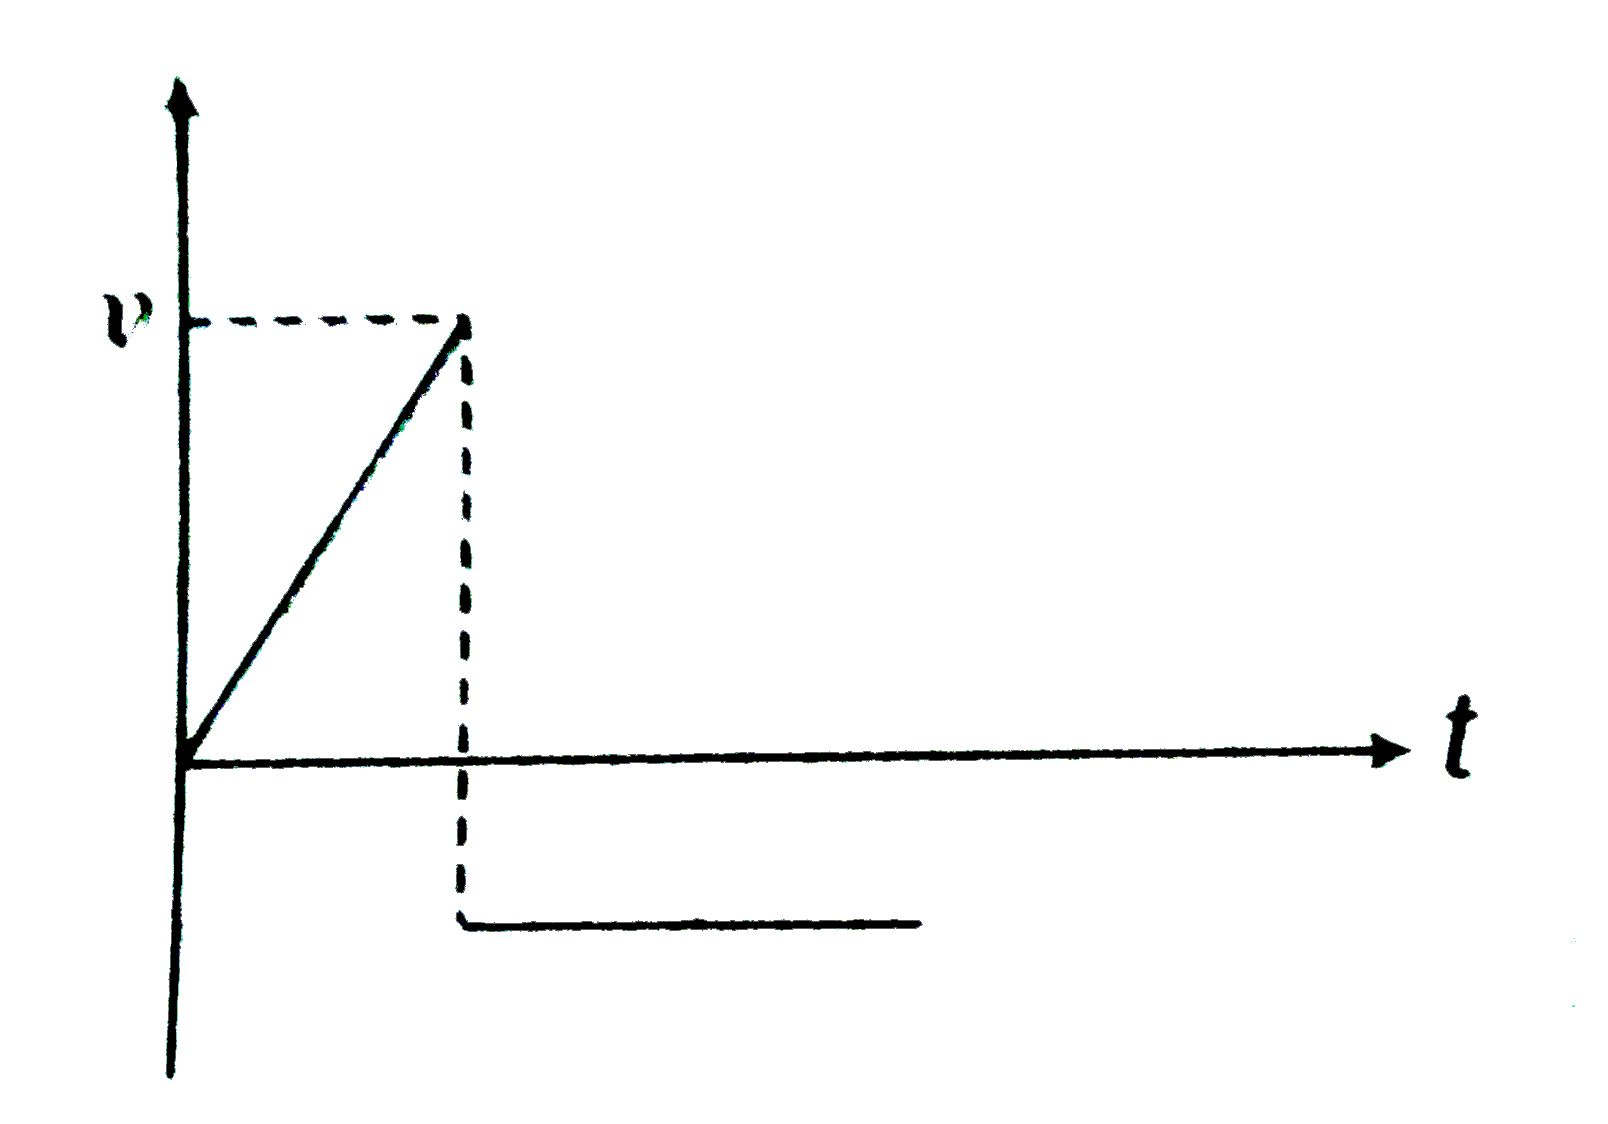
View SolutionFor a particle moving along x-axis, velocity-time graph is as shown in figure. Find the displacement of the particle?
View SolutionThe velocity time graph for a particle moving along x-axis is shown in the figure. The corresponding displacement time graph is correctly shown by
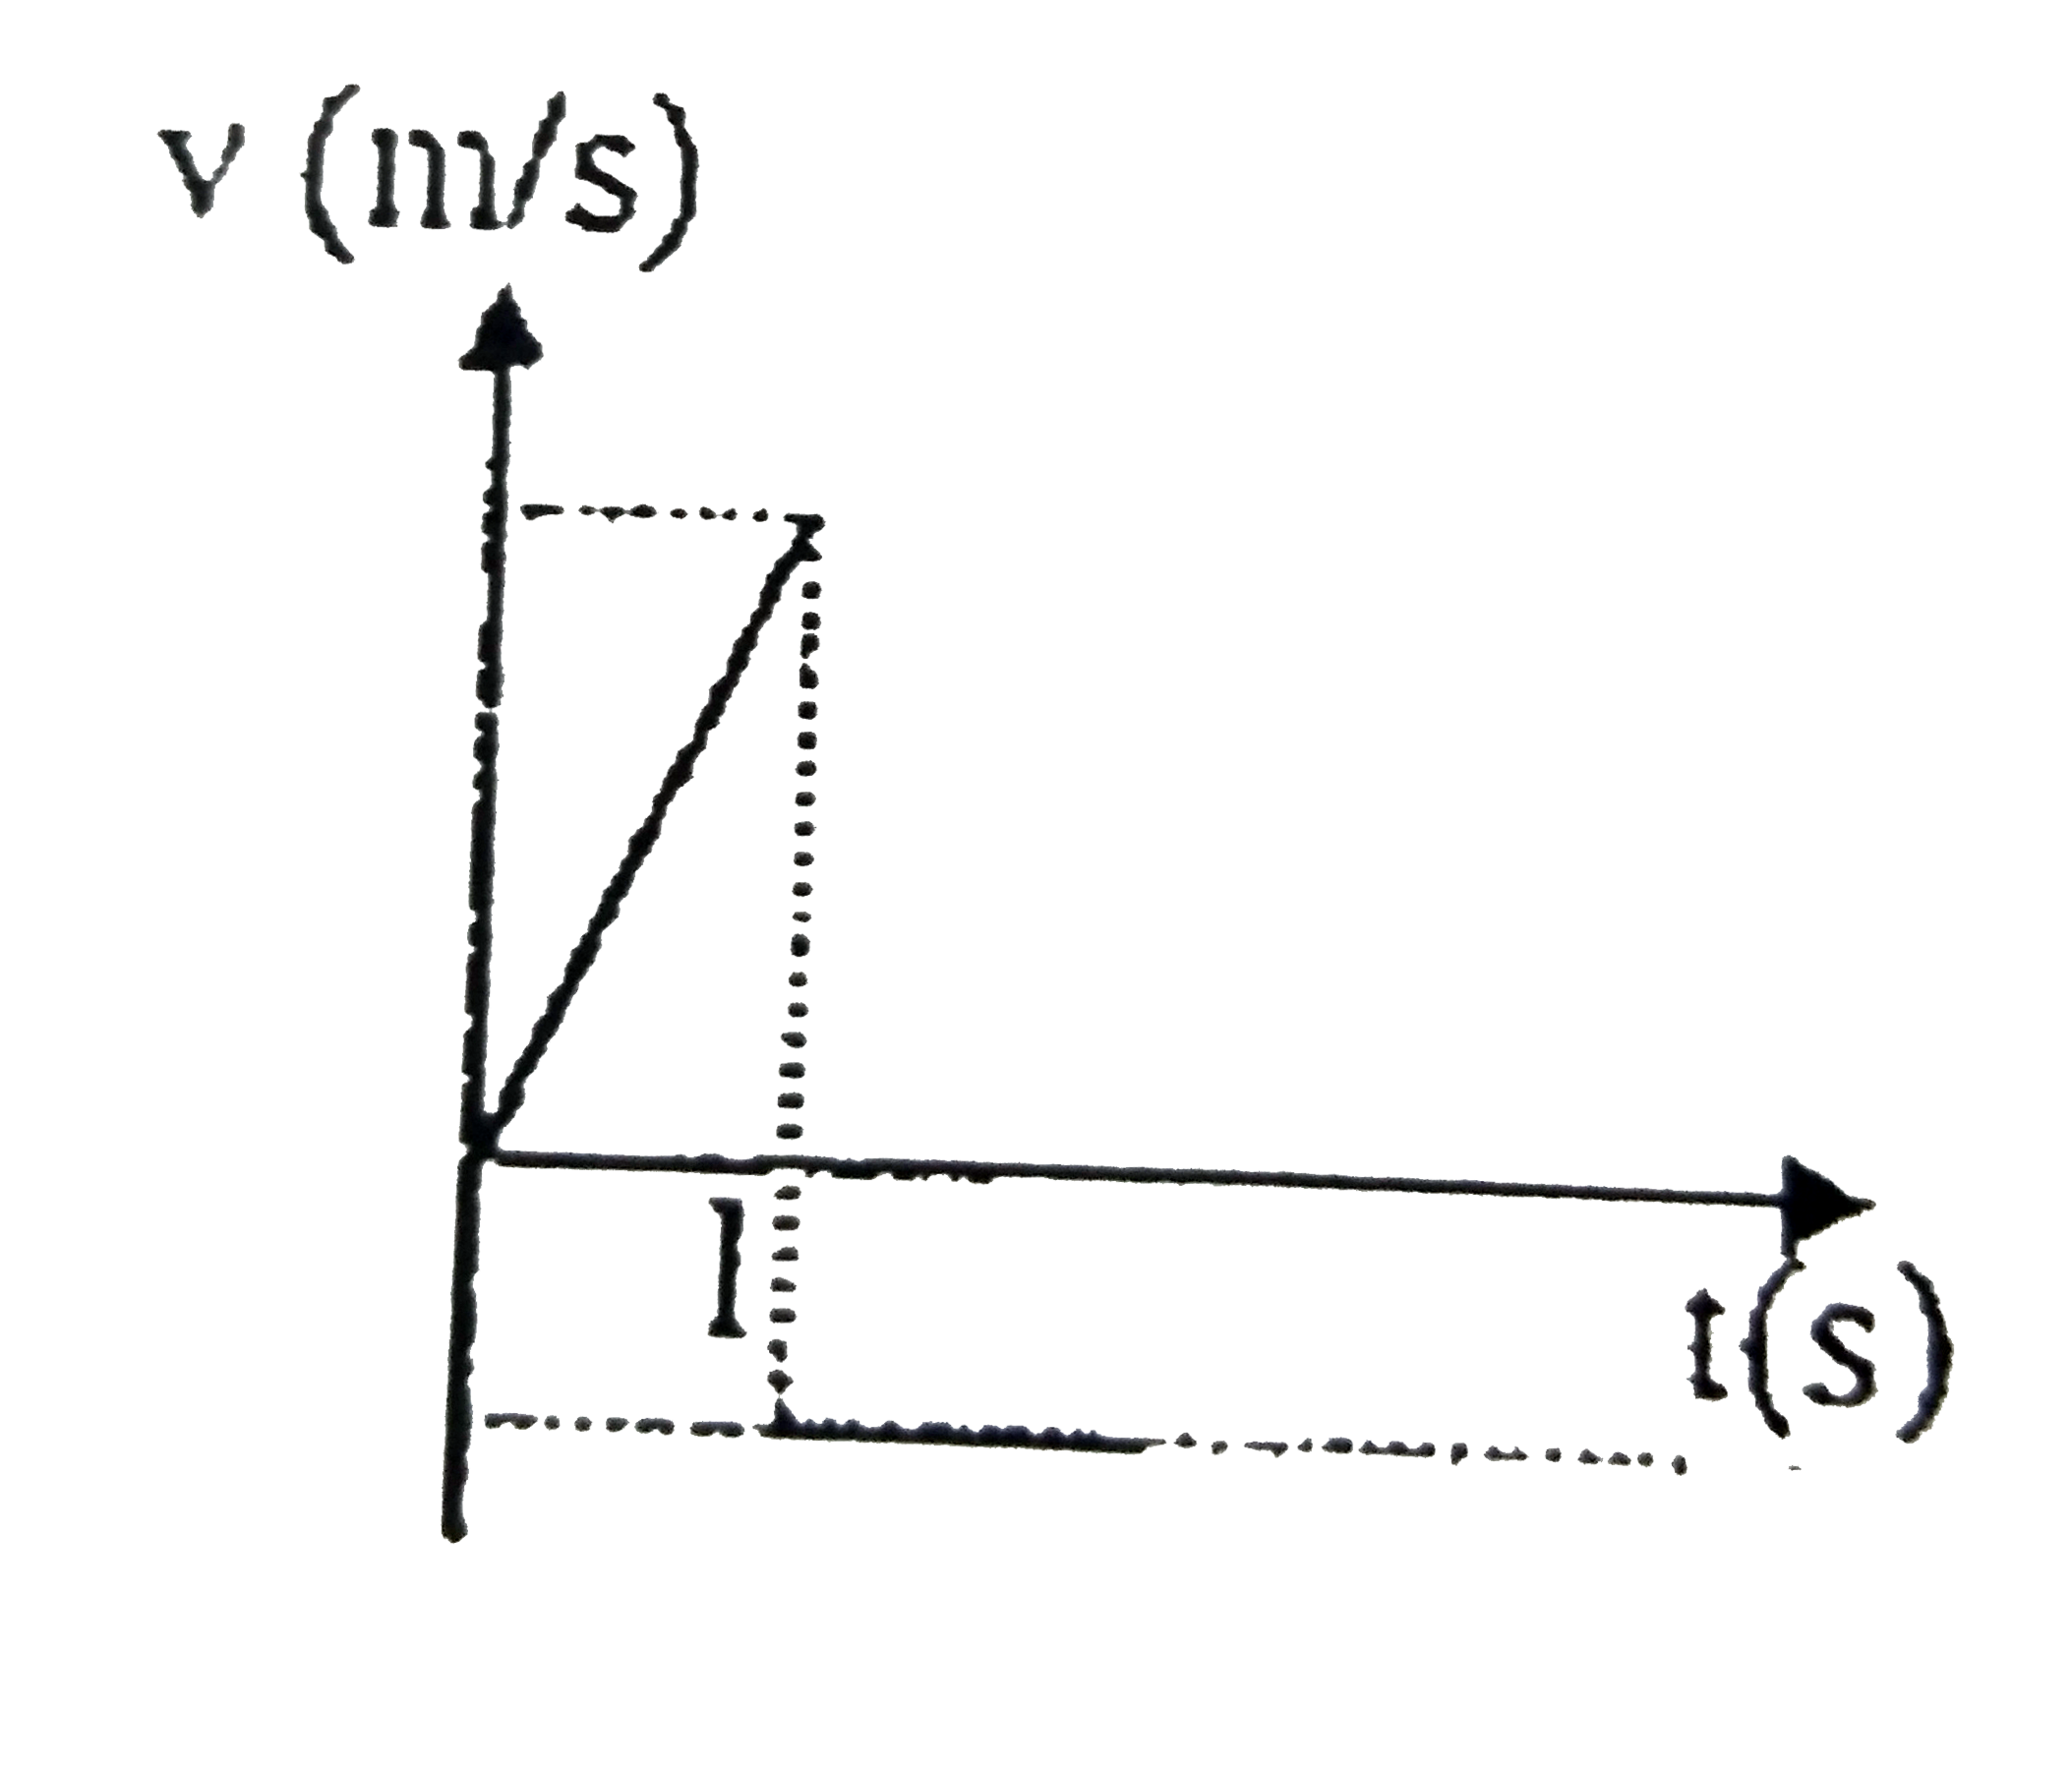
View Solutionचित्र में x - अक्ष पर चलते एक कण का विस्थापन - समय ग्राफ दिखाया गया है | इस ग्राफ से पता चलता है कि

View SolutionFigure shows the displacement (x)-time (f) graph of a particle moving on the X-axis.
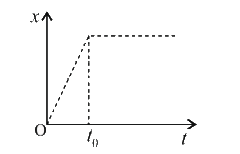
View SolutionThe velocity time graph for a particle moving along X-axis is shown in the figure. The corresponding displacement time graph is correctly shown by
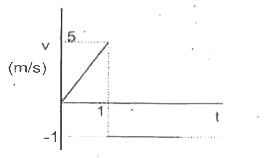
View SolutionFigure show the displacement - time graph of a particle moving on the x-axis
View Solutionदिया गया चित्र x-अक्ष पर गतिमान किसी कण की चाल के विस्थापन-समय (-1) ग्राफ को दर्शाता है।
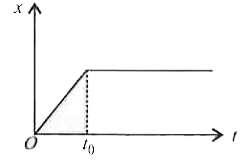
View SolutionFigure shows the displacement time graph of a particle moving on the X-axis

View SolutionFigure shows the displacement-time graph of a particle moving on the X-axis

View SolutionFigure (i) and (i) show the displacement-time graphs of two particles moving along the x-axis. We can say that
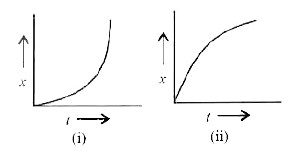
View Solution
