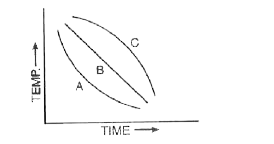
The cooling curve is represented by graph..........
A 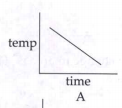
B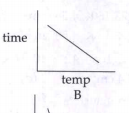
C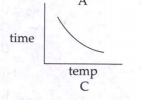
D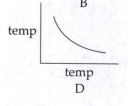 Solution in Marathi
A 
B
C
D
Step by step video & image solution for The cooling curve is represented by graph.......... A B C D by Physics experts to help you in doubts & scoring excellent marks in Class 11 exams.
Updated on:21/07/2023Topper's Solved these Questions
Similar Questions
What is most essential for propagation of mechanical wave?
View SolutionThe dimension for Torque is
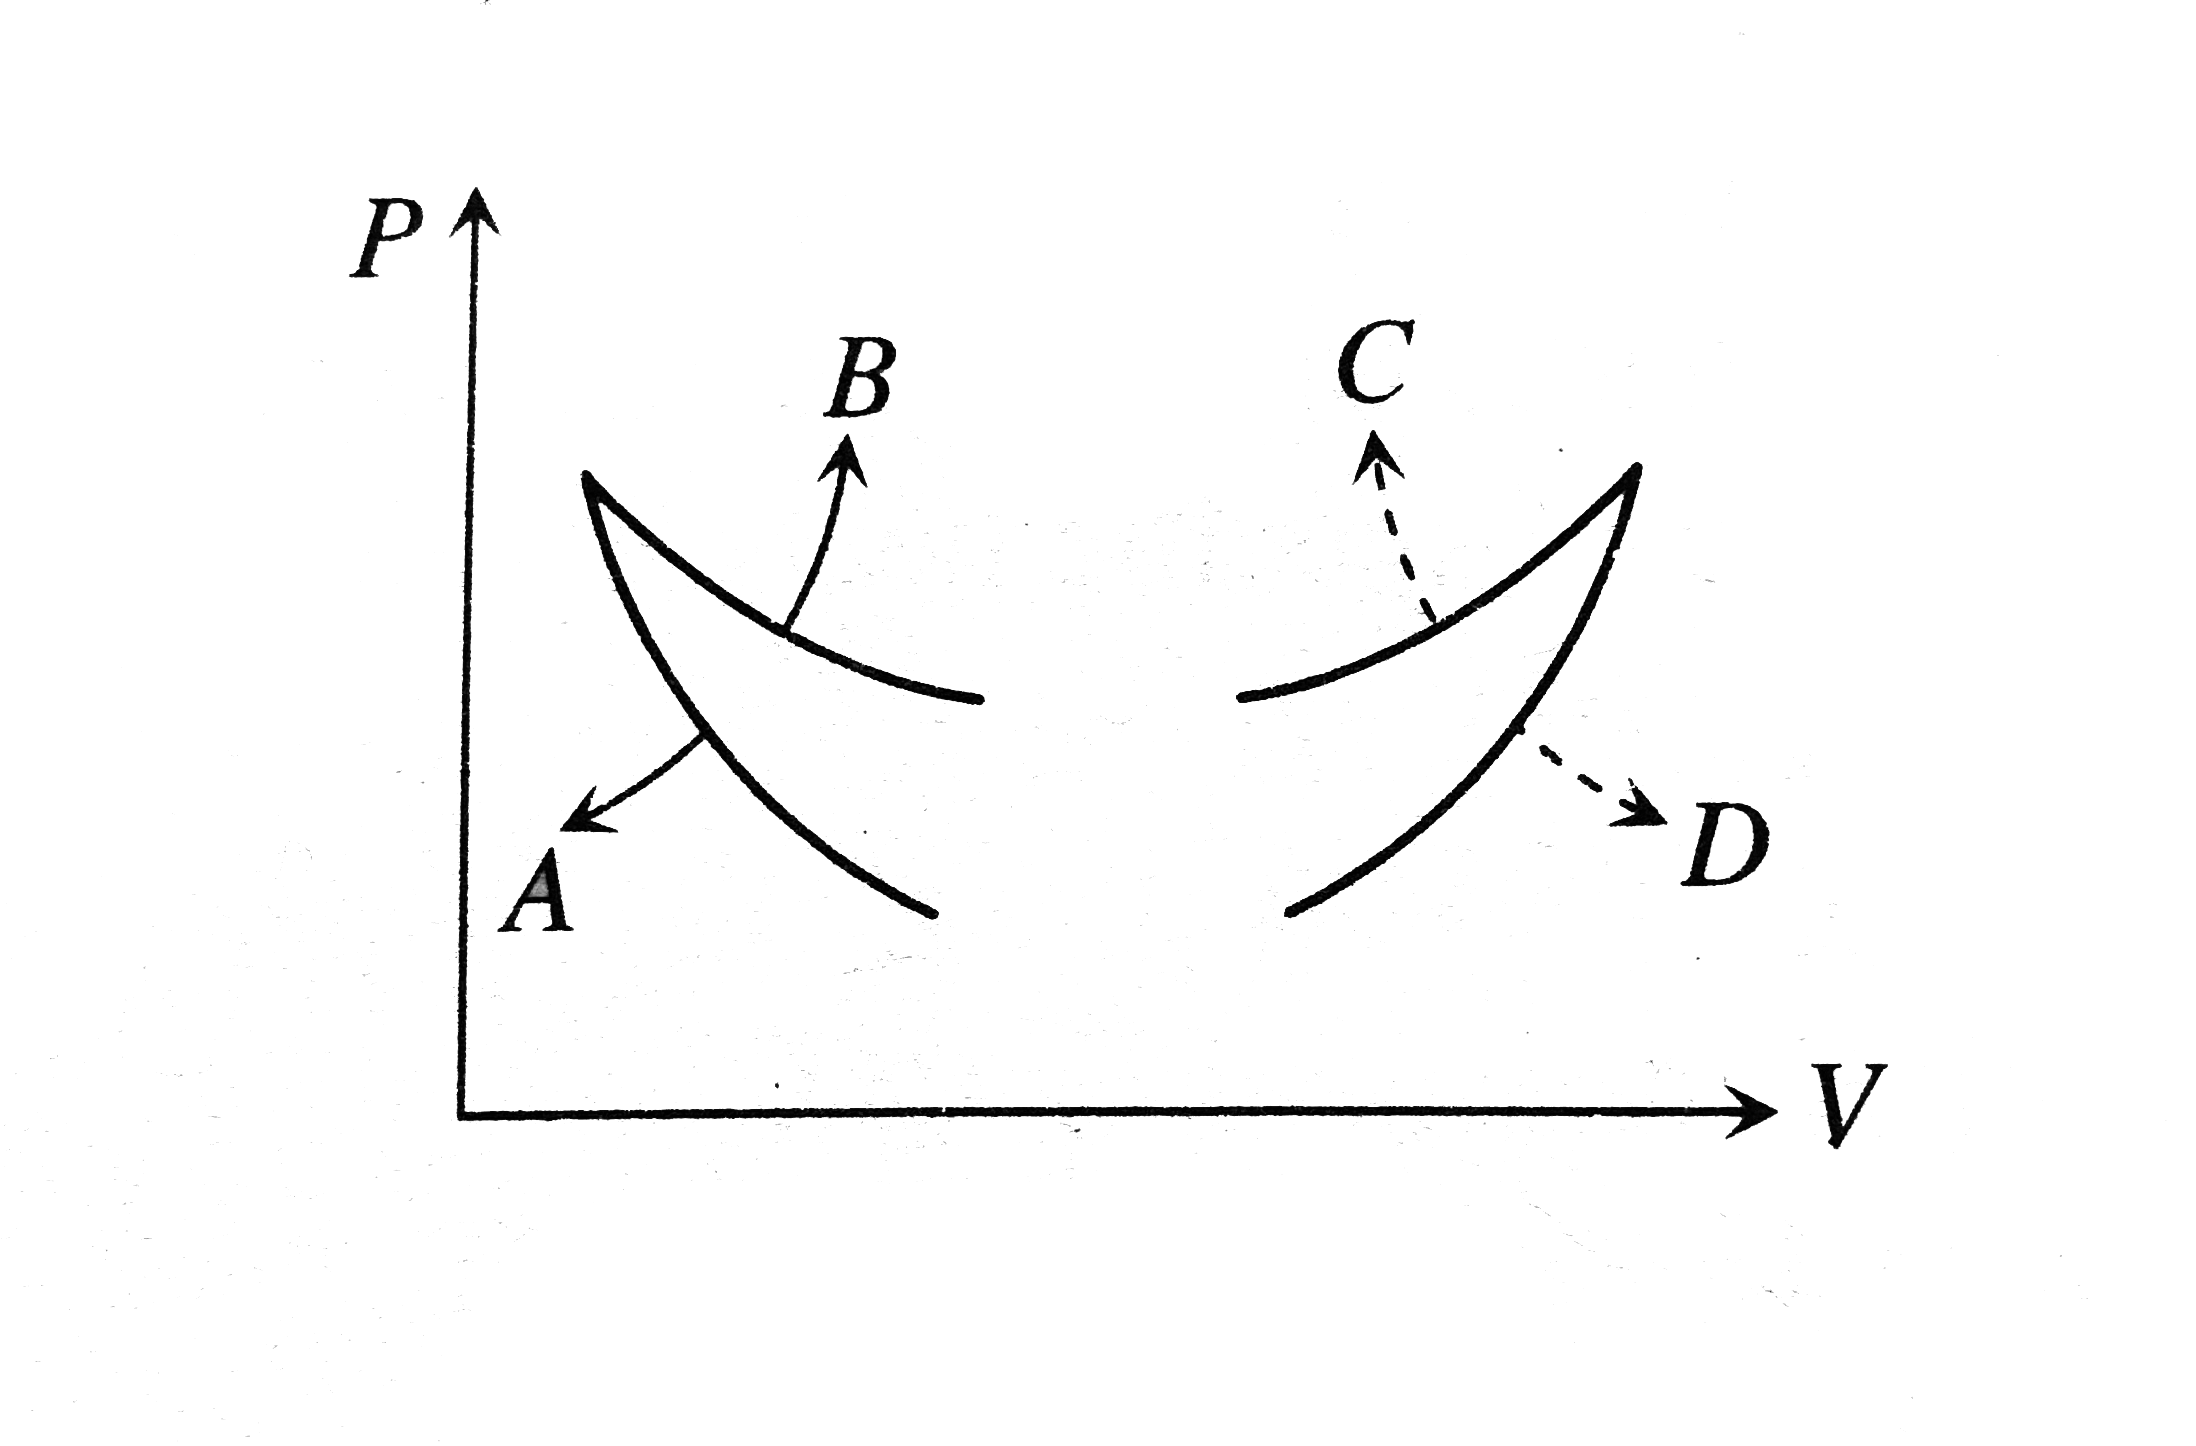
View SolutionFour curves A,B,C and D are drawn in Fig. for a given amount of gas. The curves which represent adabatic and isothermal changes
View Solution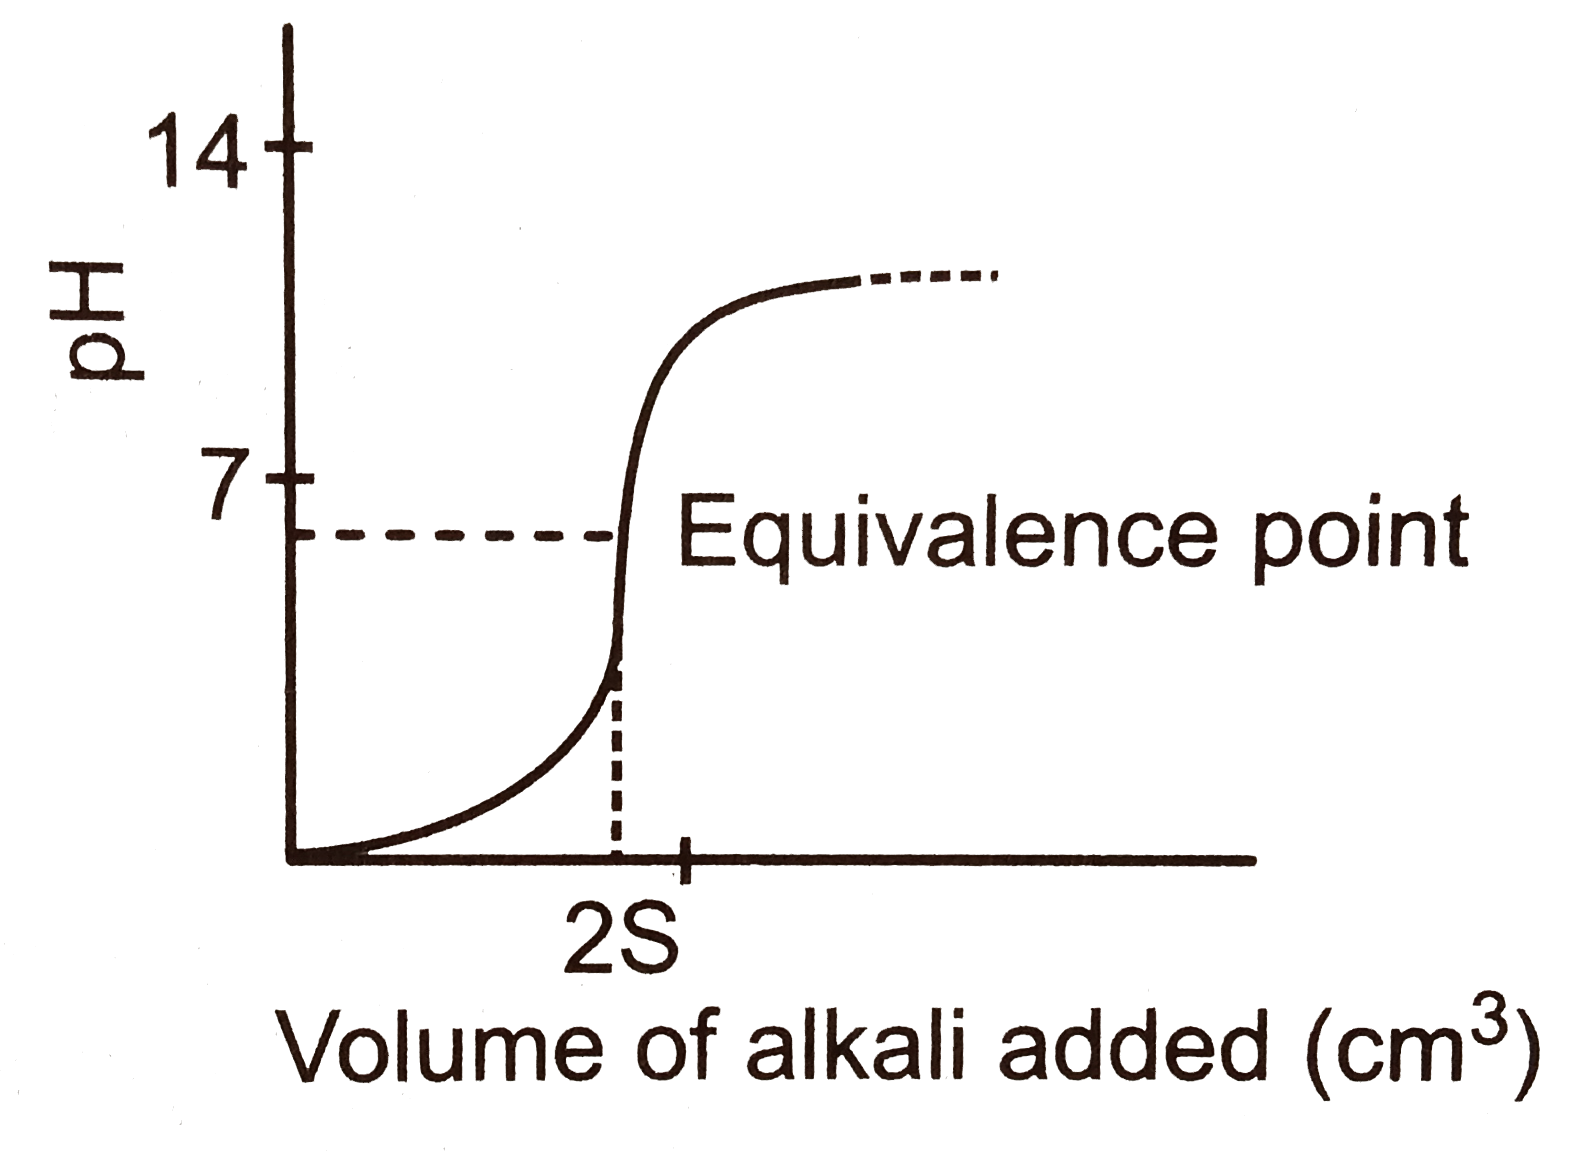
The graph represents the titration curve for :
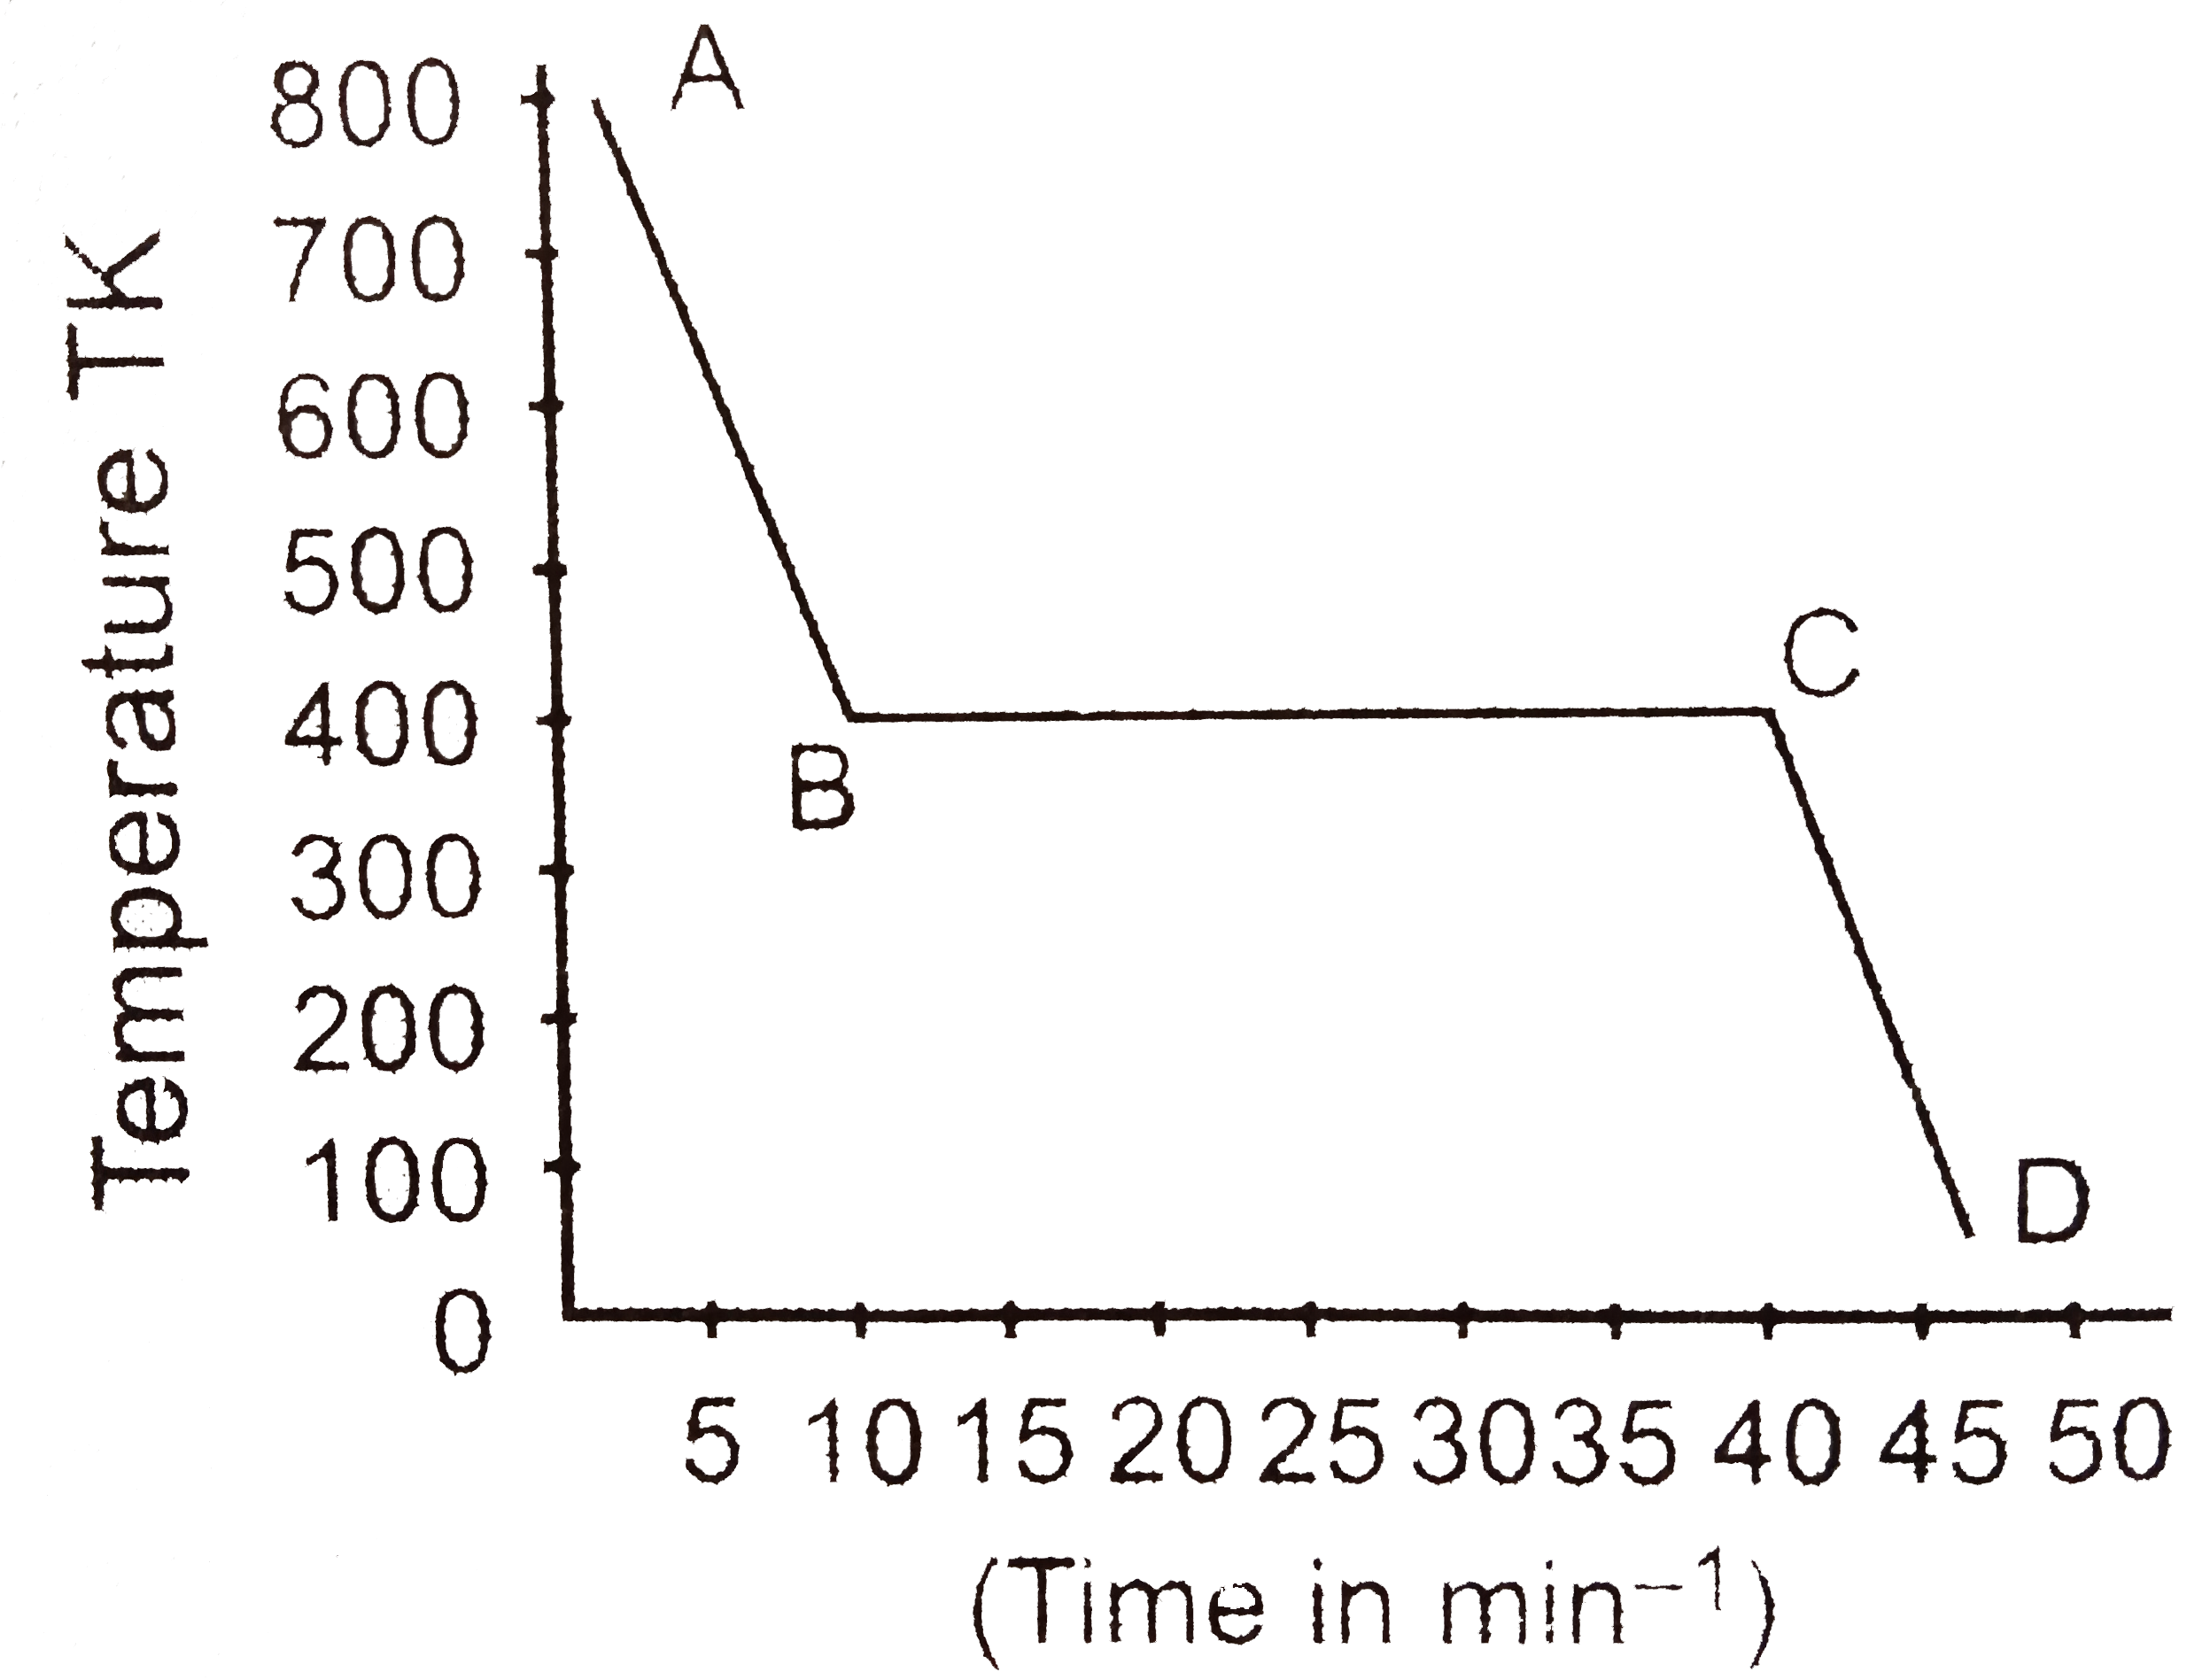
View SolutionOne mole of a substance is cooled at the rate of 0.4kJ−1min as shown in the graph. Curve AB, points B and C and curve CD represent respectively, the cooling of the liquid, start of freezing, completion of freezing and cooling of the solid based on this data. The entropy of fusion in JmolK−1 is :
View SolutionCooling curves for amorophous and crystalline substances represented as follows
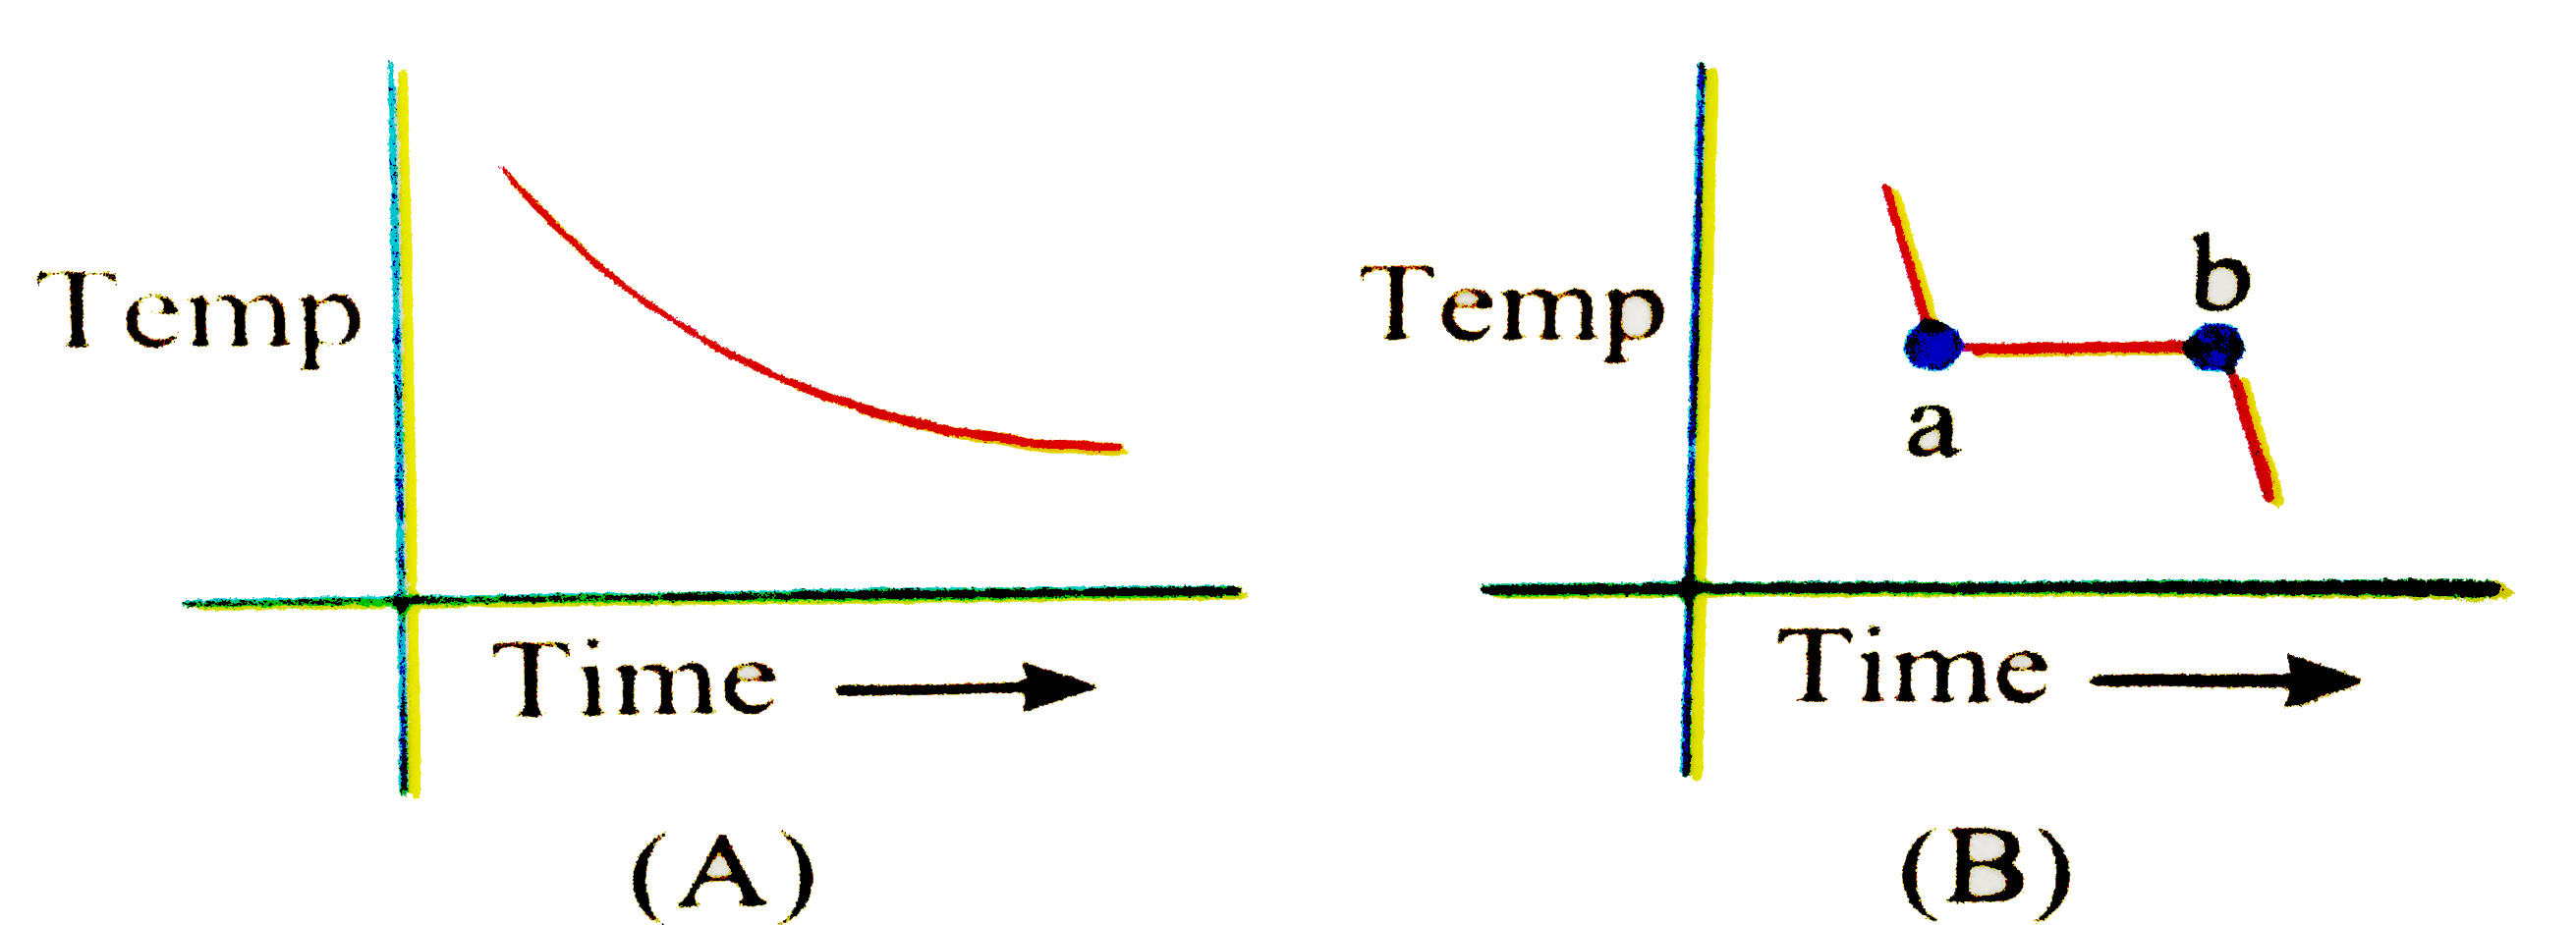
Collect statement regards (A) and (B) graphs
View SolutionRecognise the figure and find out the correct matching
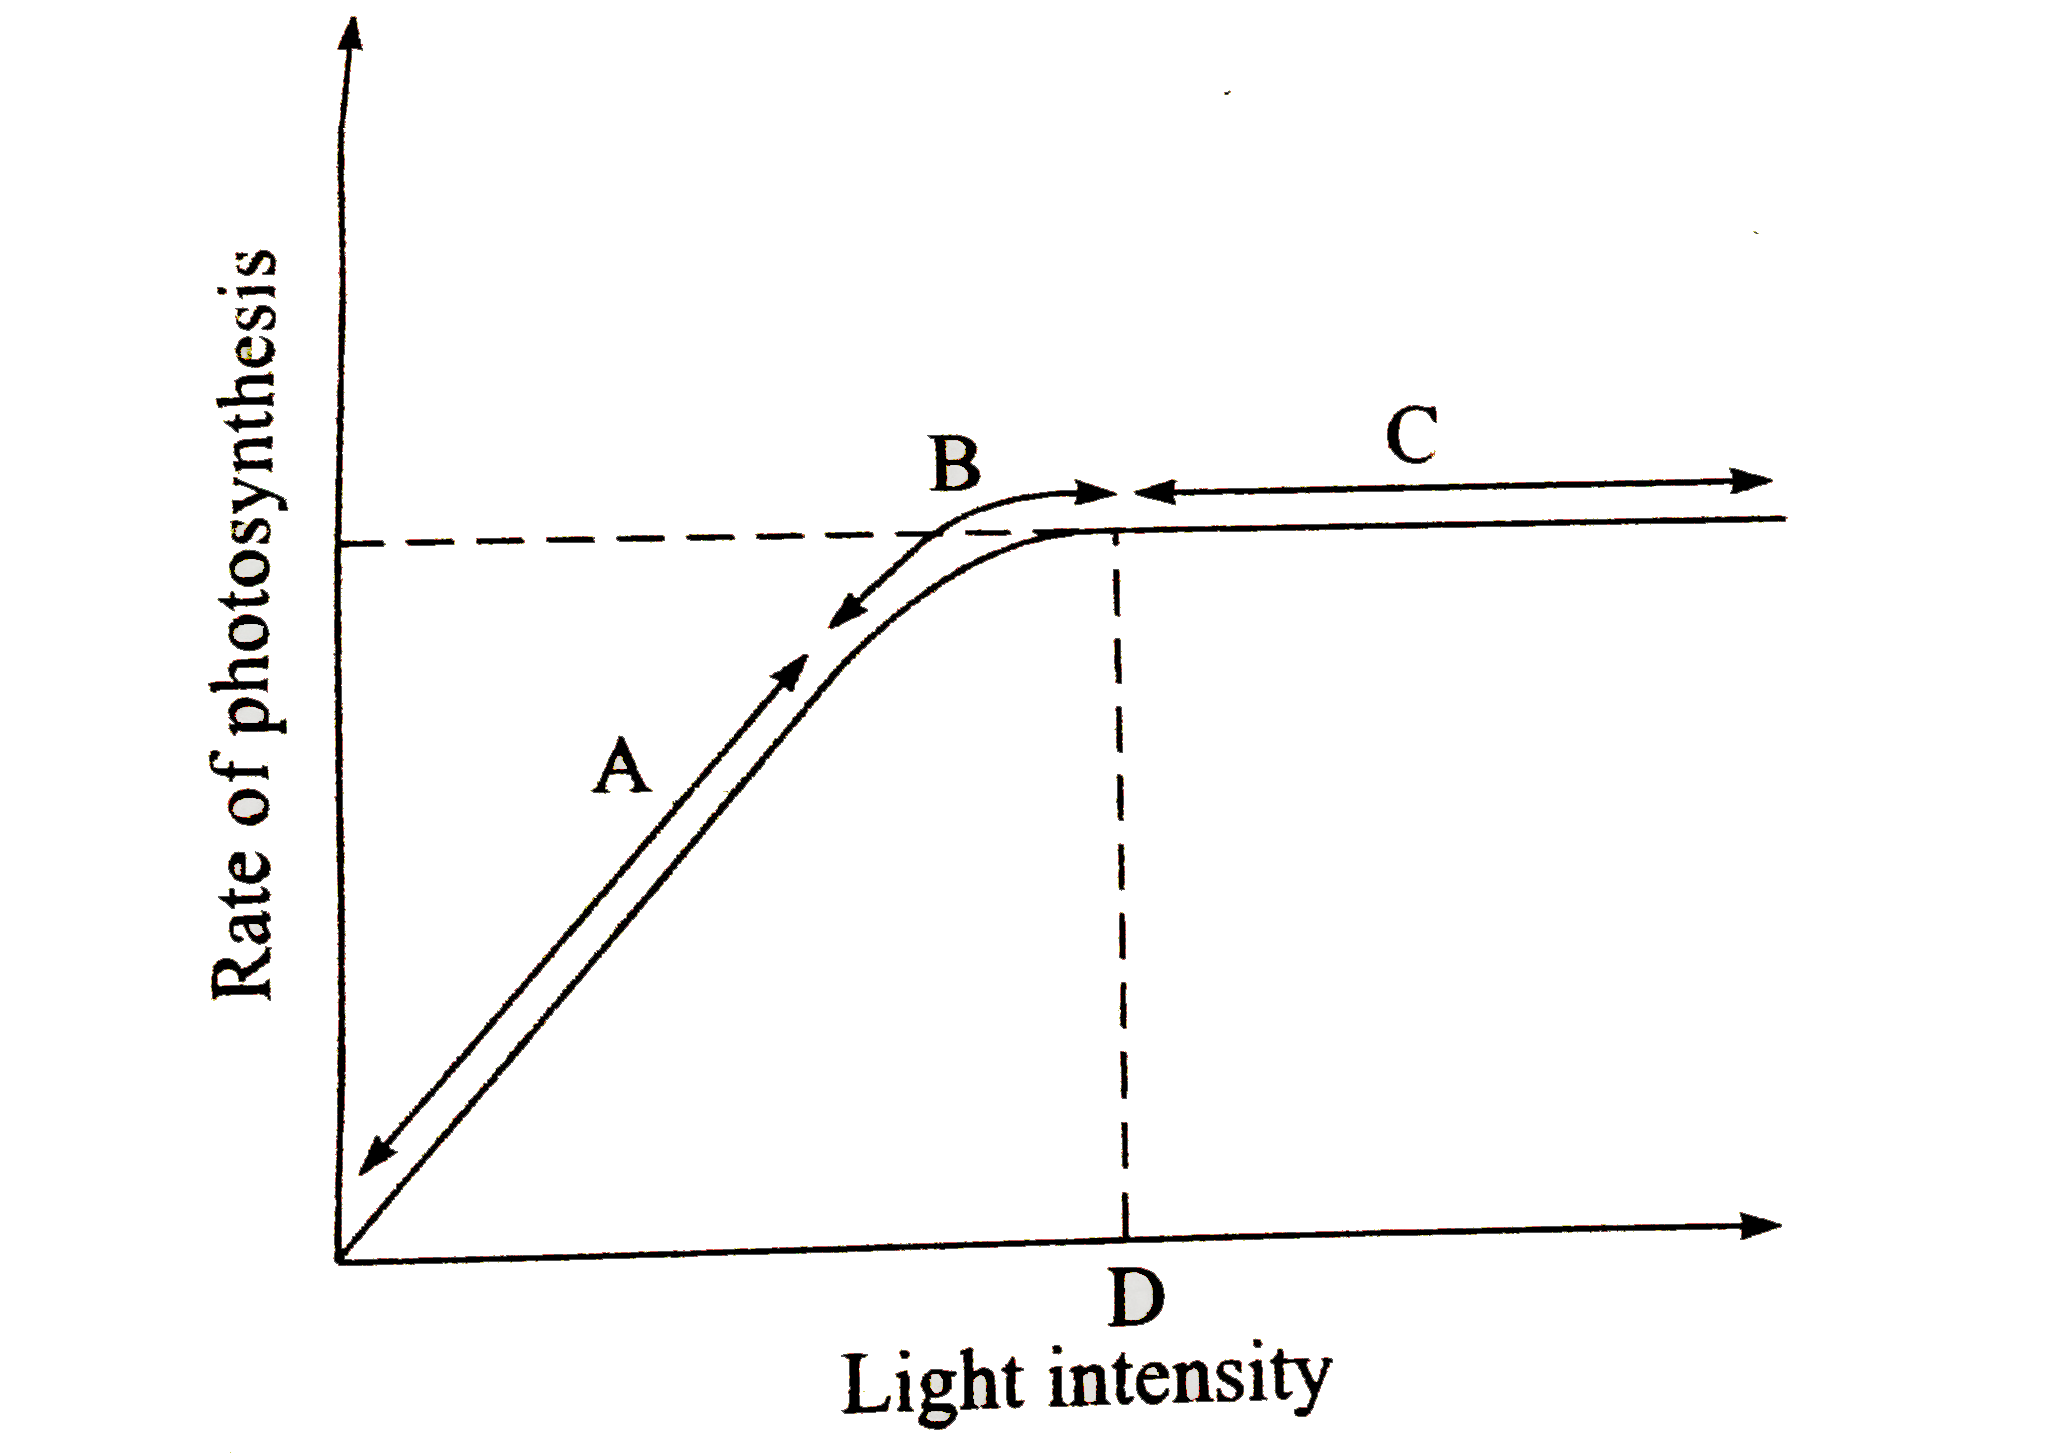
a. At which point in the curve light is a limiting factor?
b. What do 'C' represent on the curve?
c. What do 'D' represent on the curve?
d. What do 'E' represent on the curve?
View SolutionA block of steel heated to 100∘C left in a room to cool. Which of the following curves represent the correct behaviour ?
View SolutionFor four elements the IP_2 curve is shown. In the graph the elements represented by A, B, C and D are
View SolutionDraw the graph that represents the cooling of hot water with time.
View Solution(a) State Newton's law of cooling. (b) Derive Newton's law of cooling from Stefan's law,. (c) What is the limitation of Newton's law ? (d) Derive the shape of the cooling curve of a hot body using Newton's law of cooling.
View SolutionFour curves A,B,C and D are drawn in Fig. for a given amount of gas. The curves which represent adabatic and isothermal changes

View SolutionFour curves A, B, C and D are drawn in Fig. for a given amount of gas. The curves which represent adiabatic and isothermal changes
View SolutionFour curves A,B,C and D are drawn in Fig. for a given amount of gas. The curves which represent adiabatic and isothermal changes

View SolutionWhich of the following graphs represents rate of cooling of hot water?
View Solution