स्कूल की एक परीक्षा में उत्तीर्ण होने वाले लड़को का औसत 71 स्कोर है , जबकि लड़कियों का औसत 73 है स्कूल में कुल विघार्थियों का औसत स्कोर 71 . 8 है। परीक्षा में सम्मिलित होने वाले लड़के और लड़कियों की संख्या का अनुपात ज्ञात कीजिए।
The correct Answer is:3 : 2
Step by step video, text & image solution for स्कूल की एक परीक्षा में उत्तीर्ण होने वाले लड़को का औसत 71 स्कोर है , जबकि लड़कियों का औसत 73 है स्कूल में कुल विघार्थियों का औसत स्कोर 71 . 8 है। परीक्षा में सम्मिलित होने वाले लड़के और लड़कियों की संख्या का अनुपात ज्ञात कीजिए। by Maths experts to help you in doubts & scoring excellent marks in Class 10 exams.
Similar Questions
The number of students in classes A and B are 60 and 70, respectively. The average score in mathematics of students in B is 57 and that of all students in A and B is 63. What is the average score of students in A?
कक्षा A और B में छात्रों की संख्या क्रमश: 60 और 10 है | B में गणित में छात्रों का औसत अंक 57 तथा A और B के सभी छात्रों का गणित में औसत अंक 63 है |A के छात्रों का औसत अंक ज्ञात करें |03:52View SolutionThere are 96 students in a class, out of which the number of girls is 40% more than that of the boys. The average score in mathematics of the boys is 40% more than the average score of girls. If the average score in mathematics of all the students is 63, then what is the average score of the girls in mathematics?
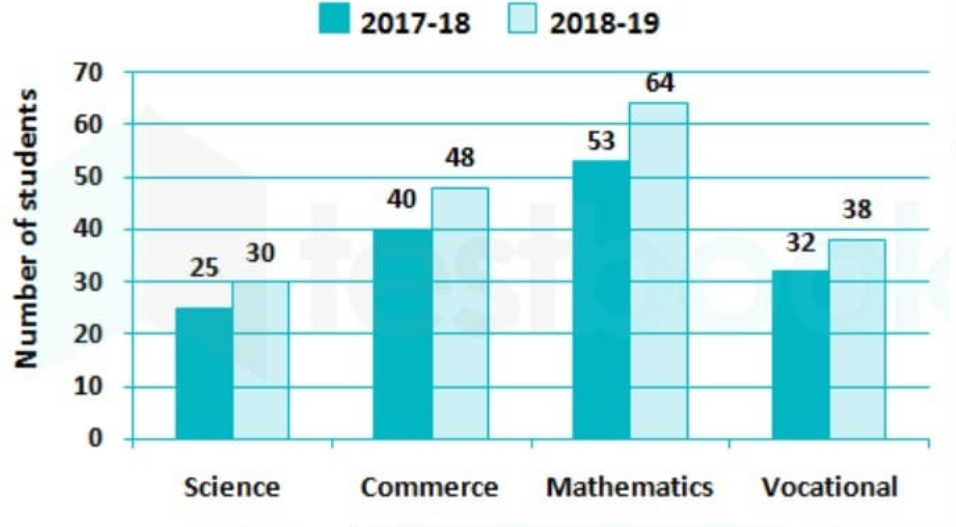
एक कक्षा में 96 छात्र हैं, जिनमें से लड़कियों की संख्या लड़कों की संख्या से 40% अधिक है | लड़कों का गणित में औसत प्राप्तांक लड़कियों के औसत प्राप्तांक से 40% अधिक है | यदि गणित में सभी छात्रों का औसत प्राप्तांक 63 है, तो गणित में लड़कियों का औसत प्राप्तांक ज्ञात करें |03:42View SolutionThe given bar graph represents the number of students who appeared in the board examination in session 2017-18 and 2018-19. Study the graph and answer the question that follows. What is the ratio of the total number of students appeared in examinations in 2017-18 and 2018-19?
दिया गया दंड आरेख सत्र 2017-18 और 2018-19 सत्र में बोर्ड परीक्षा में उपस्थित होने वाले छात्रों की संख्या को दर्शाता है। आरेख का अध्ययन करें और प्रश्न का उत्तर दें।
2017-18 और 2018-19 में परीक्षा में उपस्थित हुए छात्रों की कुल संख्या का अनुपात कया है ?02:27View Solutionनेत्र में होने वाले दोषों का DISCUSSION
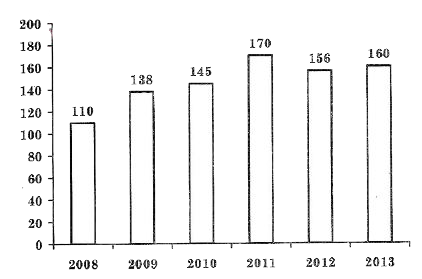
38:25View SolutionStudy the following frequency polygon and answer the questions. Given a line graph showing the number of students passed in Higher Secondary Examination in a school over the years 2008 to 2013:

The average of passed students in the years 2008, 2009, 2012 approximately is.
निम्नलिखित बारम्बारता बहुभुज का अध्ययन करें और दिए गए प्रश्नों के उत्तर दें। नीचे रेखा ग्राफ में एक स्कूल में वर्ष 2008 से 2018 तक के वर्षों में उच्चतर माध्यमिक परीक्षा में उत्तीर्ण होने वाले विद्यार्थियों की संख्या दर्शायी गई है :
वर्ष 2008, 2009, 2012 में उत्तीर्ण होने वाले विद्यार्थियों की संख्या का औसत लगभग क्या था?01:25View SolutionGiven here is a multiple bar diagram of the scores of four players in two innings. Study the diagram and answer the questions % The average runs of two innings of the player who scored highest in average are: यहाँ चार खिलाड़ियों की दो पारियों के स्कोर का बहु बार-ग्राफ दिया गया है। आरेख का अध्ययन करें और प्रश्नों का उत्तर दें: दोनों पारियों में उच्चतम स्कोर प्राप्त करने वाले खिलाड़ी का औसत रन है br>
02:13View SolutionThe average salary, per head of all the workers of an institution is ₹ 60. The average salary of 12 officers is ₹ 400 the average salary, per head, of the rest is ₹ 56. The total number of workers in the institution is. एक संस्था में सभी कामगारों का प्रति व्यक्ति औसत वेतन ₹ 60 है। 12 अधिकारियों का औसत वेतन ₹ 400 है। शेष का प्रति व्यक्ति औसत वेतन ₹ 56 है। संस्था में कामगारों की कुल संख्या कितनी है?
02:51View SolutionOut of four numbers the average of the first three is 15 and that of the last three is 16. If the last number is 19, the first is. चार संख्याओं में से पहली तीन का औसत 15 है और अन्तिम तीन का औसत 16 है। यदि अन्तिम संख्या 19 है, तो पहली संख्या है
01:42View Solution

