The given bar graph represents the number of students who appeared in the board examination in session 2017-18 and 2018-19. Study the graph and answer the question that follows. What is the ratio of the total number of students appeared in examinations in 2017-18 and 2018-19?
दिया गया दंड आरेख सत्र 2017-18 और 2018-19 सत्र में बोर्ड परीक्षा में उपस्थित होने वाले छात्रों की संख्या को दर्शाता है। आरेख का अध्ययन करें और प्रश्न का उत्तर दें।
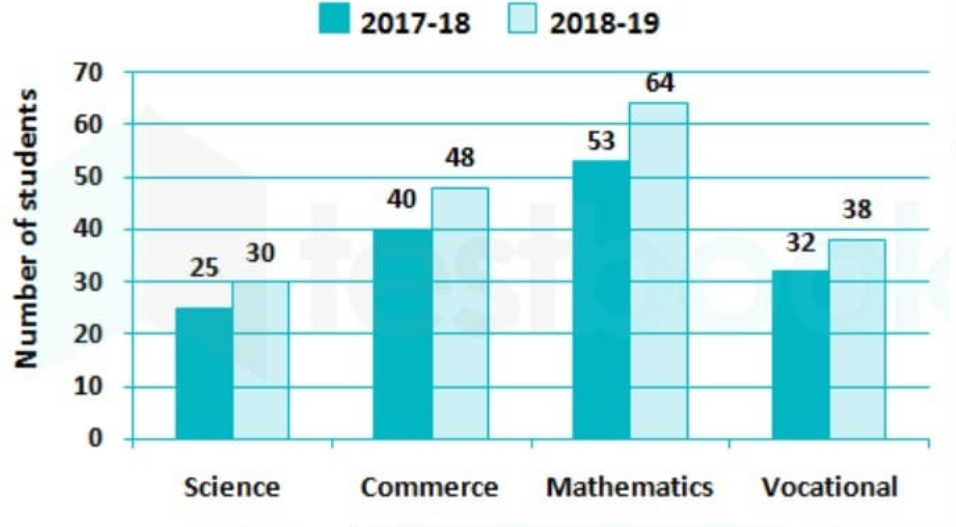
2017-18 और 2018-19 में परीक्षा में उपस्थित हुए छात्रों की कुल संख्या का अनुपात कया है ?
5:6
6:5
3:4
4:5
Step by step video & image solution for The given bar graph represents the number of students who appeared in the board examination in session 2017-18 and 2018-19. Study the graph and answer the question that follows. What is the ratio of the total number of students appeared in examinations in 2017-18 and 2018-19? दिया गया दंड आरेख सत्र 2017-18 और 2018-19 सत्र में बोर्ड परीक्षा में उपस्थित होने वाले छात्रों की संख्या को दर्शाता है। आरेख का अध्ययन करें और प्रश्न का उत्तर दें। 2017-18 और 2018-19 में परीक्षा में उपस्थित हुए छात्रों की कुल संख्या का अनुपात कया है ? by Maths experts to help you in doubts & scoring excellent marks in Class 14 exams.
Updated on:21/07/2023Topper's Solved these Questions
Similar Questions
The given bar graph represents the number of students who appeared in the board examination in session 2017-18 and 2018-19. Study the graph and answer the question that follows. What percentage is the total number of students who appeared in 2017-18 is less than the total number of students who appeared in 2018-19?(correct to one decimal place)
दिया गया दंड आरेख सत्र 2017-18 और 2018-19 सत्र में बोर्ड परीक्षा में उपस्थित होने वाले छात्रों की संख्या को दर्शाता है। आरेख का अध्ययन करें और प्रश्न का उत्तर दें।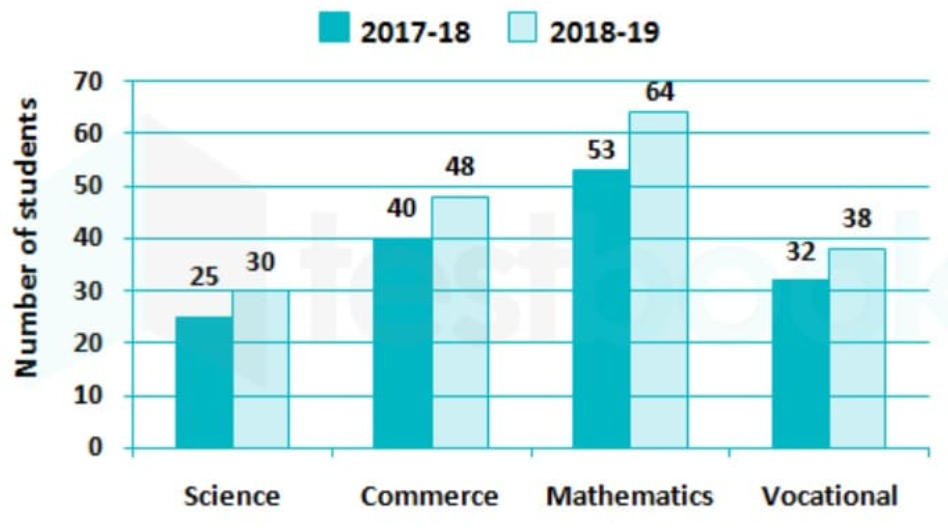
2017-18 में उपस्थित होने वाले छात्रों की कुल संख्या 2018-19 में उपस्थित होने वाले कुल छात्रों (एक दशमलव हा तक) से कितने प्रतिशत कम है?
View SolutionThe given bar graph represents the number of students who appeared in the board examination in session 2017-18 and 2018-19. Study the graph and answer the question that follows.
What percentage is the total number of students who appeared in 2017-18 is less than the total number of students who appeared in 2018-19?
View Solution
Knowledge Check
The given bar graph presents the results in terms of number of students in a school for the five academic year 2013-2014 to 2017-2018.
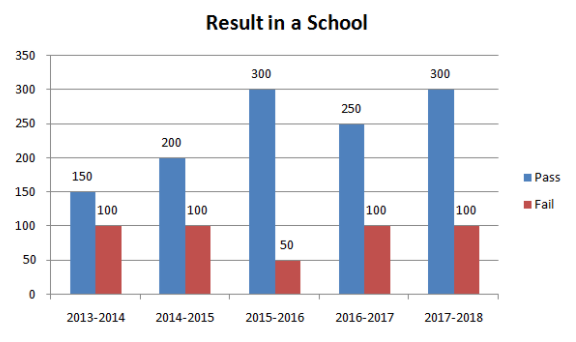
In which year the percentage increase in the total number of students is the highest in a comparison to the previous academic year?A2017-2018B2015-2016C2016-2017D2014-2015
The given bar graph represents the number of students who appeared in the board examination in session 2017-18 and 2018-19. Study the graph and answer the question that follows.
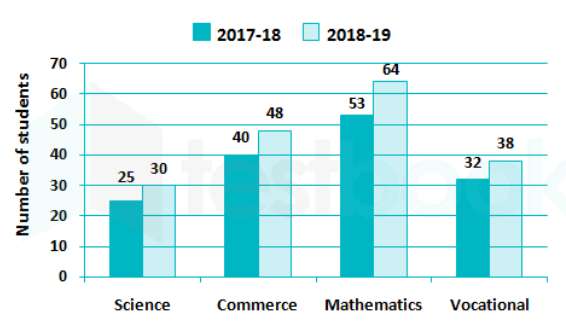
The difference between the average number of students of Science and Mathematics streams in 2017-2018 and that in Commerce and Vocational in 2018-19, is:
View SolutionThe given bar graph represents the number of students who appeared in the board examination in session 2017-18 and 2018-19. Study the graph and answer the question that follows.
दिया गया दंड आरेख सत्र 2017-18 और 2018-19 सत्र में बोर्ड परीक्षा में उपस्थित होने वाले छात्रों की संख्या को दर्शाता है। आरेख का अध्ययन करें और प्रश्न का उत्तर दें। The difference between the average number of students of Science and Humanities stream in 2017-18 and that in Commerce and Vocational in 2018-19 is:
2017-18 में विज्ञान और मानविकी विषय के छात्रों की औसत संख्या और 2018-19 में वाणिज्य और व्यावसायिक में छात्रों की औसत संख्या के बीच अंतर ज्ञात करे।
View SolutionThe following graph shows the number of students (in hundreds) in three different courses in four different institutes.Study the graph and answer the question. What is the total number of students (in hundreds) in M.Sc. course across all institutes?
निम्नलिखित आरेख चार अलग-अलग संस्थानों में तीन अलग-अलग पाठ्यक्रमों में छात्रों की संख्या , (सैकड़ों में) दिखाता है। आरेख का अध्ययन करें और प्रश्न का उत्तर दें।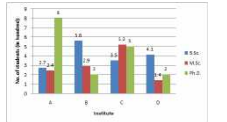
सभी संस्थानों में M.Sc. पाठ्यक्रम में छात्रों की कुल संख्या (सो में ) कितनी है?
View SolutionStudy the graph and answer question ,
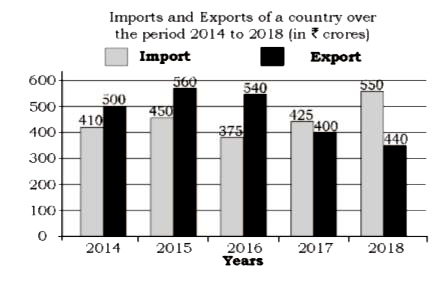
In what percentage are the total imports of the country in 2016 and 2017 less then the total exports 2014 ,2015 and 2018
View SolutionThe given Bar Graph presents the number of different types of vehicles exported by a company in 2017 and 2018.What is the ratio of the total number of vehicles exported in 2017 of types B, C and D to that of vehicles exported in 2018 of the types A, D and E?
दिया गया दंड आरेख एक कंपनी के द्वारा 2017 और 2018 में निर्यात किये गए अलग-अलग प्रकार के वाहनों की संख्या को दर्शाता है |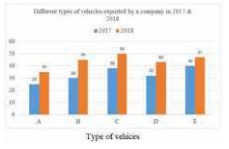
2017 में निर्यात किये गए B, C और D प्रकार के वाहनों की कुल संख्या का 2018 में निर्यात किये गए A, D और E प्रकार के वाहनों की संख्या के साथ अनुपात ज्ञात करें |
View SolutionThe graph shows the result of 10th class students of a school for 4 years. Study the graph and answer the questions:
The number of students appeared for the 10th class exam in the year 2002 is.
निम्नलिखित दण्ड आरेख 10 वीं कक्षा के छात्रों का 4 वर्ष का परीक्षा परिणाम दर्शाता है। आरेख का अध्ययन कीजिए और निम्नलिखित प्रश्नों का उत्तर दीजिए : छात्रों की संख्या
वर्ष 2002 में 10 वीं कक्षा की परीक्षा में शामिल छात्रों की संख्या बताइए:
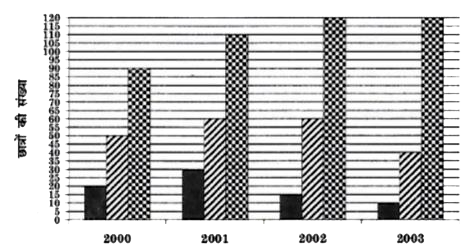
View SolutionThe given bar graph presents the results in terms of the number of students in a school of the five academic years, 2013-2014 to 2017-2018.
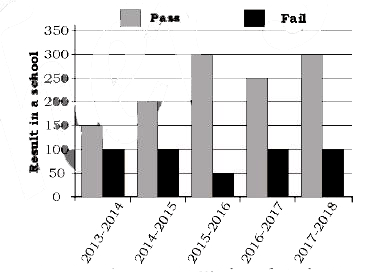
What is the average number of students who passed in the five academic years?
View Solution
