Conversion of Pressure Volume Temperature Graphs
Step by step video solution for Conversion of Pressure Volume Temperature Graphs by Physics experts to help you in doubts & scoring excellent marks in Class 11 exams.
Updated on:21/07/2023Similar Questions
Knowledge Check
Pressure versus temperature graph of an ideal gas at constant volume V is shown by the straight line A. Now mass of the has is doubled and the volume is halved, then the corresponding pressure versus temperature graph will be shown by the line
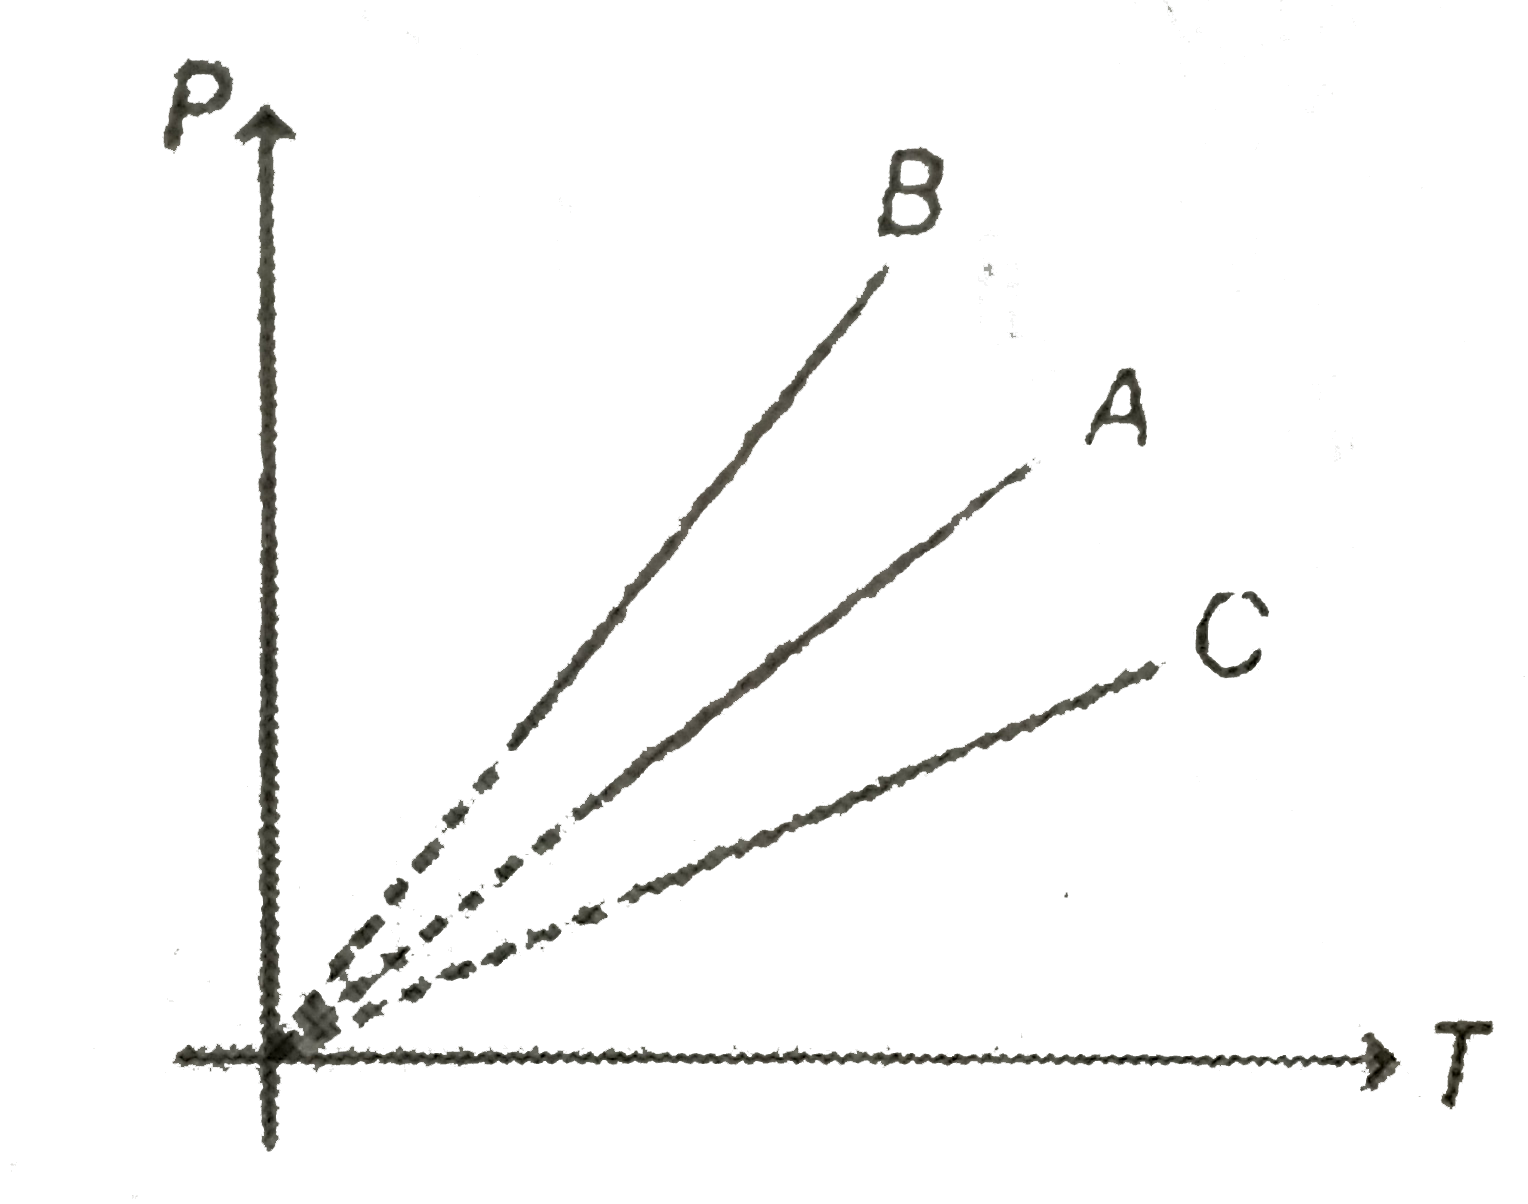 AABBCCDNone of these
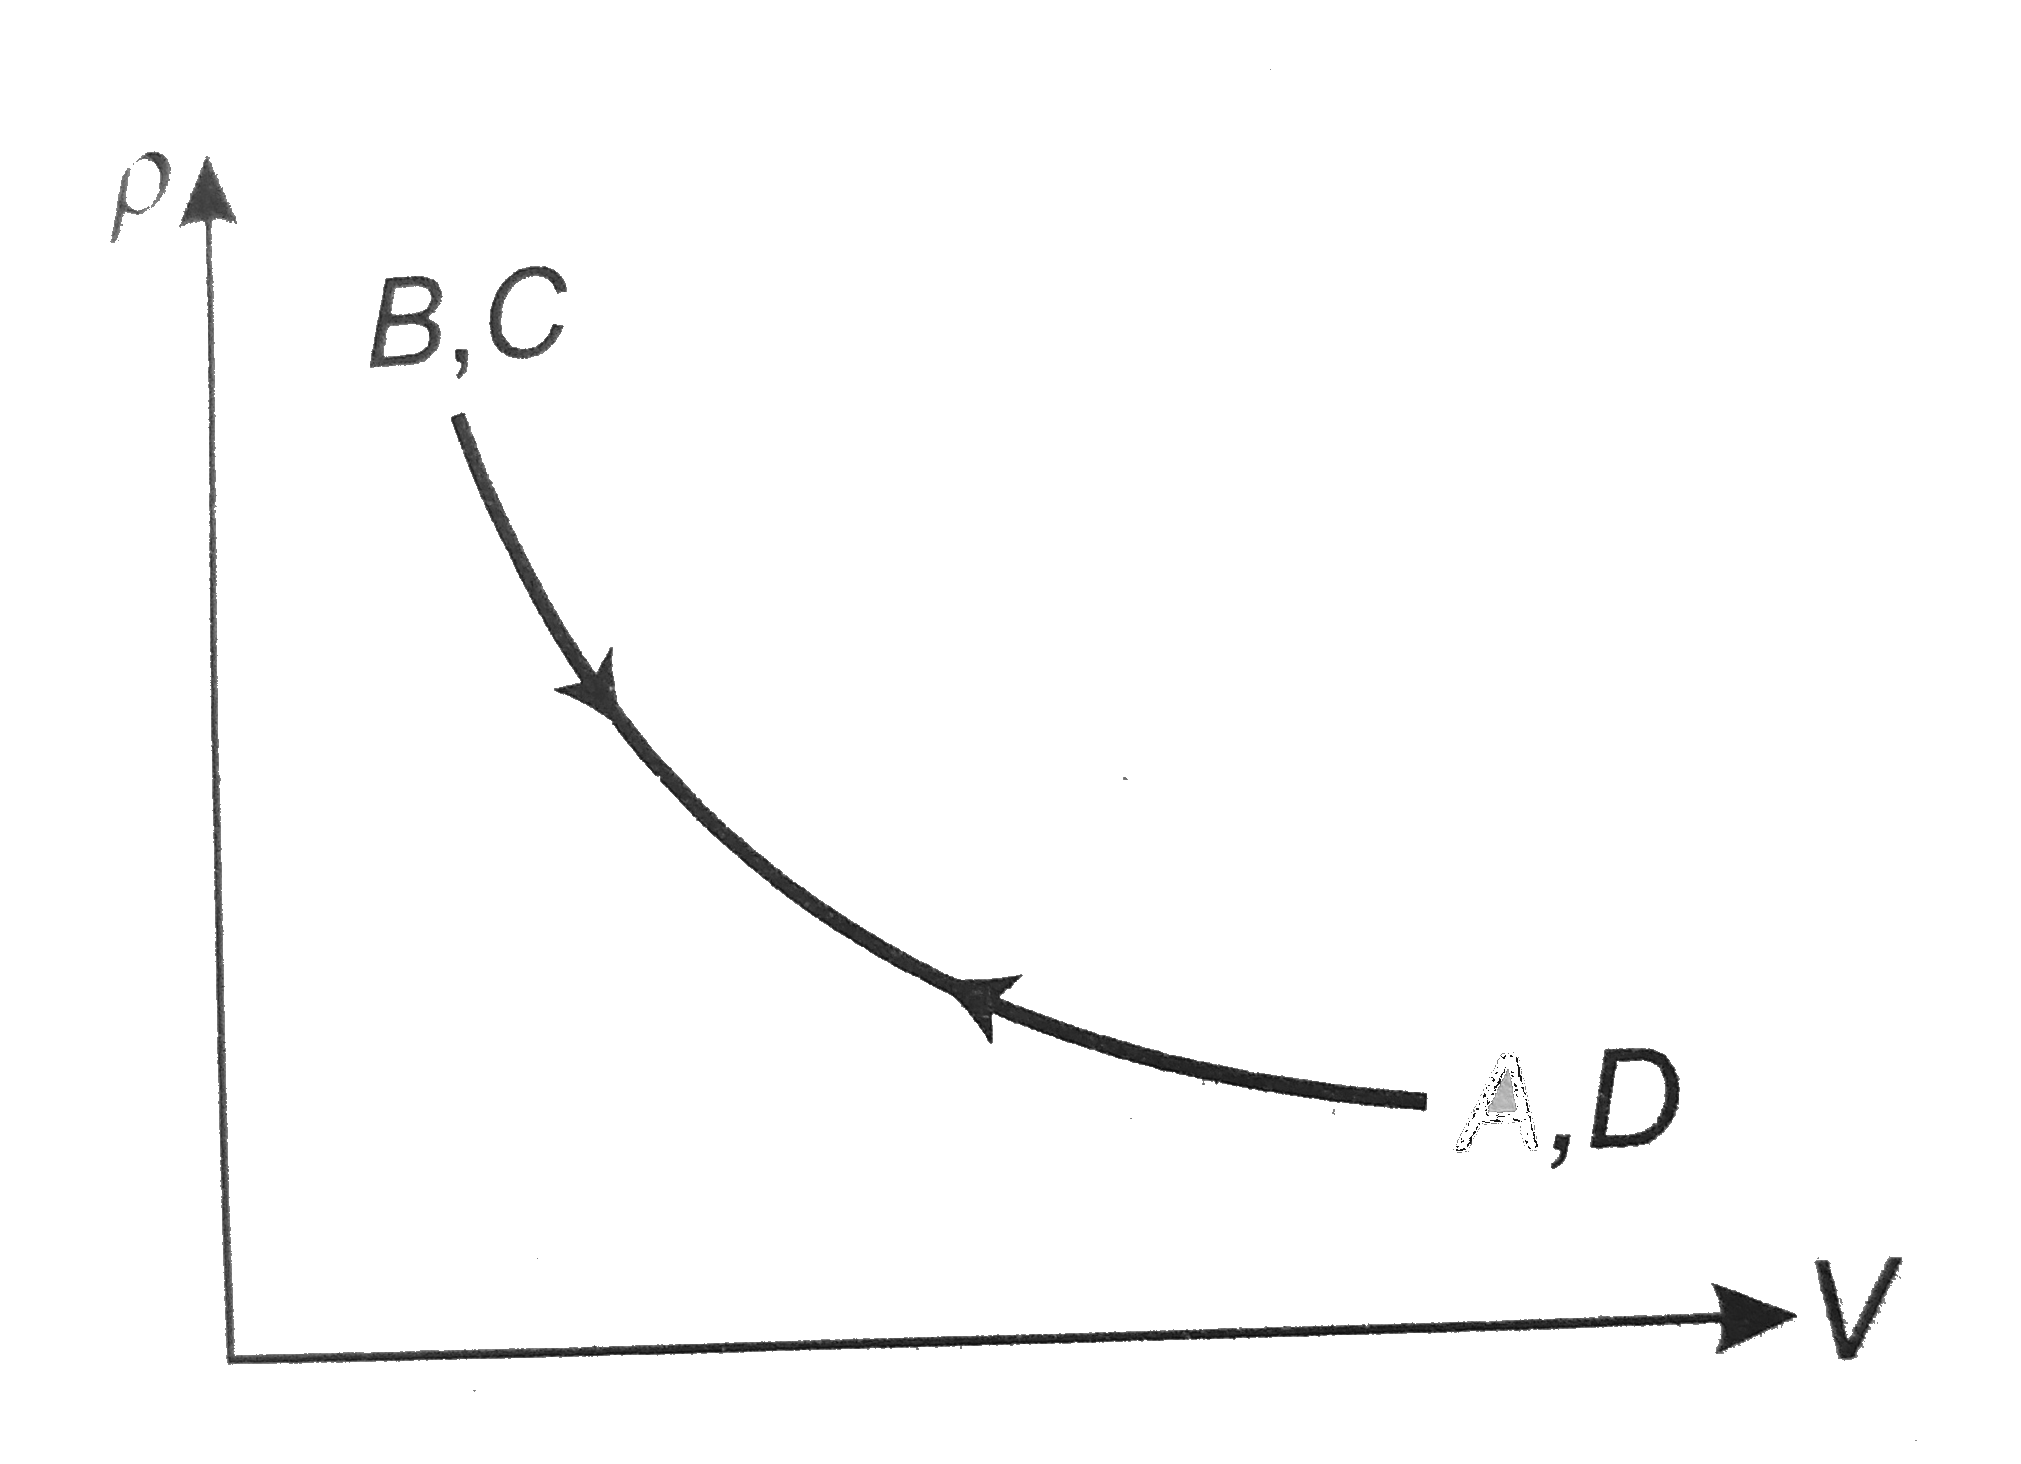
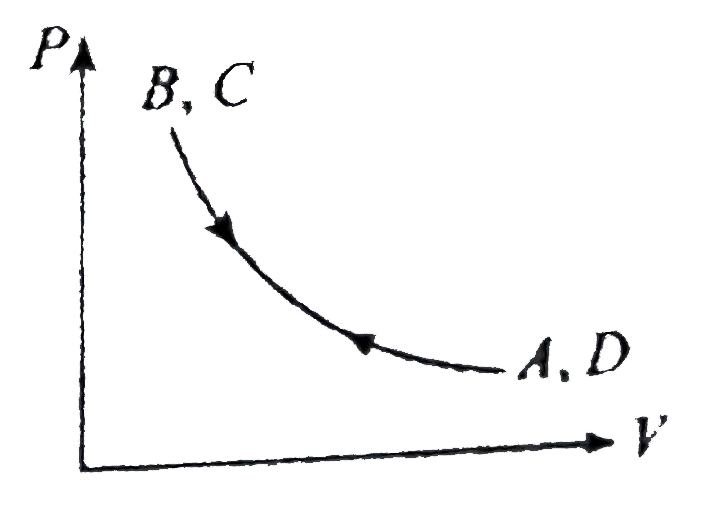
Density vs volume graph is shown in the figure. Find corresponding pressure vs temperature graph
 A
A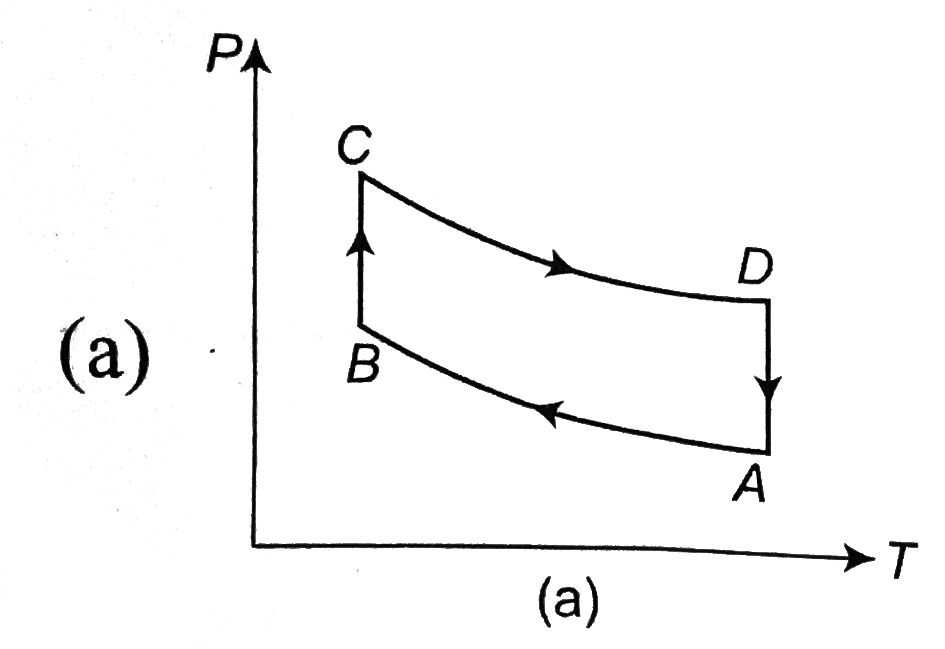 B
B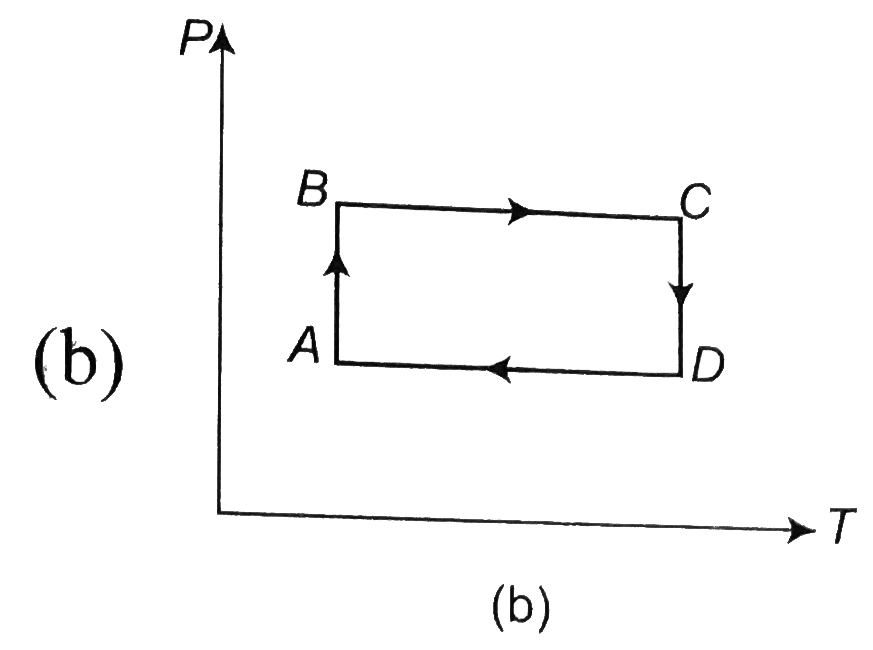 C
C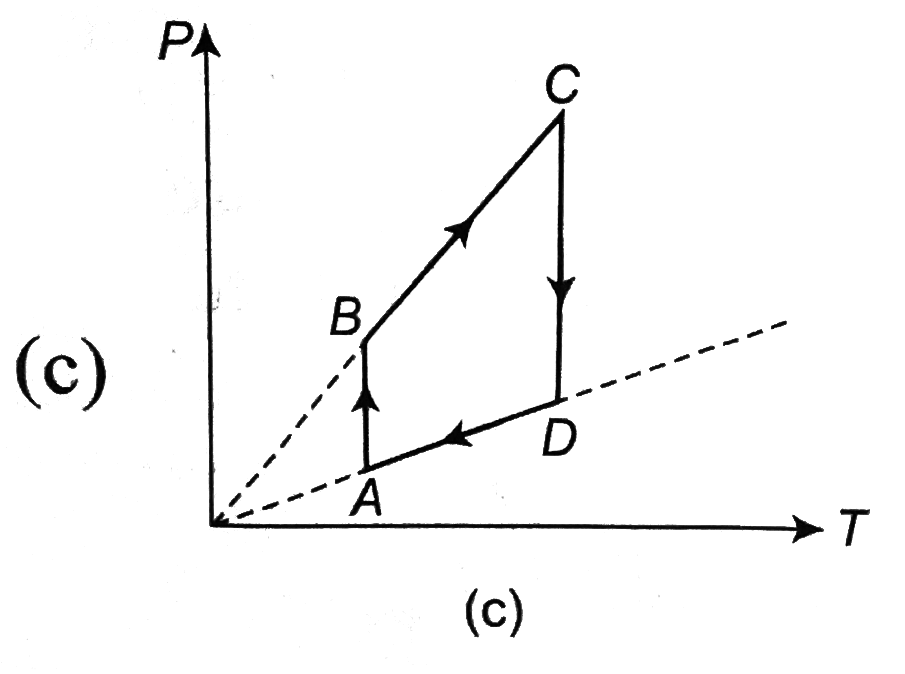 D
D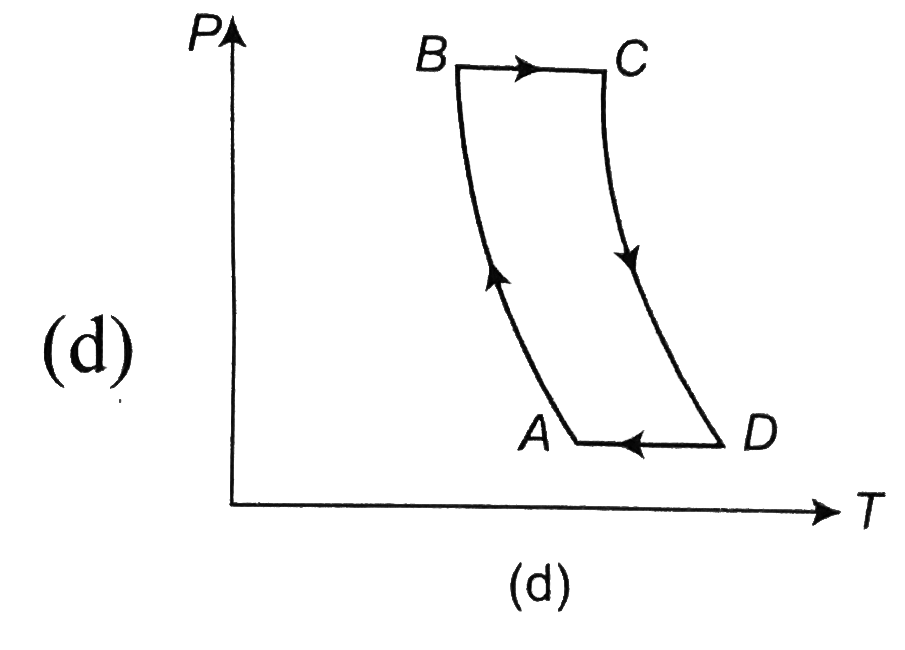
Density vs volume graph is shown in the figure . Find corresponding pressure vs temperature graph :
 A
A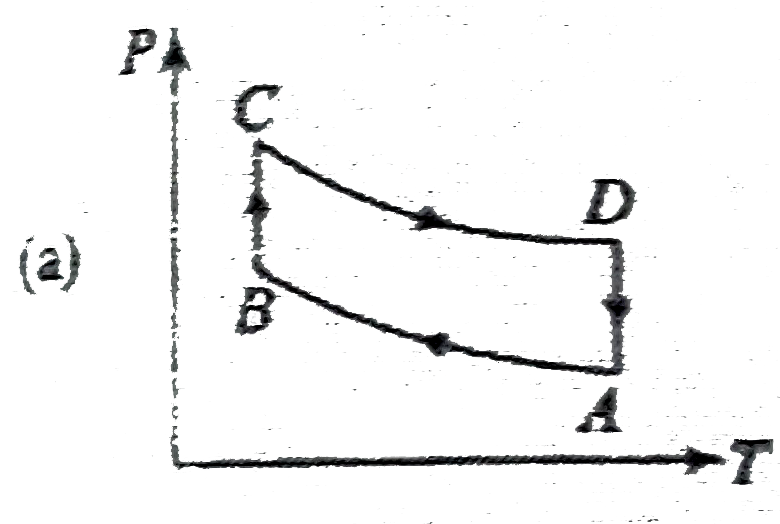 B
B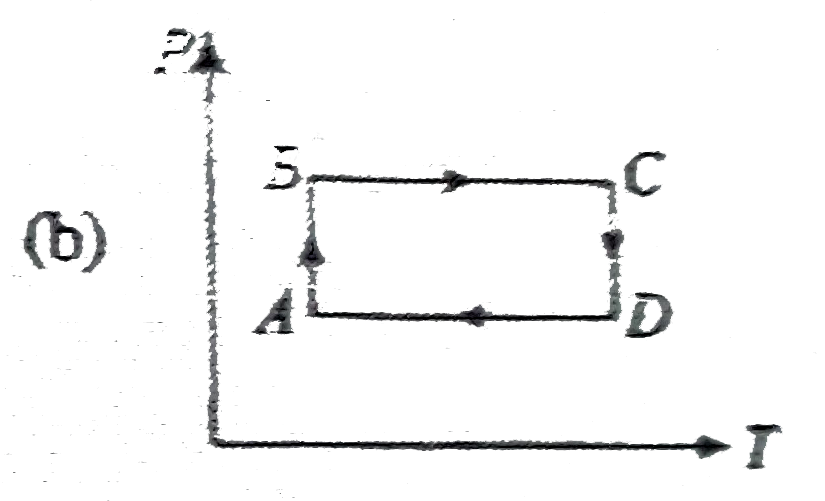 C
C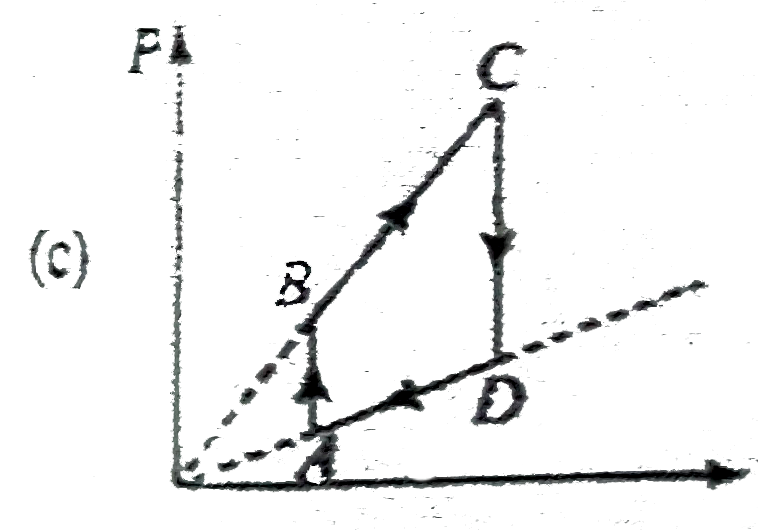 D
D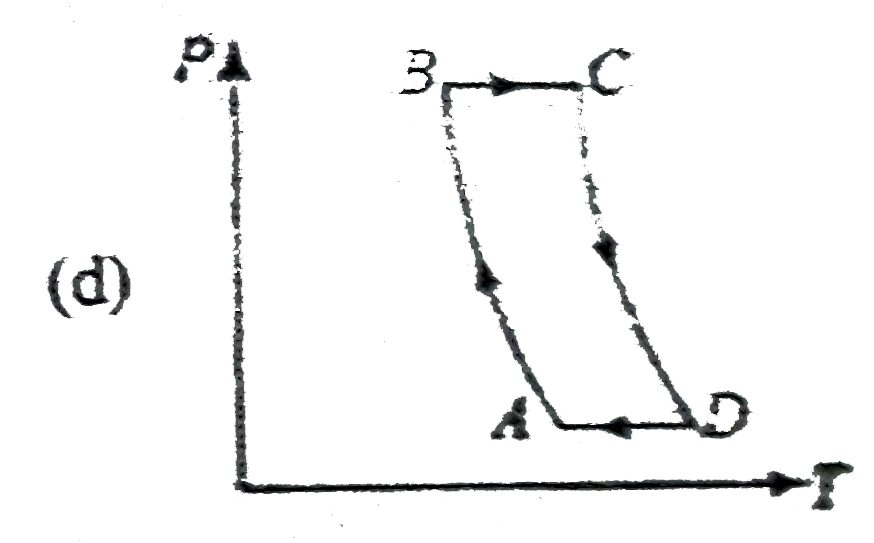
The variation of pressure with volume of the gas at different temperatures can be graphically represented as shown in figure. On the basis of this graph answer the following questions.
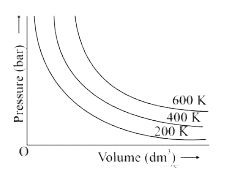
How will the volume of a gas change if its pressure is increased at constant temperature?
View SolutionA graph is plotted between pressure and volume at different temperature. On the basis of the graph what changes will you observe in the volume if
(i) the pressure is increased at constant temperature
(ii) the temperature is decreased at constant pressure
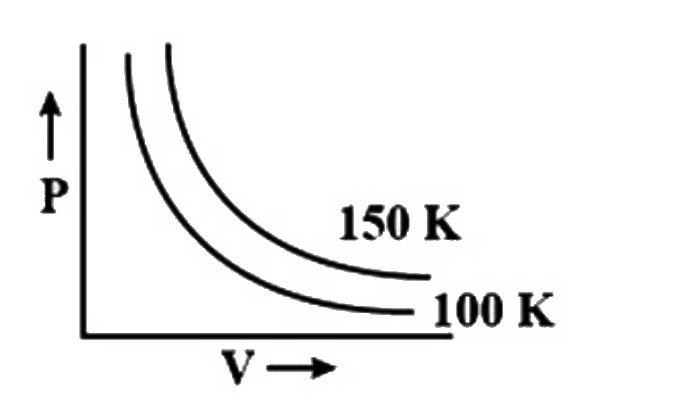
View SolutionAssertion : The pressure of a gas is inversely proportional to the volume at contant temperature and n
Reason : The gas volume is directly proportional to n at constant temperature and pressure
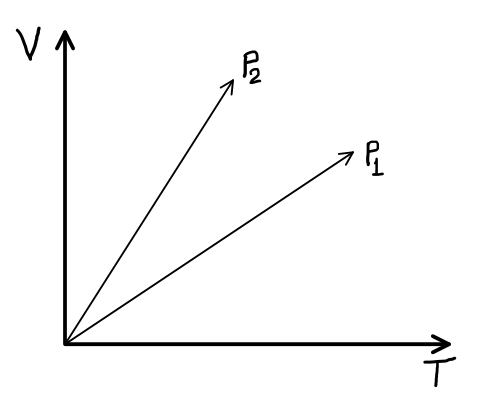
View SolutionFigure shows the volume versus temperature graph for the same mass of a gas (assumed ideal) corresponding to two different pressure P1andP2. Then
View SolutionWhich of the following will occupy greater volume under the similar conditions of pressure and temperature?
View Solution

