State the nature of the graph drawn between volume and temperature at constant pressure. When the graph is extrapolated, at what temperature it meet the temperature axis ?
Text Solution
A graph is a straight line, when a graph is extra polated it meets temperature axis at −273∘C, this indicates that at constant pressure. The volume of given mass of gas reduces to zero at −273∘C.
|
Updated on:21/07/2023
Topper's Solved these Questions
- BOOK - AAKASH SERIESCHAPTER - EXPANSION OF GASESEXERCISE - NUMERICAL EXERCISE LEVEL - 110videos
EXPANSION OF GASES
- BOOK - AAKASH SERIESCHAPTER - EXPANSION OF GASESEXERCISE - NUMERICAL EXERCISE LEVEL - 213videos
EXPANSION OF GASES
- BOOK - AAKASH SERIESCHAPTER - EXPANSION OF GASESEXERCISE - TEST YOUR SELF6videos
EXPANSION OF GASES
- BOOK - AAKASH SERIESCHAPTER - ELEMENTS OF VECTORS EXERCISE - QUESTIONS FOR DESCRIPTIVE ANSWER10videos
ELEMENTS OF VECTORS
- BOOK - AAKASH SERIESCHAPTER - EXPANSION OF LIQUIDS EXERCISE - QUESTIONS FOR DESCRIPTIVE ANSWERS4videos
EXPANSION OF LIQUIDS
Similar Questions
Knowledge Check
- Question 1 - Select One
Graph between p and V at constant temperature is
AstraightBcurved increasingCstraight line with slopeDnone of these - Question 2 - Select One
Graph between p and V at constant temperature is
AstraightBcurved increasingCstraight line with slopeDparabolic curve decreasing
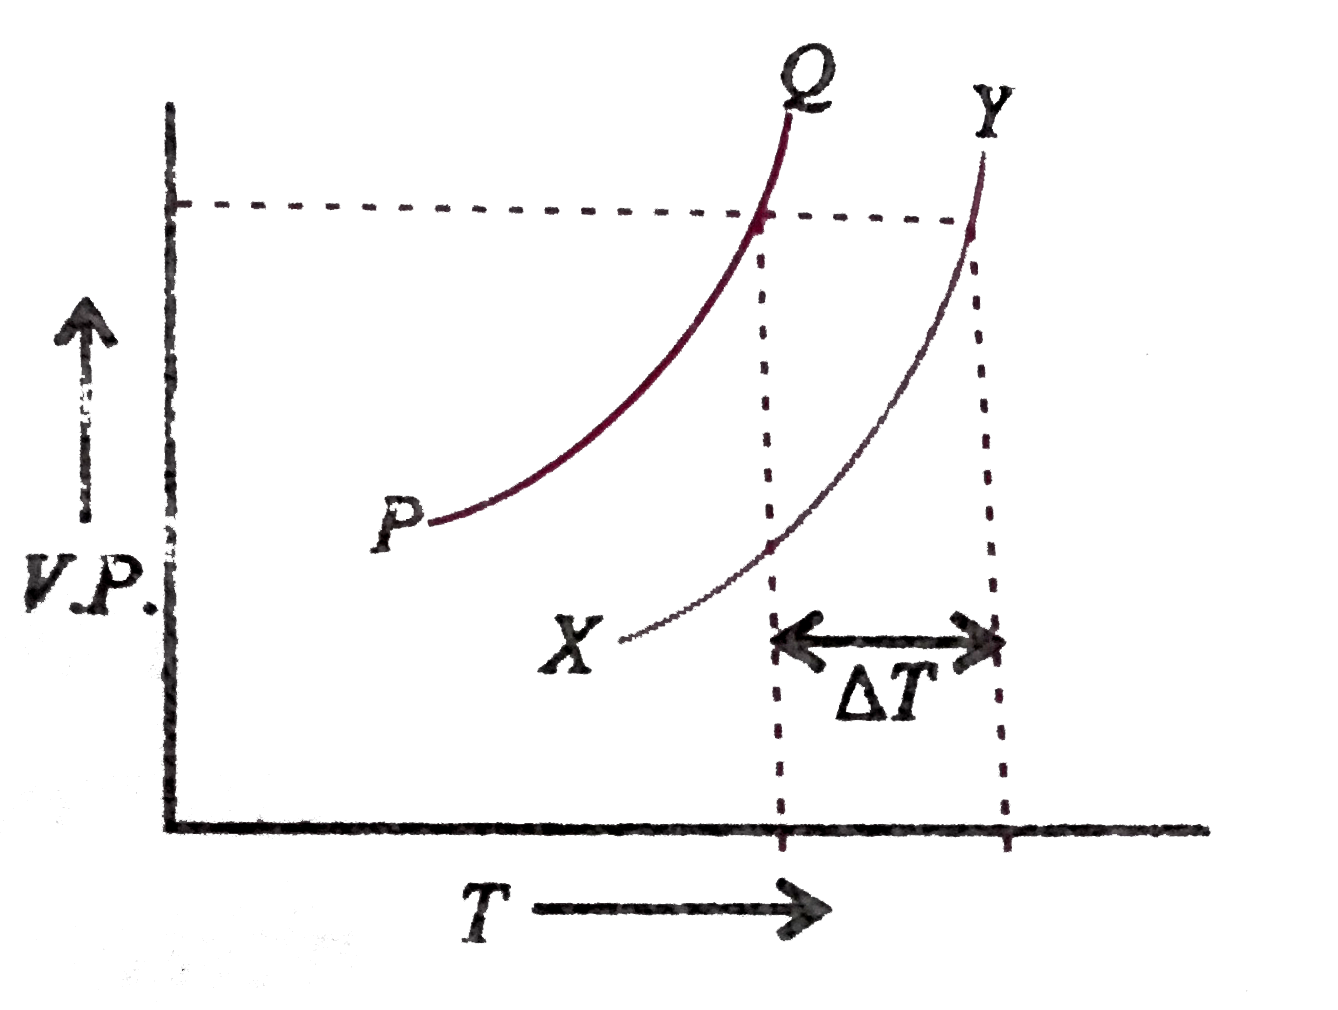
In the graph plotted between vapour pressure (V.P.) and temperature (T),
 View Solution
In the graph plotted between vapour pressure (V.P.) and temperature (T),
 View Solution
What is the type of graph between log P and log V at constant temperature?
View SolutionWhat is the type of graph between log P and log V at constant temperature?
View SolutionThe graph pressure versus temperature (T) at constant volume is a straight line.(T/F)
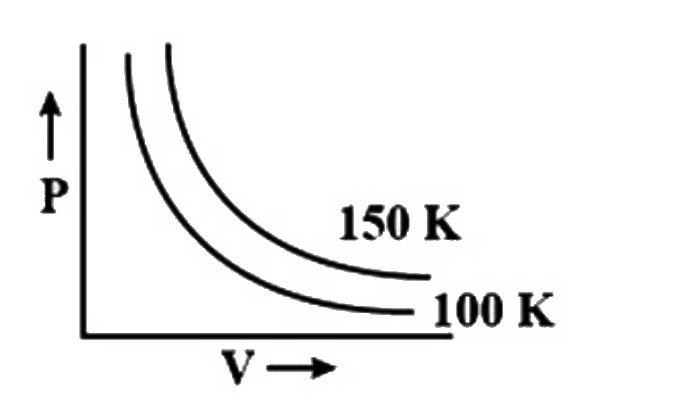
View SolutionA graph is plotted between pressure and volume at different temperature. On the basis of the graph what changes will you observe in the volume if
(i) the pressure is increased at constant temperature
(ii) the temperature is decreased at constant pressure
 View Solution
