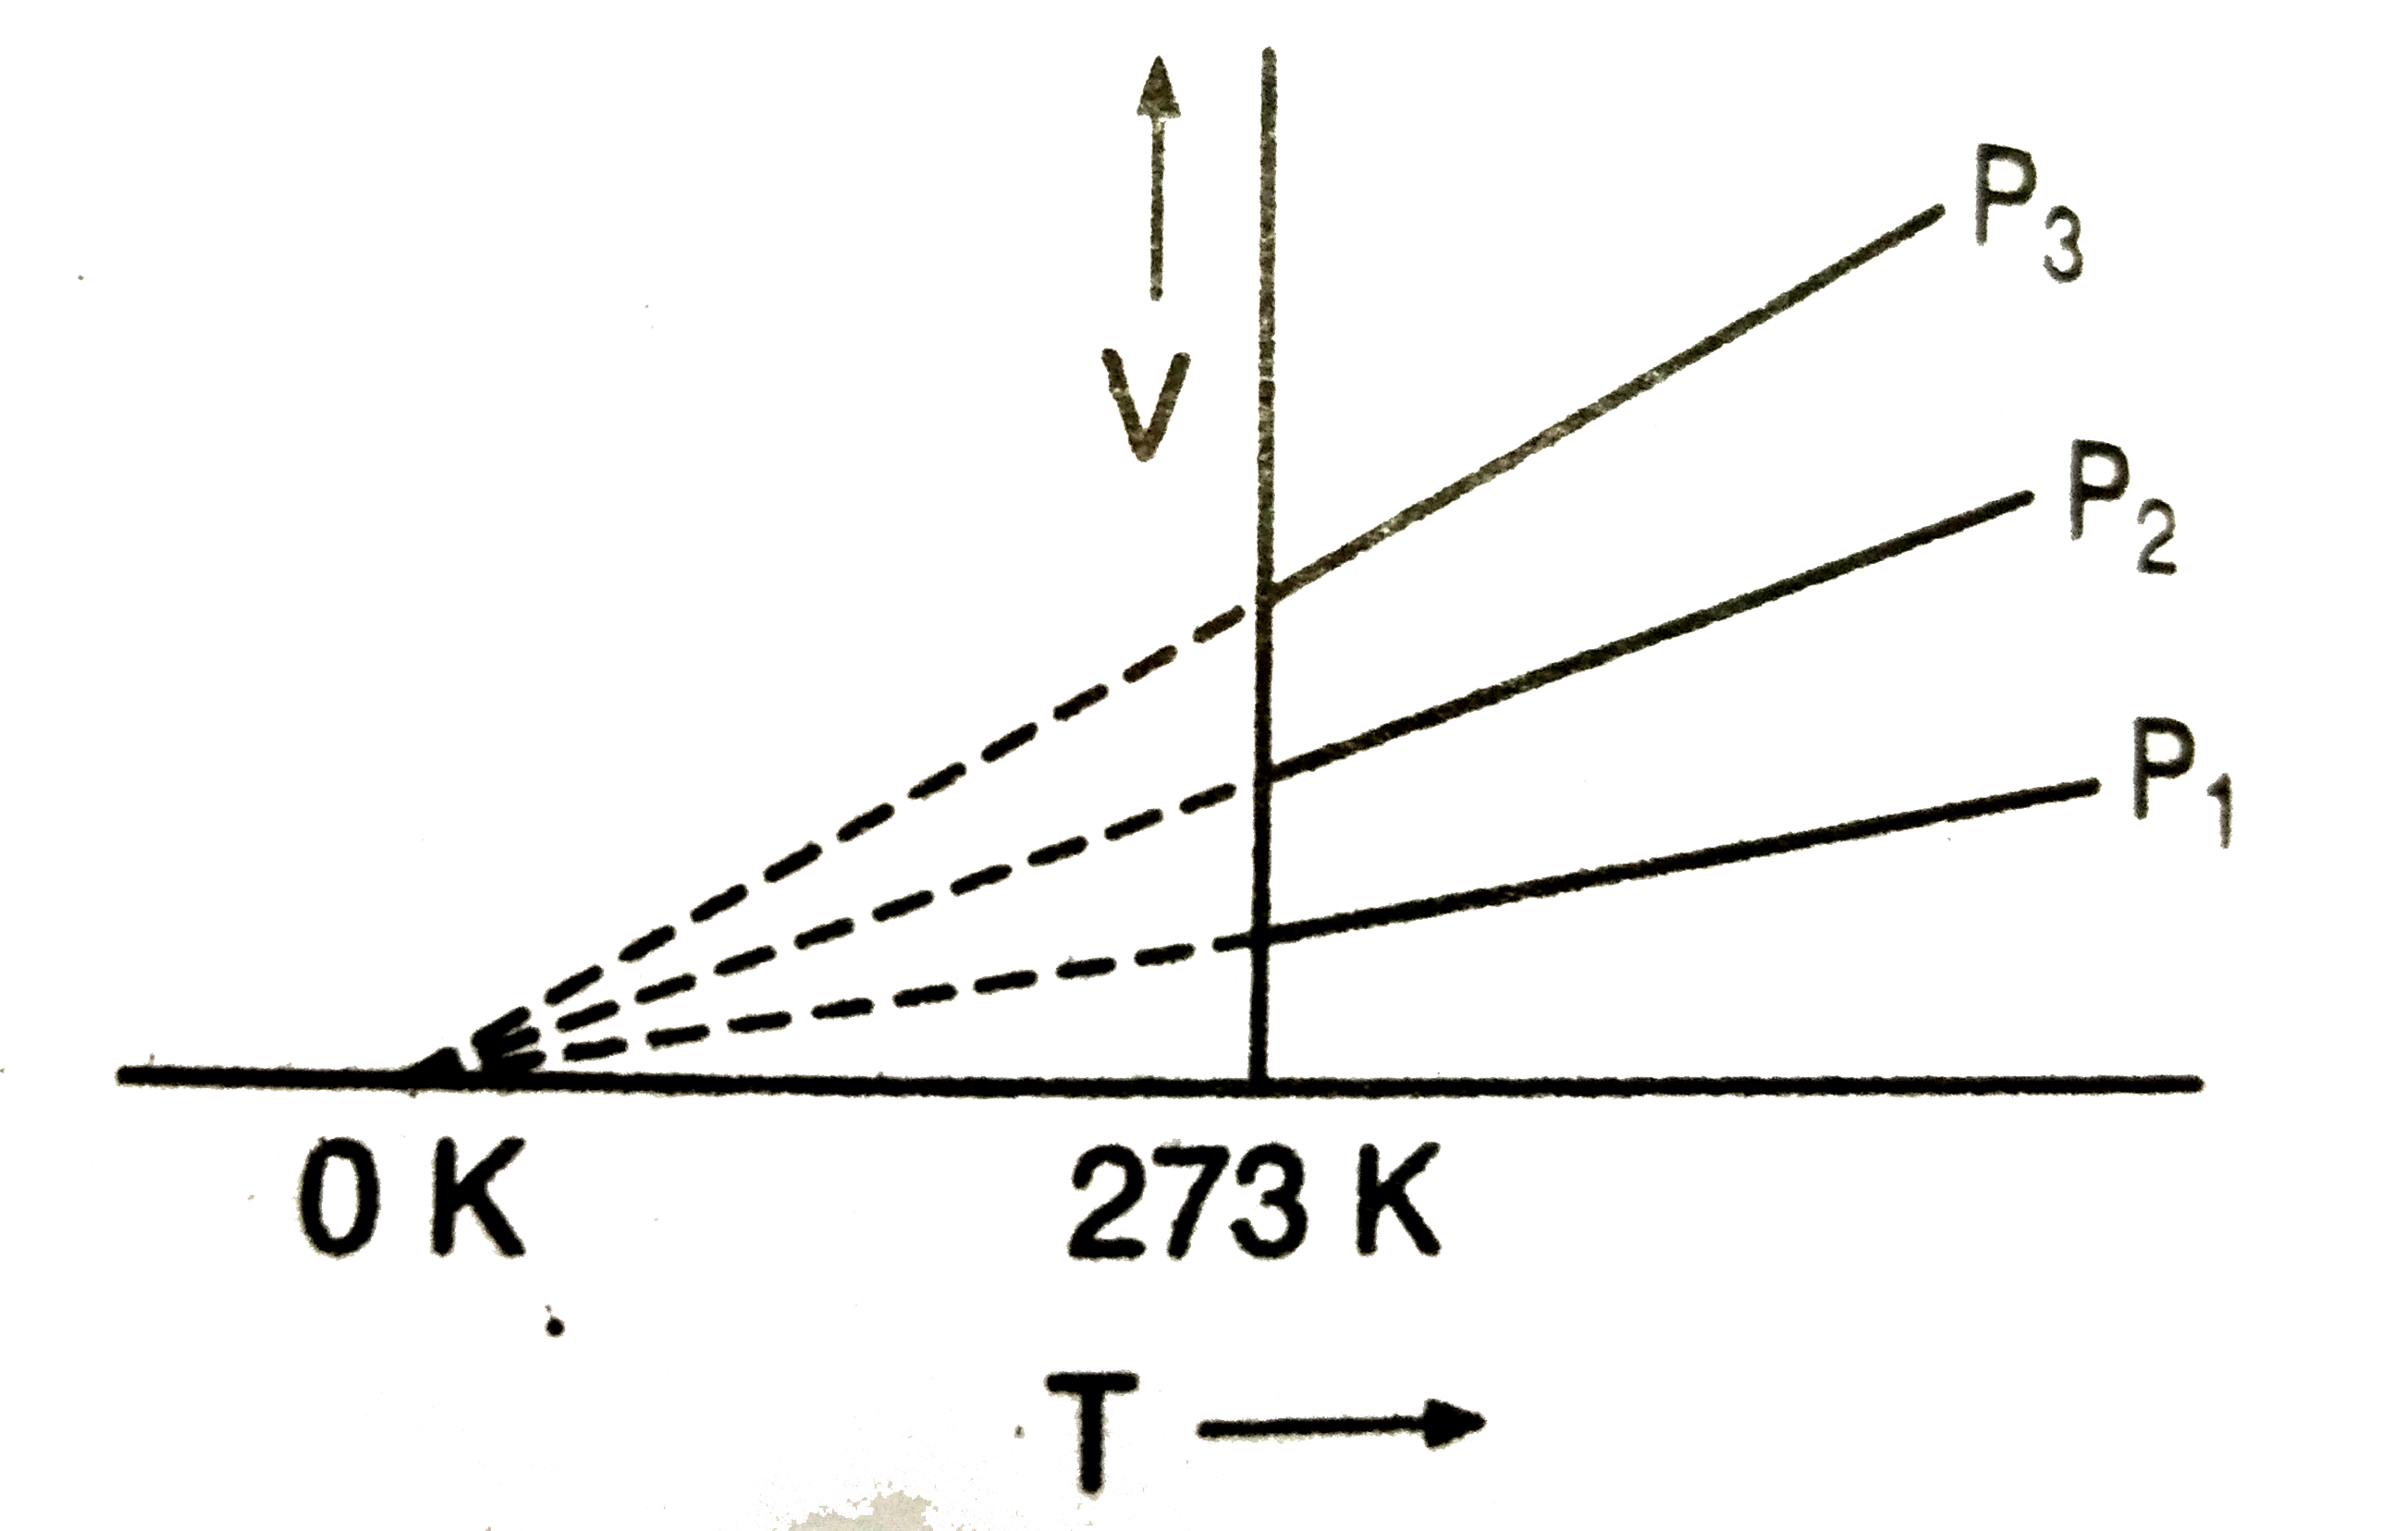
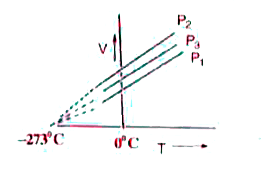
Draw a graph showing the relationship between volume and temperature of an ideal gas at a constant pressure. Solution in Malayalam
Step by step video & image solution for Draw a graph showing the relationship between volume and temperature of an ideal gas at a constant pressure. by Chemistry experts to help you in doubts & scoring excellent marks in Class 11 exams.
Updated on:21/07/2023Topper's Solved these Questions
- STATES OF MATTERBOOK - MAXIMUM PUBLICATIONCHAPTER - STATES OF MATTEREXERCISE - EXERCISE
34 Videos
- SOME BASIC CONCEPTS OF CHEMISTRYBOOK - MAXIMUM PUBLICATIONCHAPTER - SOME BASIC CONCEPTS OF CHEMISTRYEXERCISE - EXAMPLE
117 Videos
- STRUCTURE OF ATOMBOOK - MAXIMUM PUBLICATIONCHAPTER - STRUCTURE OF ATOMEXERCISE - EXERCISE
71 Videos
Similar Questions
What will be the minimum pressure required to compress 500 dm3 of air at 1 Bar to 200 dm3 at 30°C ?
View SolutionWhich of the following is a mixture?
View SolutionCalculate the number of electrons which will together weigh one gram.
View SolutionThe volume-temperature graphs of a given mass of an ideal gas at constant pressure are shown below. What is the correct order of pressure ?

View Solutionकिसी गैस के दाब, आयतन और ताप में संबंध स्थापित करें।
View SolutionWhich of the following shows the correct relationship between the perssure and density of an ideal gas constant temperature ?
View SolutionWhich of the following shows the correct relationship between the pressure and density of an ideal gas at constant temperature ?
View SolutionWhich of the following shows the correct relationship between the pressure and density of an ideal gas at constant temperature ?
View SolutionThe volume-temperature graphs of a given mass of an ideal gas at constant pressures are shown below. What is the correct order of pressures?

View SolutionTwo different at constant. The relationship between volume V and the pressure P at a given temperature of same ideal gas are shown for masses m_1 and m_2 of the gas respectively. Then
View SolutionIn the Celcius scale, melting point of ice is 0^@C . Another scale of temperature is based on absolute zero. Draw a graph showing the relationship between volume and temperature of an ideal gas at a constant pressure.
View SolutionGas laws are relationship between the measurable properties of gases. Draw the graph to illustrate the relationship between temperature and pressure of a fixed amount of gas at constant volume.
View SolutionThe relationship between volume and number of molecules of a gas at constant temperature and pressure is known as ........
View SolutionFor a certain mas of the gas at constant temperature draw a graph between the volume against the corresponding pressure i.e. V vs P.
View SolutionWhat is the relationship between absolute temperature and volume of gas at constant mass and pressure?
View Solution