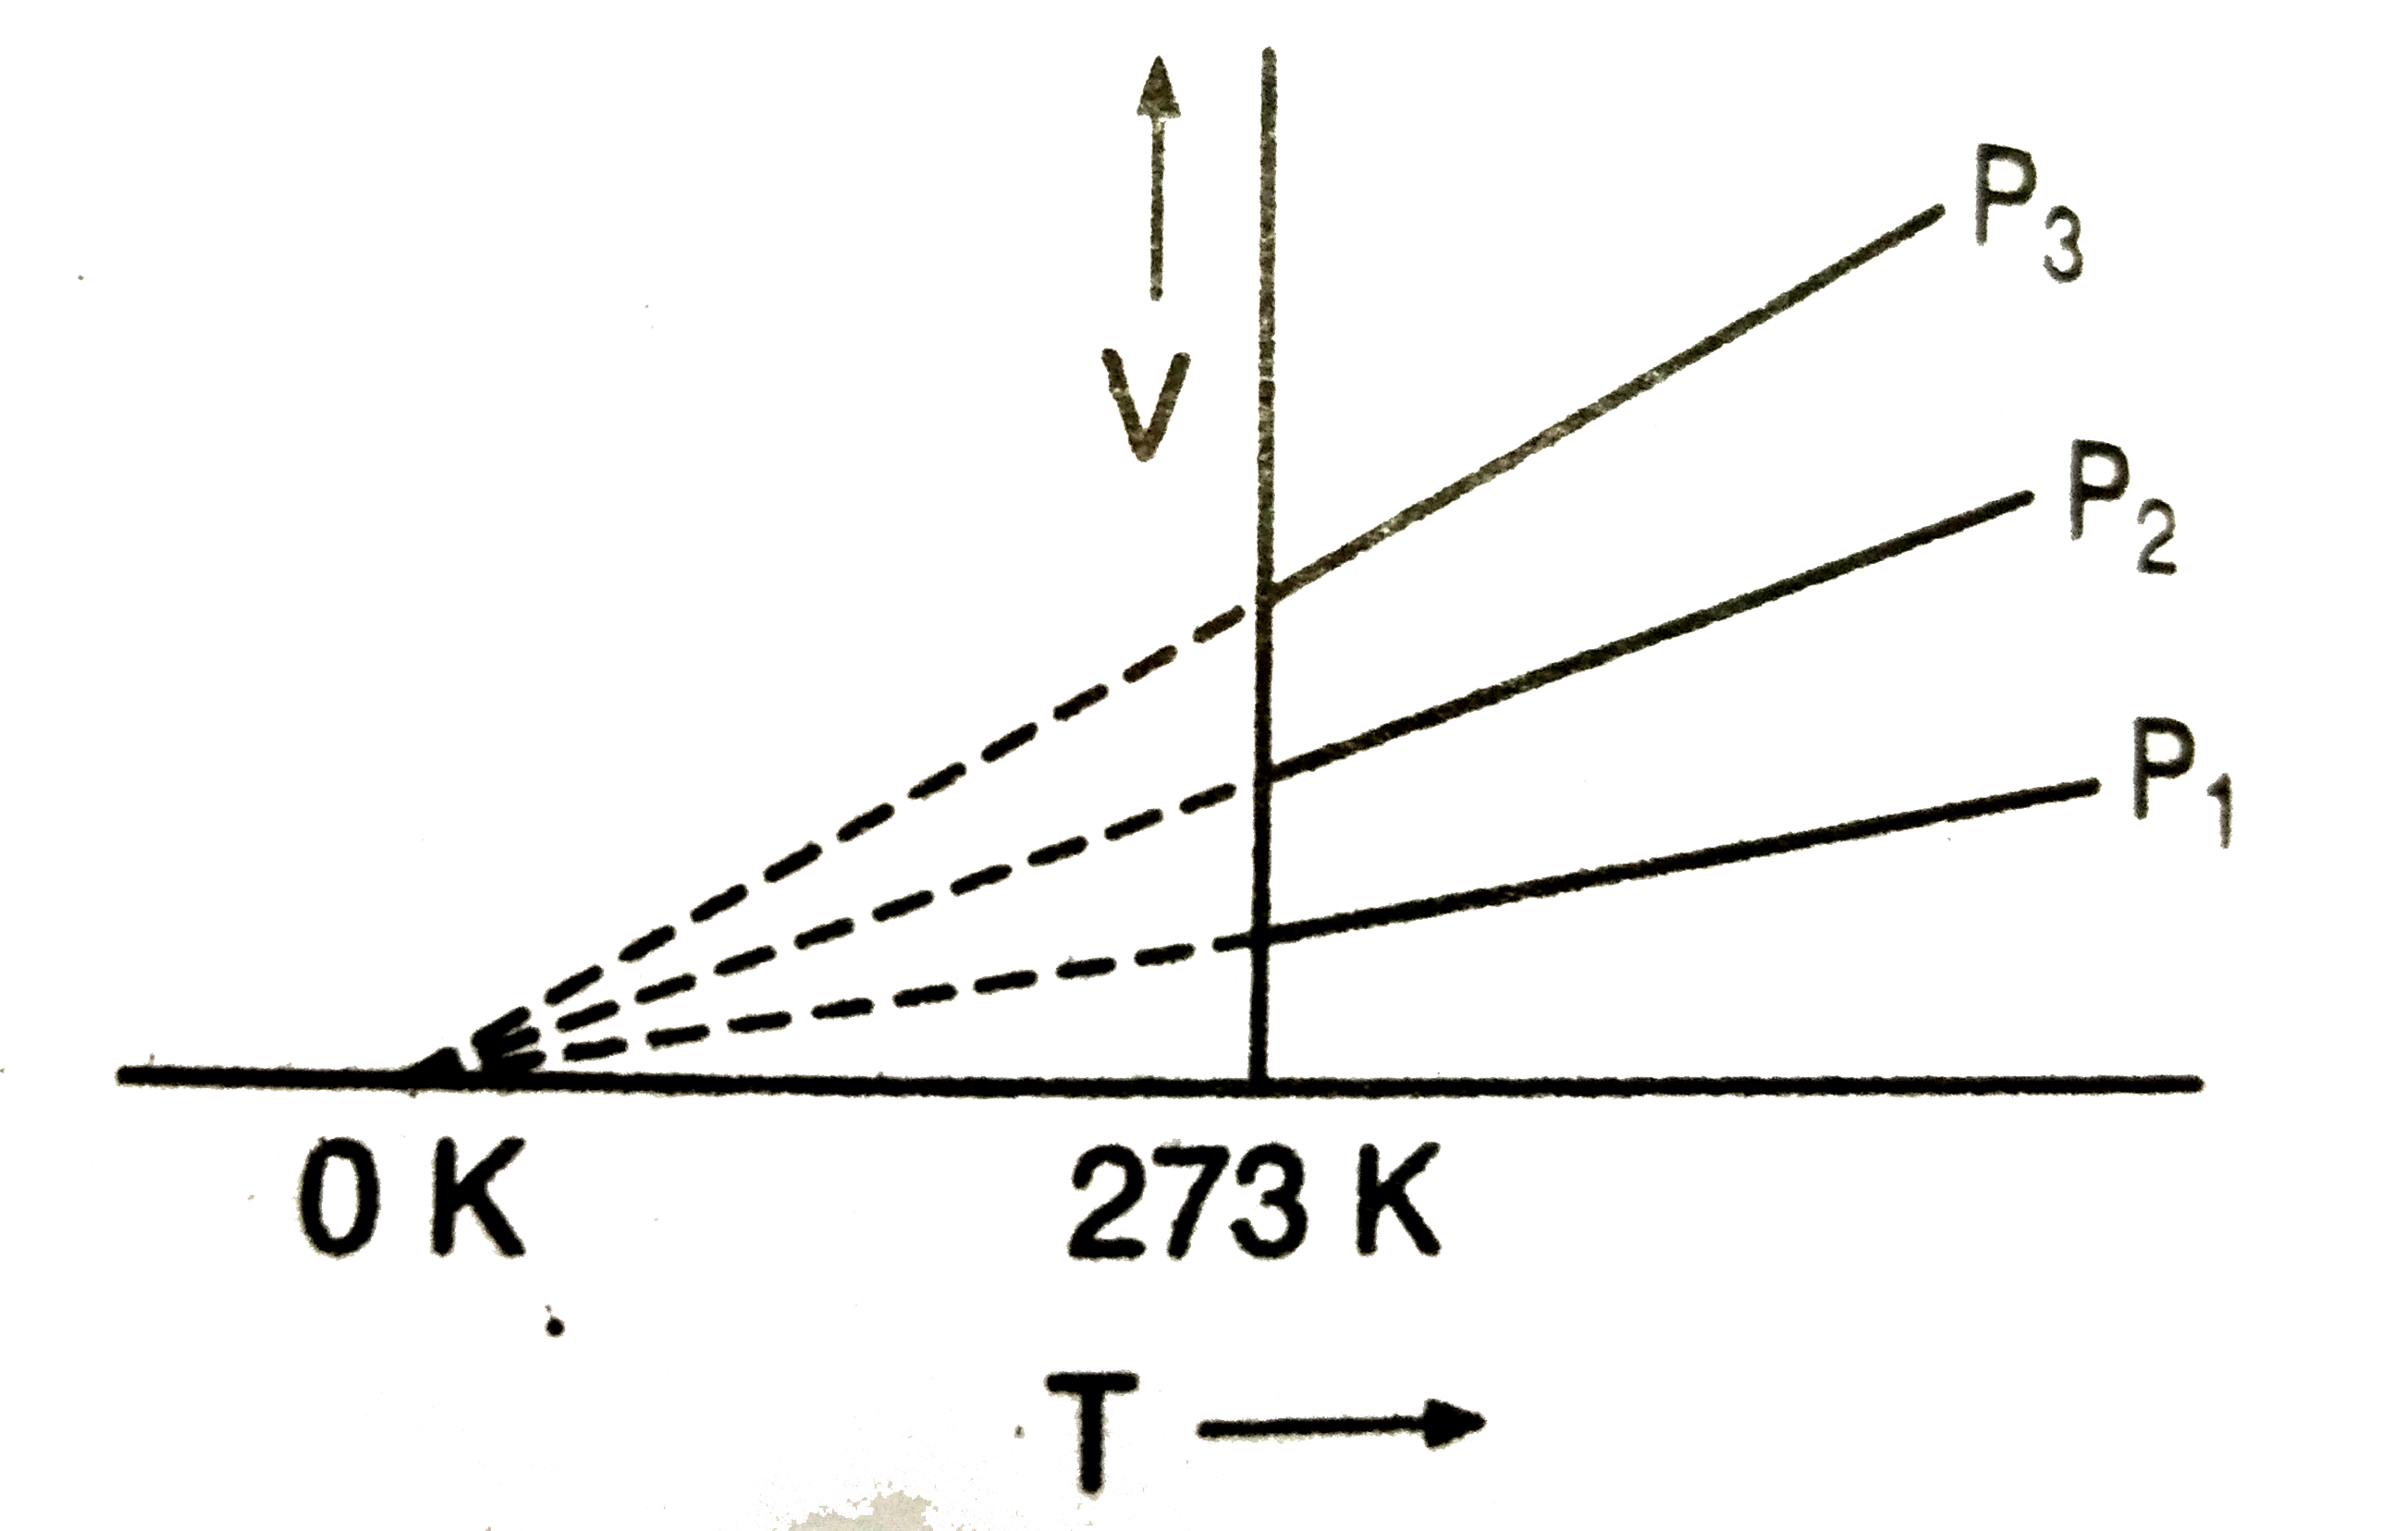
The volume-temperature graphs of a given mass of an ideal gas at constant pressure are shown below. What is the correct order of pressure ?

P3>P2>P1
P1>P2>P3
P2>P3>P1
P2>P1>P3
The correct Answer is:A
Step by step video & image solution for The volume-temperature graphs of a given mass of an ideal gas at constant pressure are shown below. What is the correct order of pressure ? by Chemistry experts to help you in doubts & scoring excellent marks in Class 12 exams.
Updated on:21/07/2023Topper's Solved these Questions
- STATES OF MATTERBOOK - VMC MODULES ENGLISHCHAPTER - STATES OF MATTEREXERCISE - EFFICIENT
45 Videos
- SOME BASIC CONCEPTS OF CHEMISTRYBOOK - VMC MODULES ENGLISHCHAPTER - SOME BASIC CONCEPTS OF CHEMISTRYEXERCISE - IN - CHAPTER EXERCISE - H
8 Videos
- STATES OF MATTERBOOK - VMC MODULES ENGLISHCHAPTER - STATES OF MATTEREXERCISE - IN-CHAPTER EXERCISE-I
10 Videos
Similar Questions
Knowledge Check
At constant temperature, in a given mass of an ideal gas
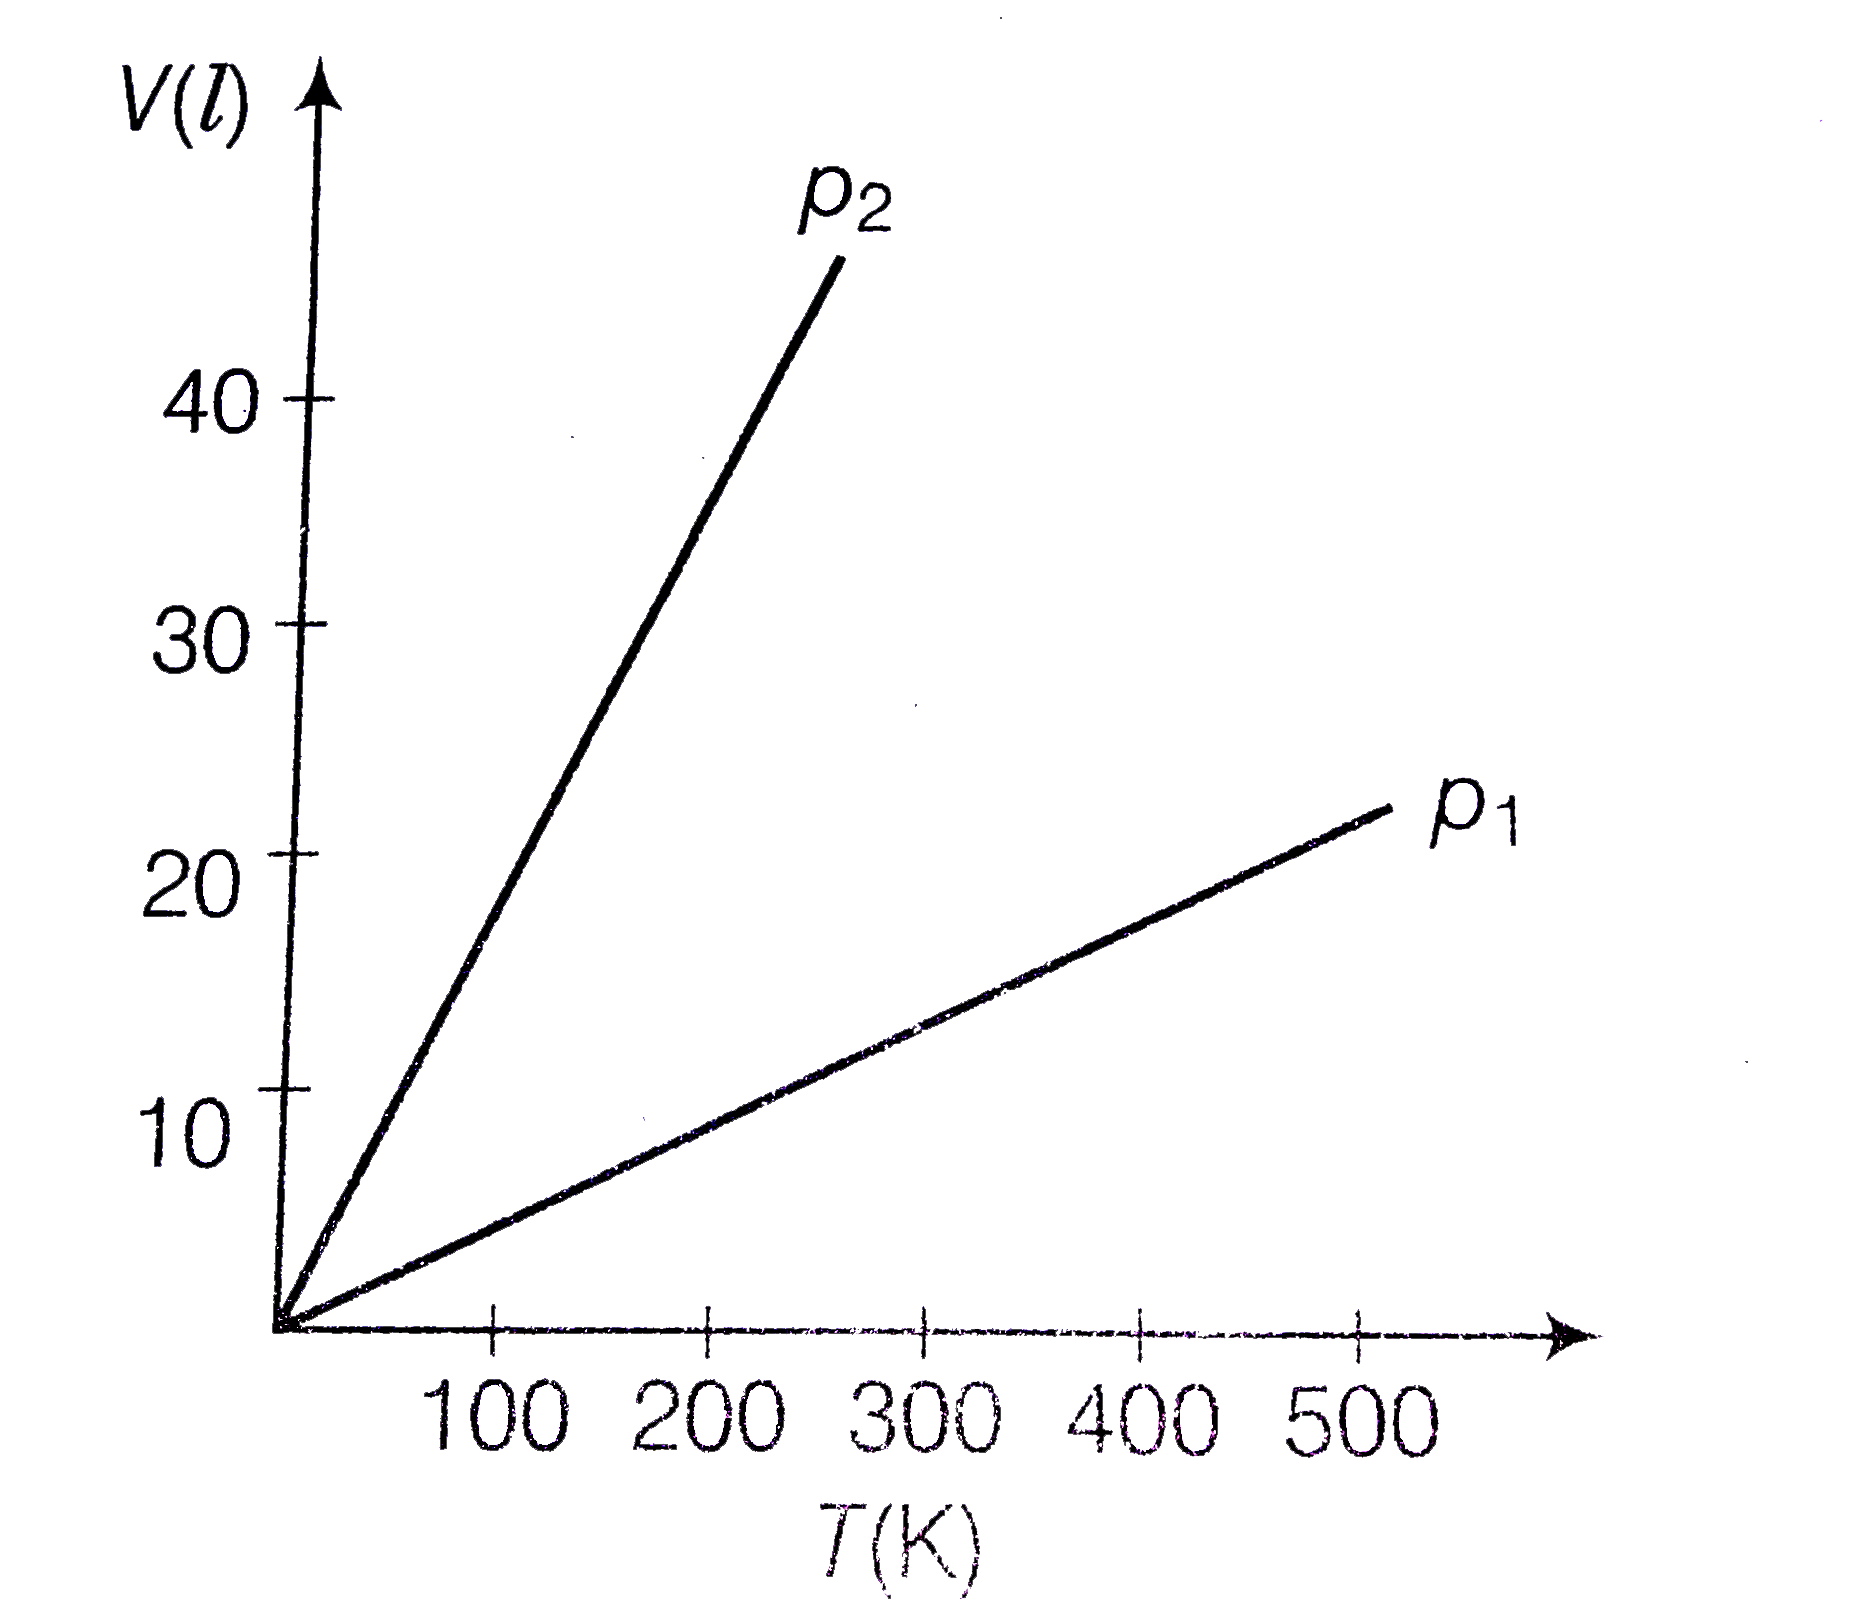
Athe ratio of pressure and volume always remains constantBvolume always remains constantCpressure always remains constantDthe product of pressure and volume always remains constant.Volume versus temperature graphs for a given mass of an ideal gas are shown in figure. At two different values of constant pressure. What can be inferred about relation between P1 and P2 ?
 AP1>P2BP1=P2CP1<P2Ddata is insufficient
Volume versus temperature graphs for a given mass of an ideal gas are shown in figure. At two different values of constant pressure. What can be inferred about relation between P1 and P2 ?

View SolutionVolume versus temperature graphs for a given mass of an ideal gas are shown in figure. At two different values of constant pressure. What can be inferred about relation between P1 and P2 ?

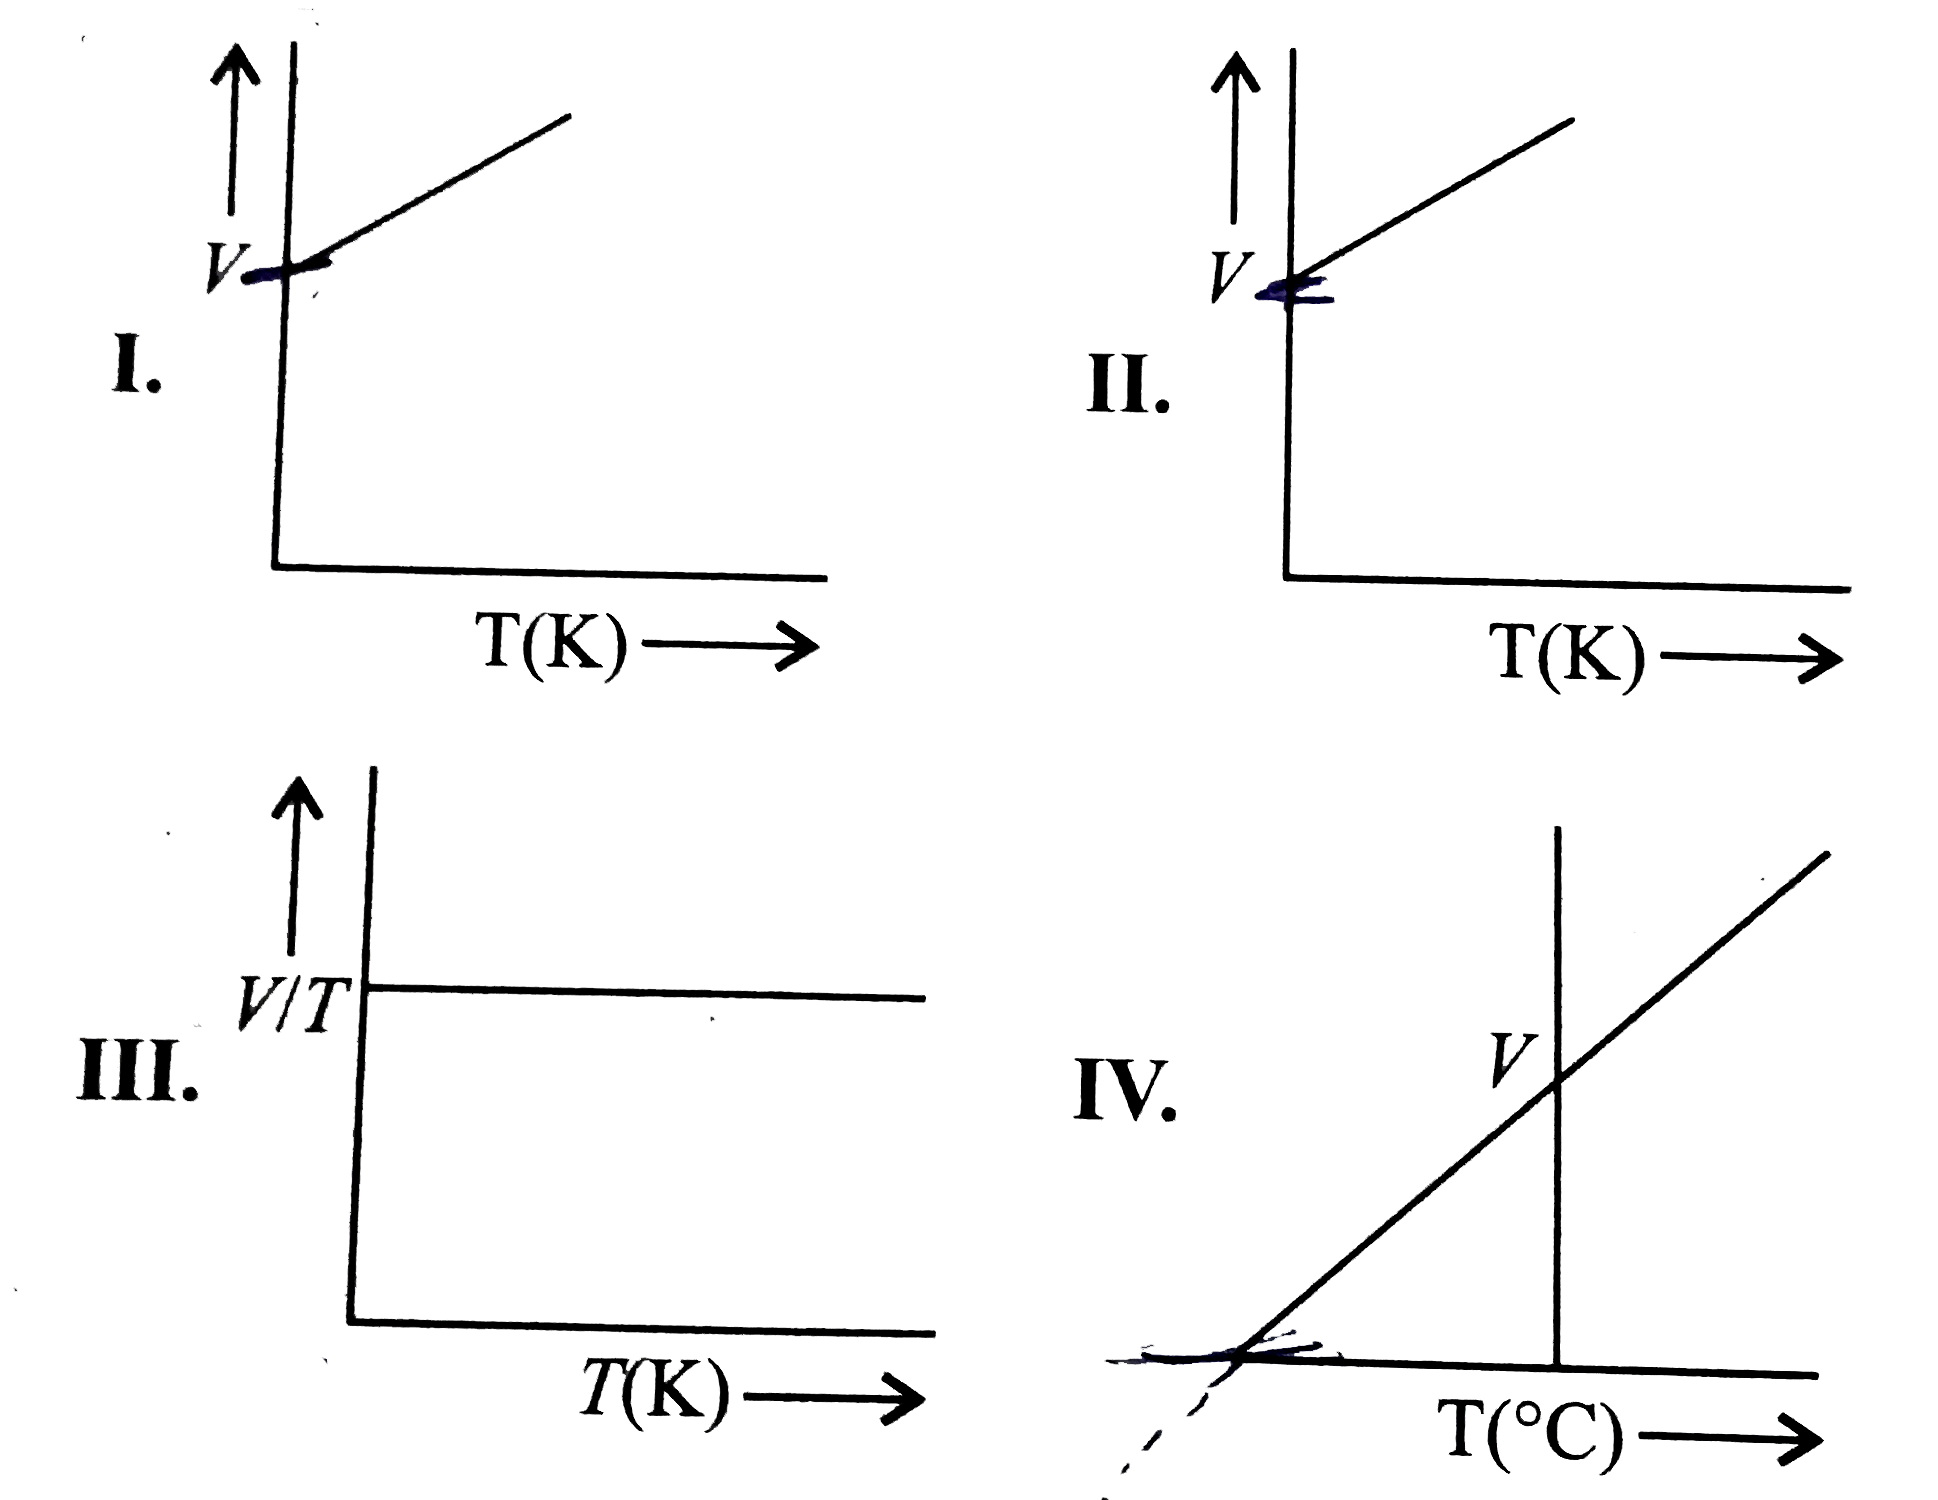
View SolutionFor a fixed mass of gas and constant pressure, which of the following graphs is / are correct?

View SolutionAt what temperature would the volume of a given mass of a gas at constant pressure be twice its volume at 0∘C
View SolutionFigure shows volume - temperature (V-T) graph for same mass of an ideal gas at two different pressures P1and P2. Hence
View SolutionIf the volume of a given mass of a gas at constant temperature becomes three times, the pressure will be
View Solution