एक फैक्टरी में 30 श्रमिकों के मासिक पारिश्रमिक नीचे दिया जा रहा है : -
830, 835, 890, 810, 835, 836, 869, 845, 898, 890, 820, 860, 832, 833, 855, 845, 804, 808, 812, 840, 885, 835, 836, 878, 840, 868, 890, 806, 840, 890.
इन आँकड़ों 10 को वर्ग -अमाप के बरम्बारता सारणी के रूप में व्यक्त करे।
The correct Answer is:94 रु.
Step by step video, text & image solution for एक फैक्टरी में 30 श्रमिकों के मासिक पारिश्रमिक नीचे दिया जा रहा है : - 830, 835, 890, 810, 835, 836, 869, 845, 898, 890, 820, 860, 832, 833, 855, 845, 804, 808, 812, 840, 885, 835, 836, 878, 840, 868, 890, 806, 840, 890. इन आँकड़ों 10 को वर्ग -अमाप के बरम्बारता सारणी के रूप में व्यक्त करे। by Maths experts to help you in doubts & scoring excellent marks in Class 9 exams.
Topper's Solved these Questions
- BOOK - S CHANDCHAPTER - सांख्यिकी EXERCISE - प्रश्नावली 31.118videos
सांख्यिकी
- BOOK - S CHANDCHAPTER - सांख्यिकी EXERCISE - प्रश्नावली 31.26videos
सांख्यिकी
- BOOK - S CHANDCHAPTER - सम्बन्धित कोण EXERCISE - प्रश्नावली 17.328videos
सम्बन्धित कोण
- BOOK - S CHANDCHAPTER - सांख्यिकी आकड़ों का आलेखी निरूपण EXERCISE - अभ्यास 32.216videos
सांख्यिकी आकड़ों का आलेखी निरूपण
Similar Questions
सांख्यिकी के अर्थ एवं इसके कार्यक्षेत्र का वर्णन करें।
06:07View Solutionसंचयी बारम्बारता बन्टन का उल्लेख करें।
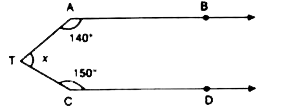
04:03View Solutionआकृति में, AB∣∣CD हो, तो x का मान ज्ञात कीजिए
 00:52View Solution
एक धातु की गेंद को गर्म कर विभिन्न अंतरालों पर उसका तापमान ज्ञात किया , जैसा कि सरणी में दिखाया गया है :-

समय - ताप ग्राफ खींचिए और निम्न प्रश्नों का उत्तर दीजिए :-
समय t = 5 सेकंड पर गेंद का तापमान क्या है ?06:54View Solutionएक फैक्ट्री के 20 श्रमिकों की मासिक मजदूरी नीचे दी गयी है:
830, 835, 890, 810, 835, 836, 869, 845, 898, 890, 820, 860, 832, 833, 855,804, 808, 812, 840, 885, .
वर्ग माप 10 लेकर इन आँकड़ों को एक बारम्बारता बंटन सारणी के रूप में प्रस्तुत कीजिये।05:36View SolutionThe weekly wages (in Rs) of 30 workers in a factory are.830, 835, 890, 810, 835, 836, 869, 845, 898, 890, 820, 860, 832, 833, 855, 845, 804, 808, 812, 840, 885, 835, 835, 836, 878, 840, 868, 890, 806, 840Using tally marks make a frequency table with intervals as 800–810, 810–820 and so on.
03:30View SolutionFind the missing numbers.
885, 870, 855, 840, …01:31View SolutionDraw a histogram for the wages of 30 workers in a company.The wages are as follows: 830, 840, 868, 890, 806, 840, 835, 890,840, 885, 835, 835, 836, 878, 810, 835, 836, 869, 845, 855, 845, 804, 808, 860, 832, 833, 812, 898, 890, 820.
02:43View SolutionThe weekly wages of 30 workers in a factory are. 830, 835, 890, 810, 835, 836, 869, 845, 898, 890, 820, 860, 832, 833, 855, 845, 804, 808, 812, 840, 885, 835, 835, 836, 878, 840, 868, 890, 806, 840 Using tally marks make a frequency table with intervals as 800–810, 810–820 and so on
06:25View SolutionOther examples- 890-210
02:01View Solution272 को 3 घात के रूप में व्यक्त कीजिए।
02:03View SolutionState the properties used in the following statements: (567+765)+890=567+(765+890)
02:26View Solutionএকটি কোম্পানির 30 জন শ্রমিকের দৈনিক আয় দেওয়া হলো । পরিসংখ্যা বিভাজন তালিকা তৈরি করো : 830, 835, 890, 810, 835, 836, 869, 845, 898, 890, 820, 860, 832, 833, 855, 845, 804, 808, 812, 840, 885, 835, 836, 878, 840, 868, 890, 806, 840, 890
View SolutionDraw a histogram for the frequency distribution table given in Example 13 and statement of Example 13 is given by as-
The weekly wages (in Rs.) of 30 workers in a factory are 830, 835, 890, 810, 835, 836, 869, 845, 898, 890, 820, 860, 832, 833, 855, 845, 804, 808, 812, 840, 885, 835, 835, 836, 878, 840, 868, 890, 806, 840. Using tally marks, make a frequency distribution table with class intervals 800 – 810, 810 – 820 and so on. Answer the following questions
Which class interval has the maximum number of workers?01:36View SolutionDraw a histogram for the frequency distribution table given in Example 13 and statement of Example 13 is given by as-
The weekly wages (in Rs.) of 30 workers in a factory are 830, 835, 890, 810, 835, 836, 869, 845, 898, 890, 820, 860, 832, 833, 855, 845, 804, 808, 812, 840, 885, 835, 835, 836, 878, 840, 868, 890, 806, 840. Using tally marks, make a frequency distribution table with class intervals 800 – 810, 810 – 820 and so on. Answer the following questions.
How many workers earn Rs. 850 and more?01:38View Solution

