The car starts from rest at x=0 and is subjected to an acceleration shown by the a-s graph . Draw the v-s graph and determine the time needed to travel 60 m.
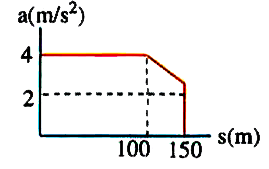
The correct Answer is:5.48s
Topper's Solved these Questions
- MOTION IN A STRAIGHT LINEBOOK - AAKASH SERIESCHAPTER - MOTION IN A STRAIGHT LINEEXERCISE - Questions for Descriptive Answers
7 Videos
- MOTION IN A STRAIGHT LINEBOOK - AAKASH SERIESCHAPTER - MOTION IN A STRAIGHT LINEEXERCISE - EXERCISE (LEVEL 1)
22 Videos
- MOTION IN A PLANE BOOK - AAKASH SERIESCHAPTER - MOTION IN A PLANE EXERCISE - Practice Exercise
84 Videos
- NEWTONS LAWS OF MOTION BOOK - AAKASH SERIESCHAPTER - NEWTONS LAWS OF MOTION EXERCISE - ADDITIONAL PRACTICE EXERCISE PRACTICE SHEET (ADVANECED) (Matrix Matching Type Questions)
1 Videos
Similar Questions
Knowledge Check
A train starts from rest at S=0 and is subjected to an acceleration as shown in figure. Then,
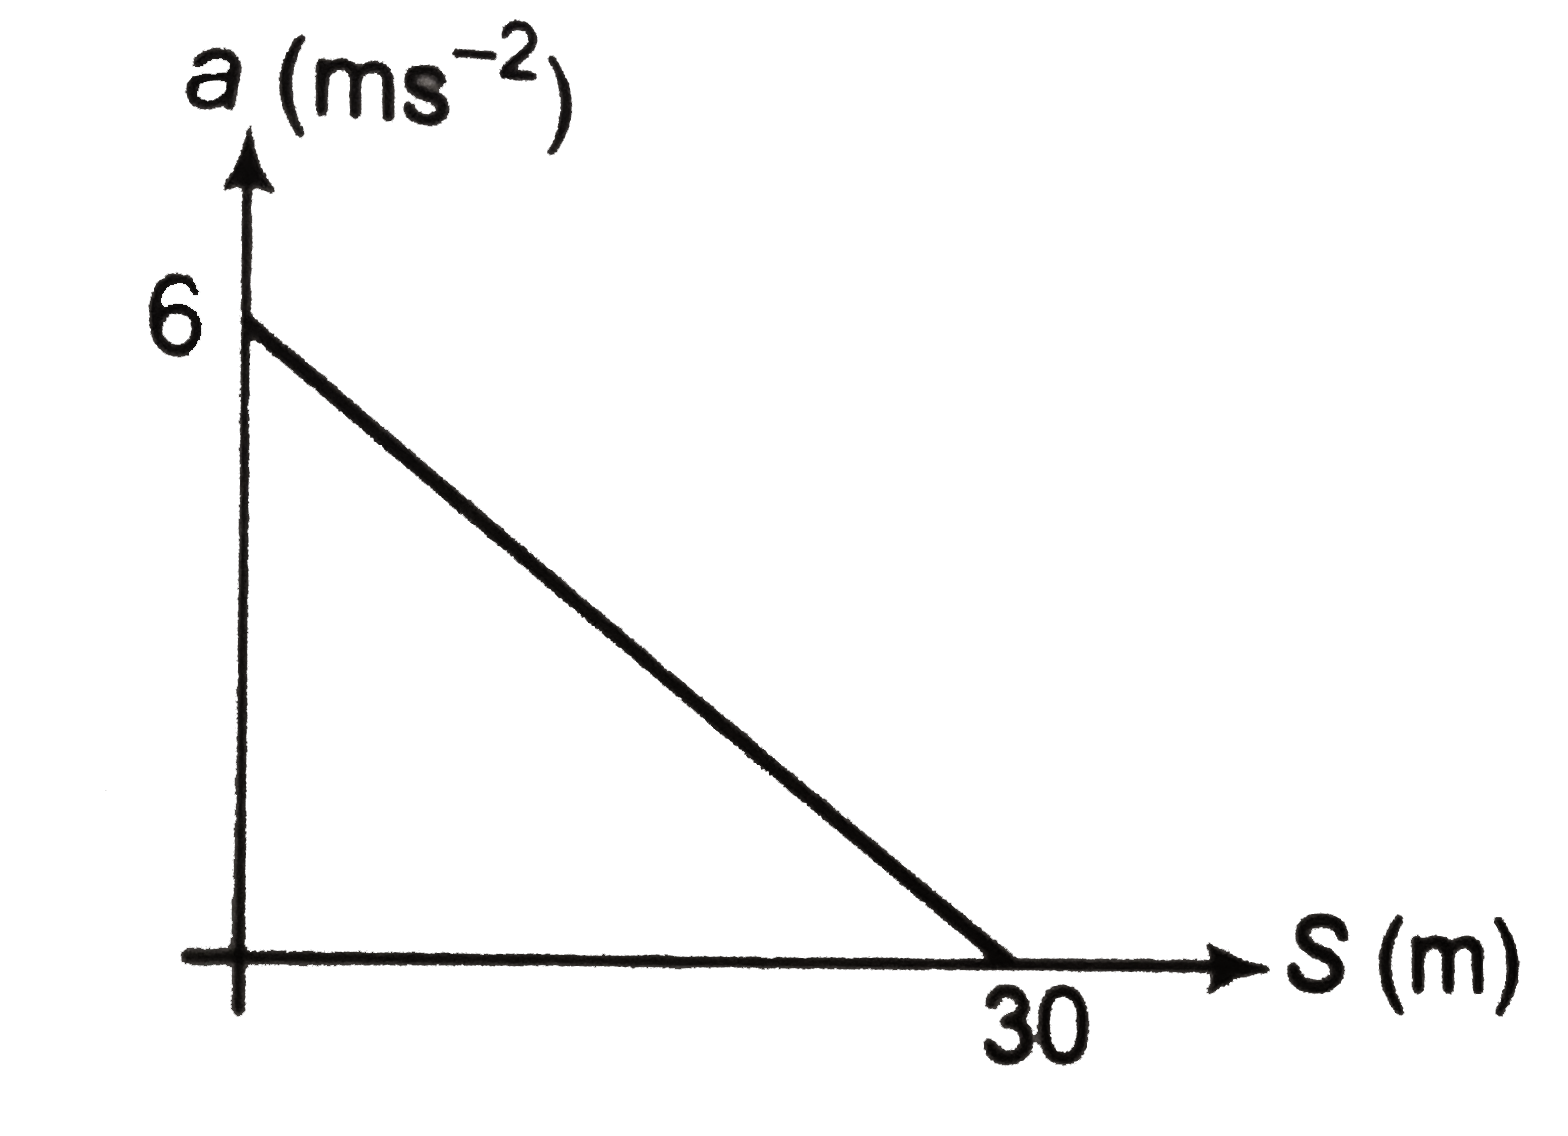 Avelocity at the end of 10 m displacement is 20ms−1Bvelocity of the train at S=10m is 10ms−1CThe maximum velocity attained by train is √180ms−1DThe maximum velocity attained by the train is 15 ms^-1
A particle starts from rest and undergoes an acceleration as shown in figure. The velocity-time graph from figure will have a shape.
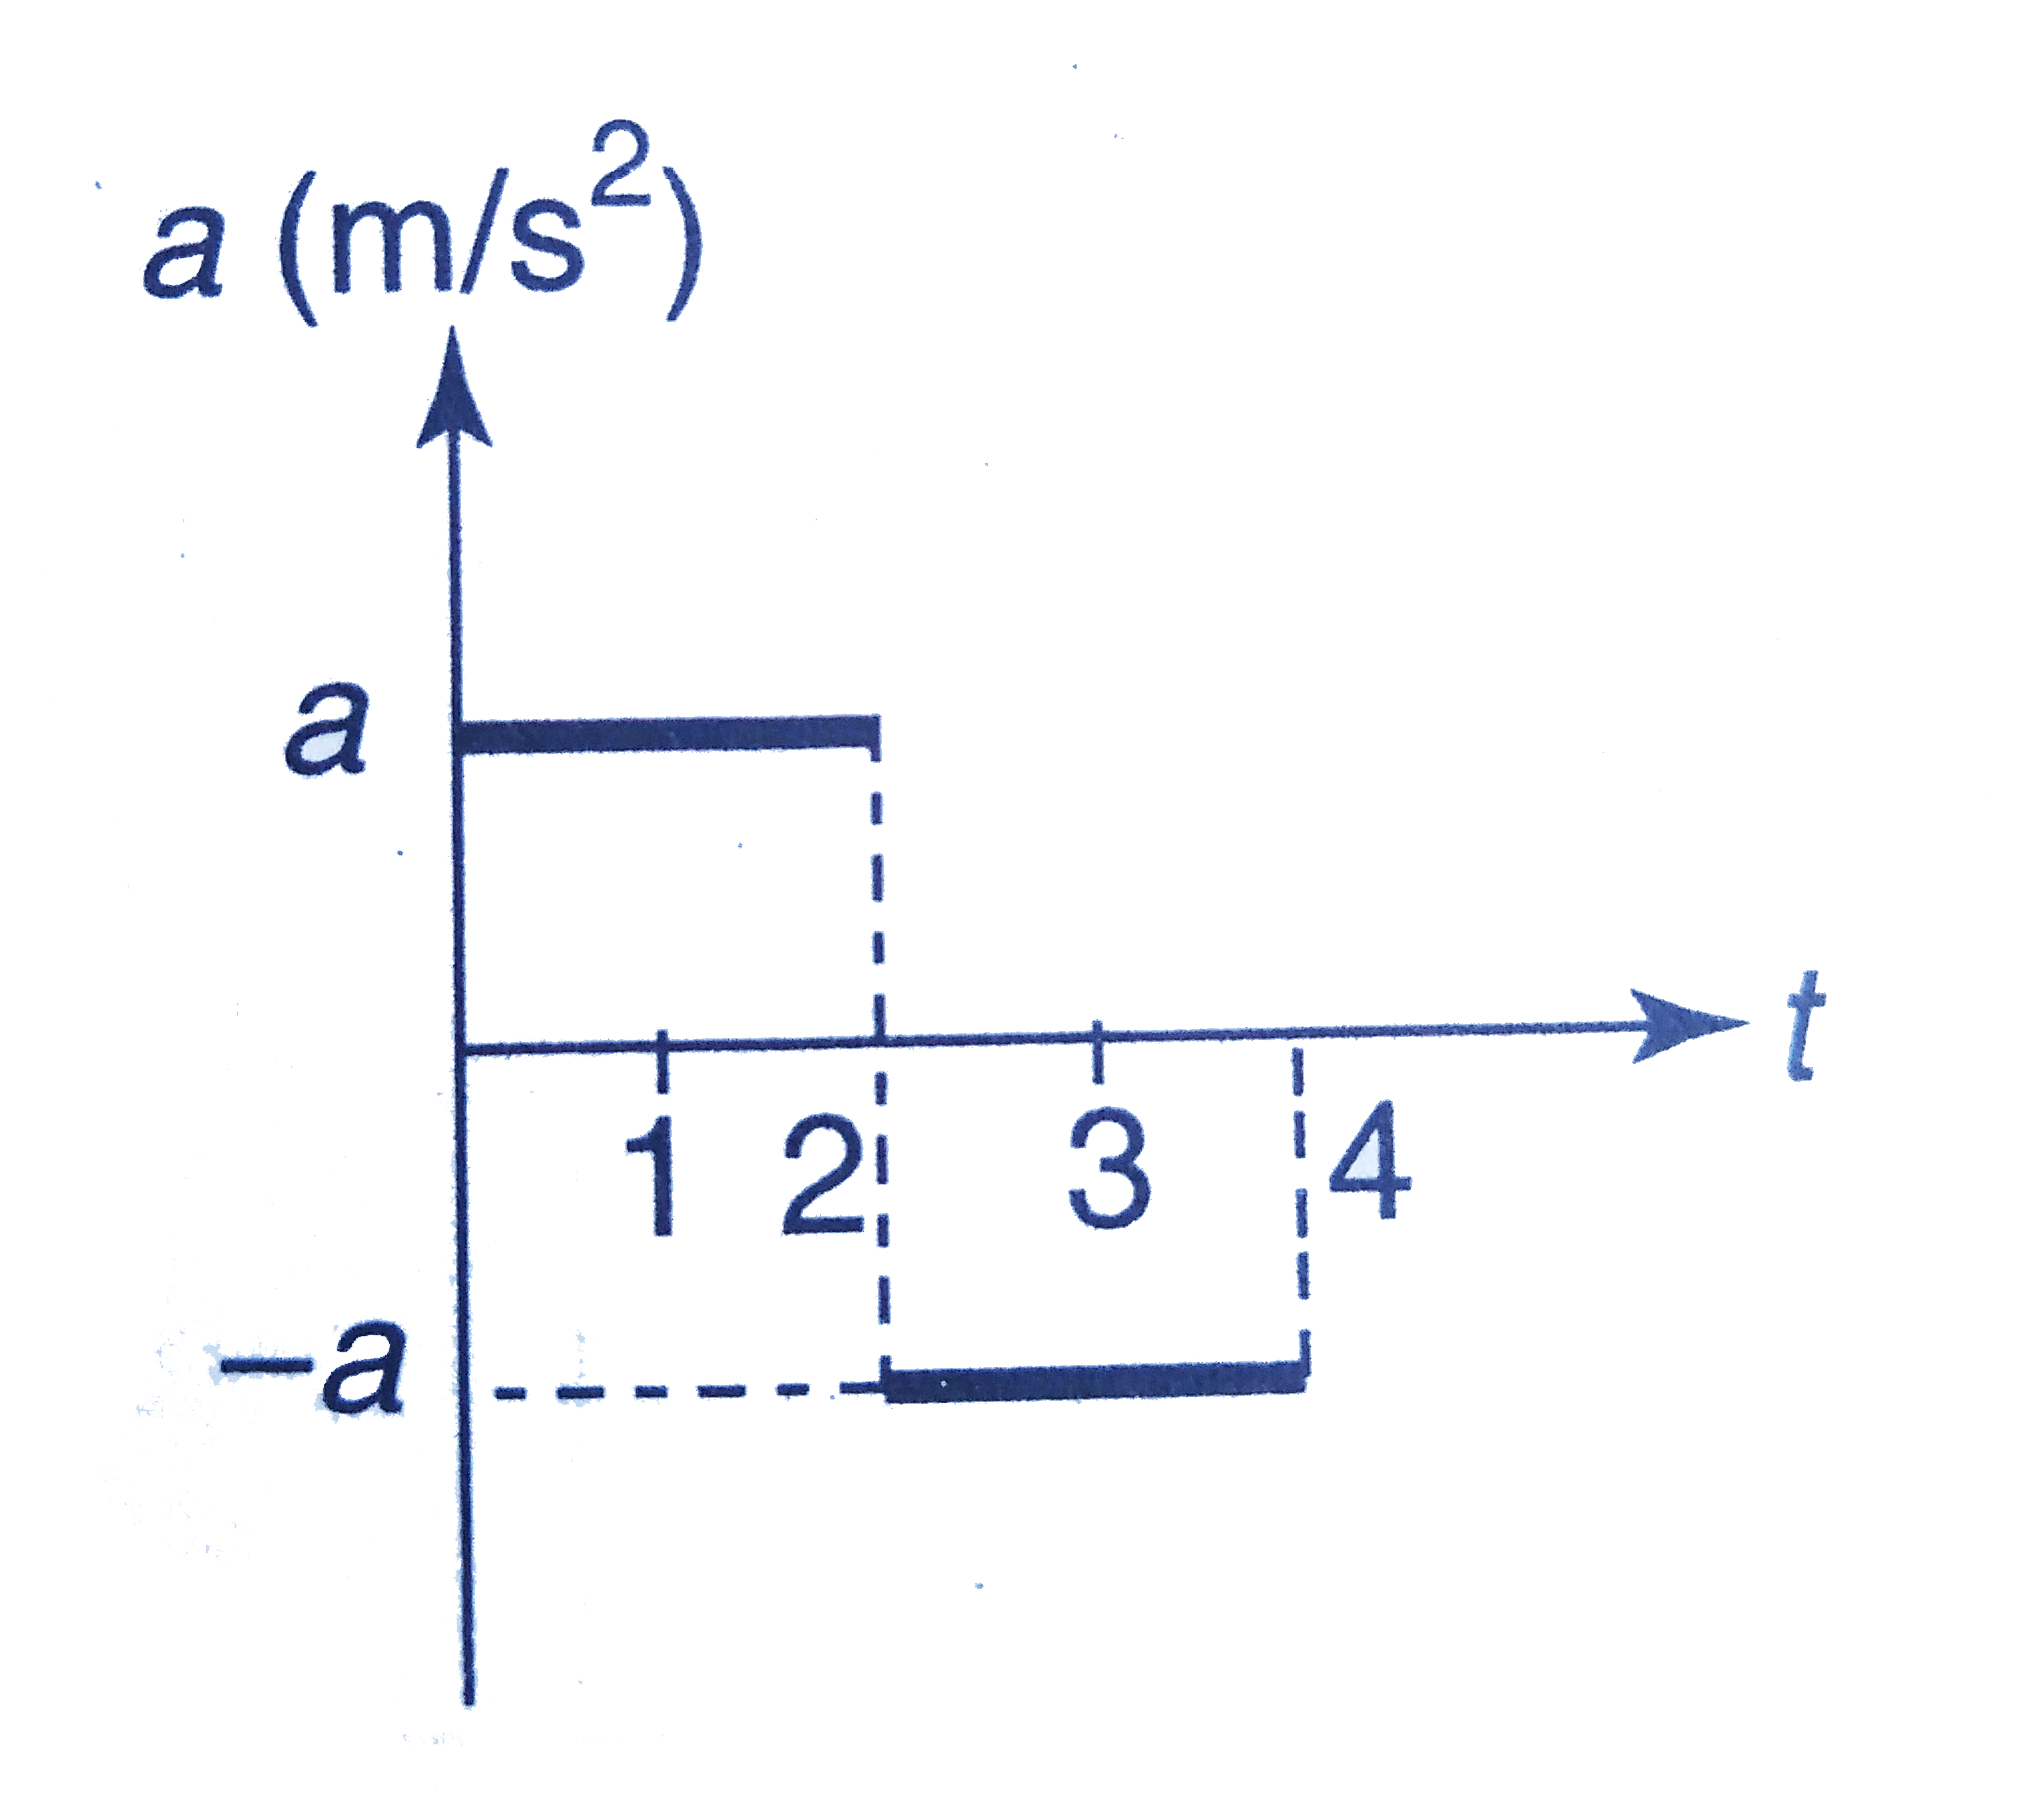 A
A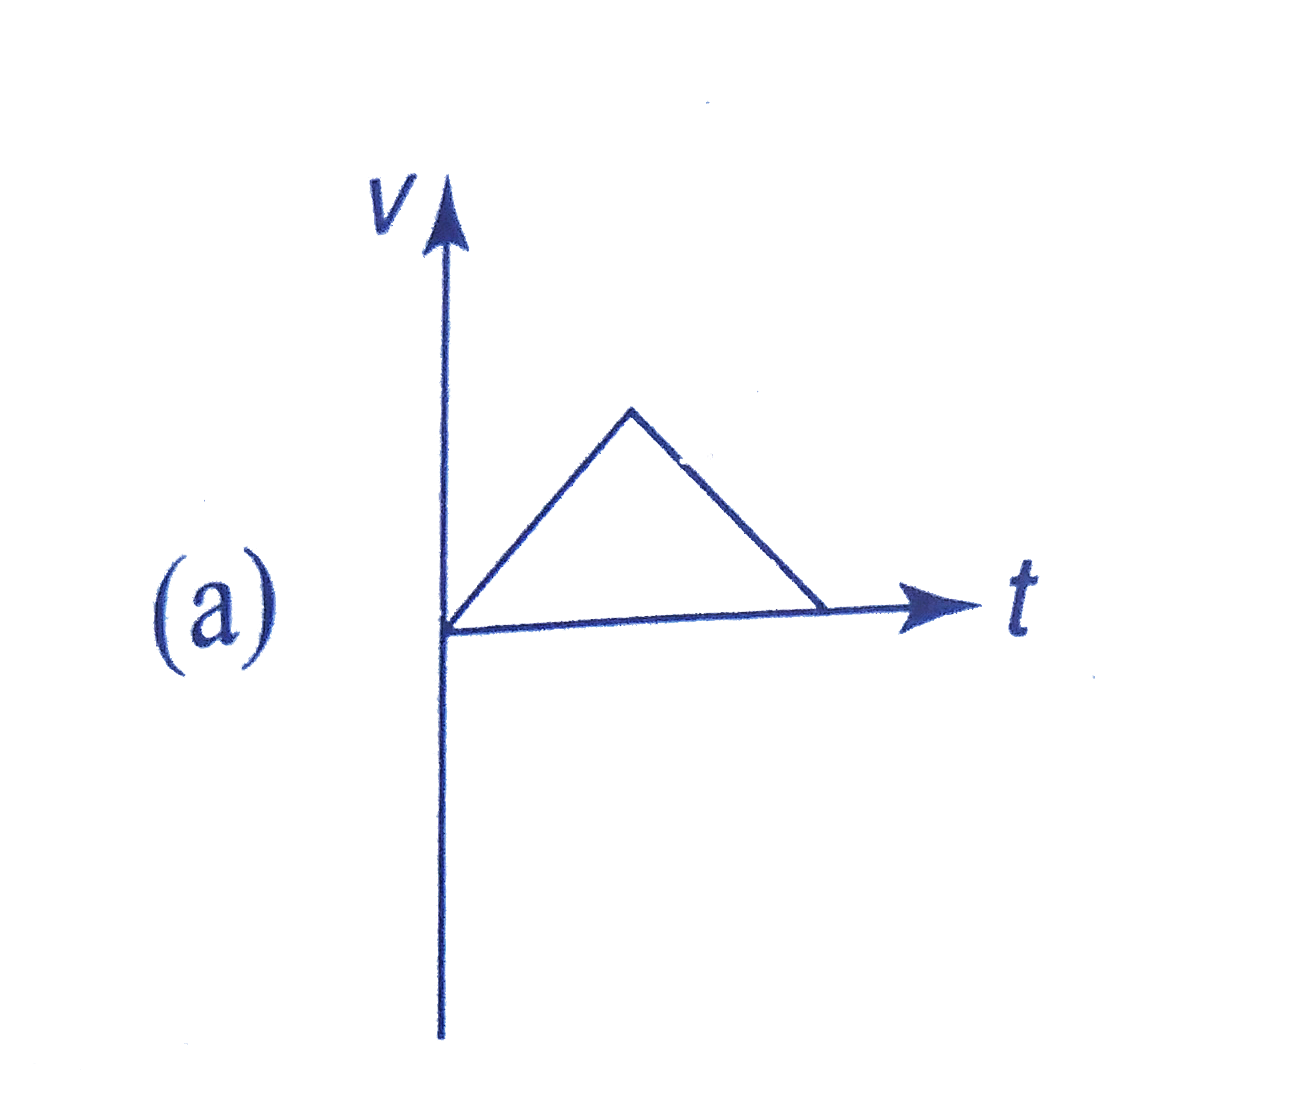 .B
.B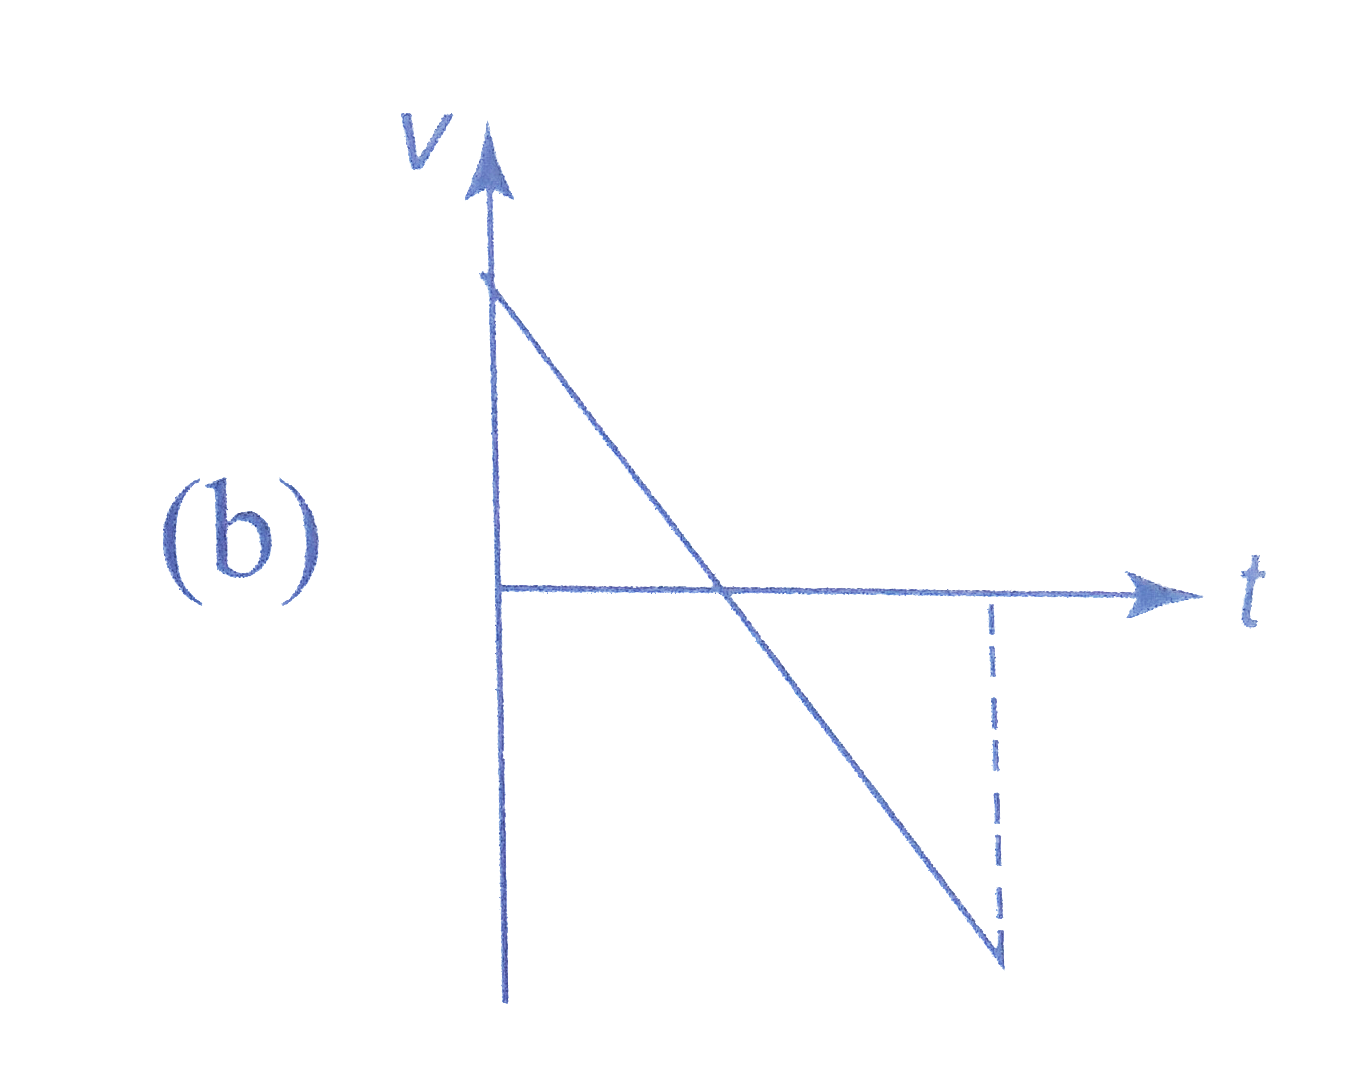 .C
.C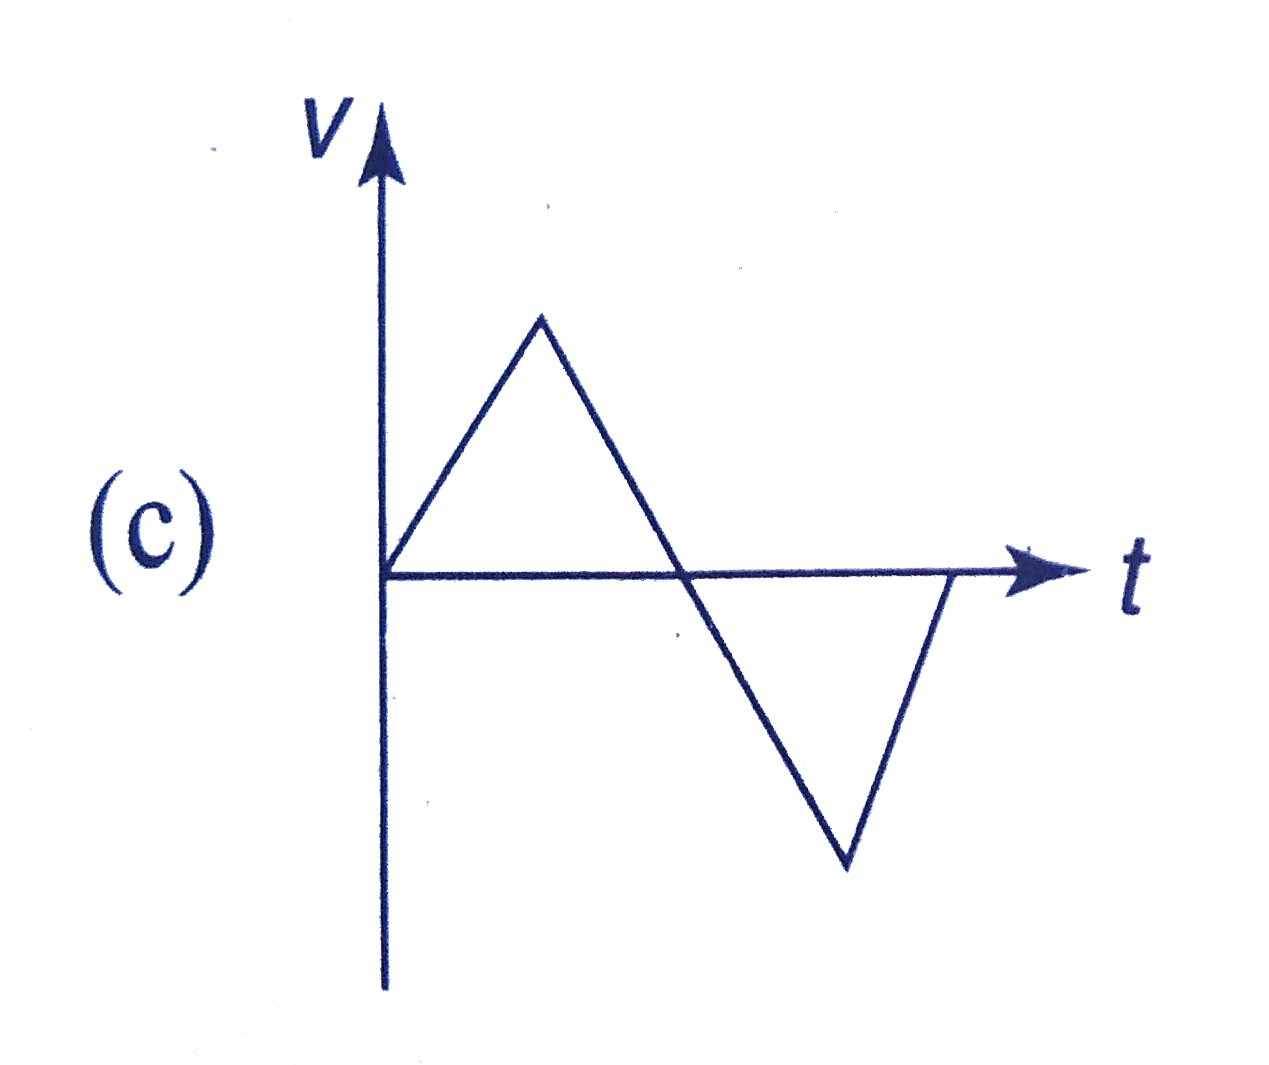 .D
.D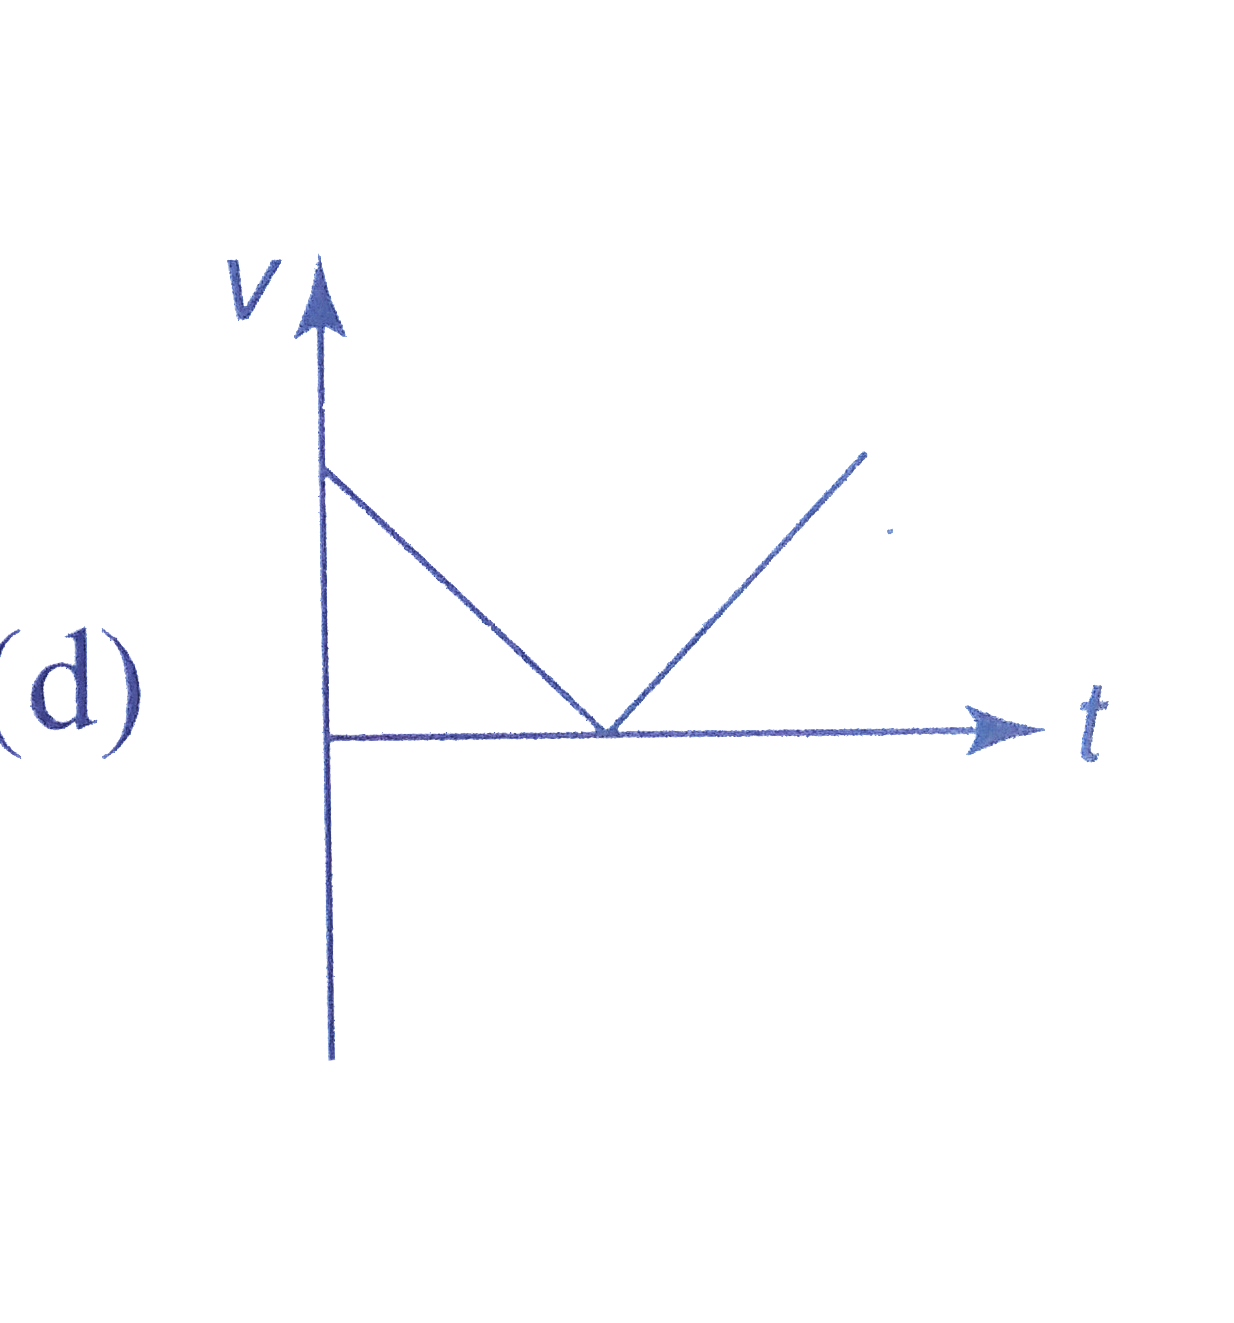 .
.
The jet plane starts from rest at s=0 and is subjected to the acceleration shown. Determine the speed of the plane when it has travelled 60 m.
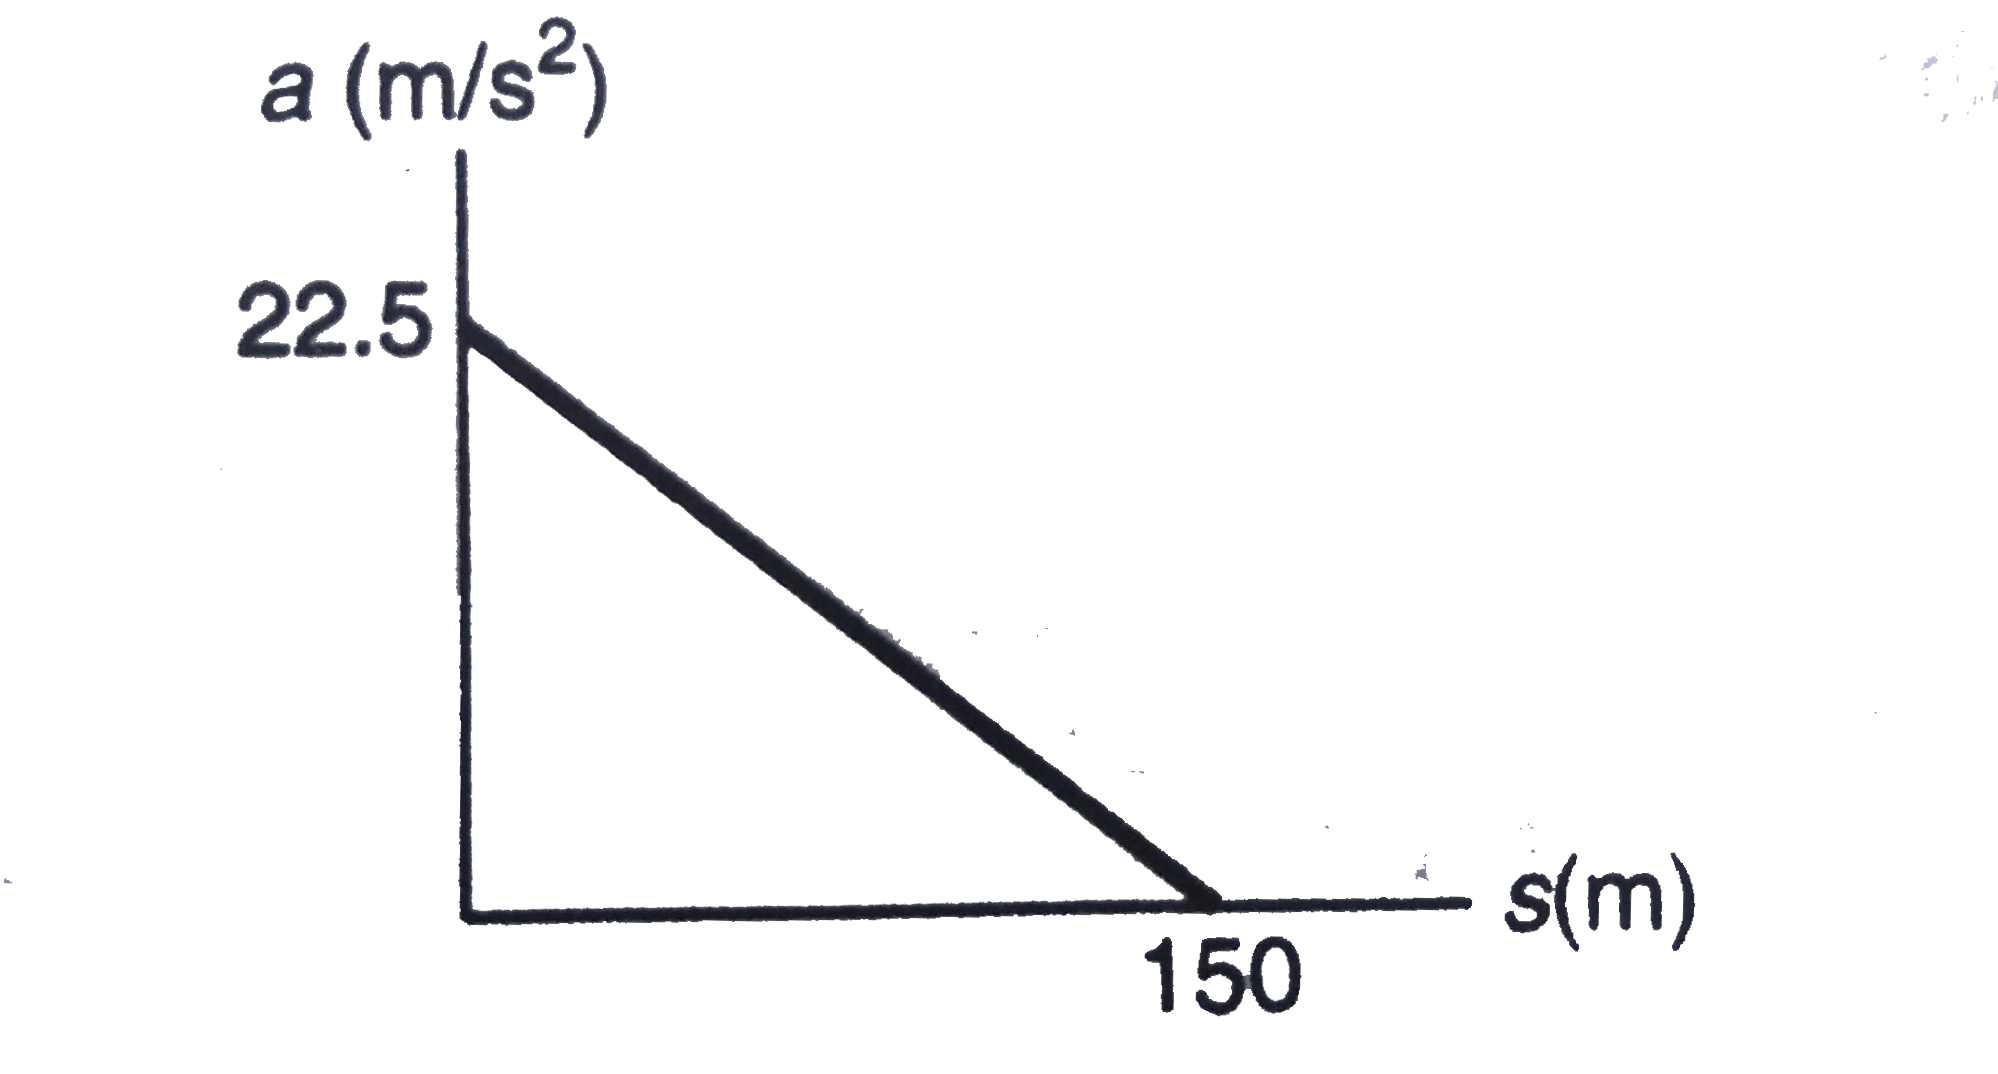
View SolutionThe jet plane starts from rest at s=0 and is subjected to the acceleration shown. Determine the speed of the plane when it has travelled 60 m.

View SolutionStarting from rest at s=0,a boat travels in a straight line with an acceleration on as shown by the a-s graph. Determine the boat's speed at s=40,90 .

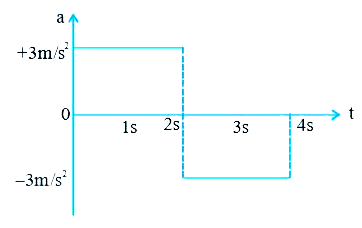
View SolutionA particle starts from rest at t=0 and undergoes an acceleration as shown in figure.
Draw the displacement-time graph of the motion of the particle during the same time interval. In both the above cases, explain the various steps.
View SolutionAn experimental car in fig (a) starts from rest and travels along a straight track such that it accelerates at a constant rate for 10 s and then decelerates at a constant rate draw the v-t and s-t graphs and determine the time t' needed to stop the car. how far has the car travelled.?
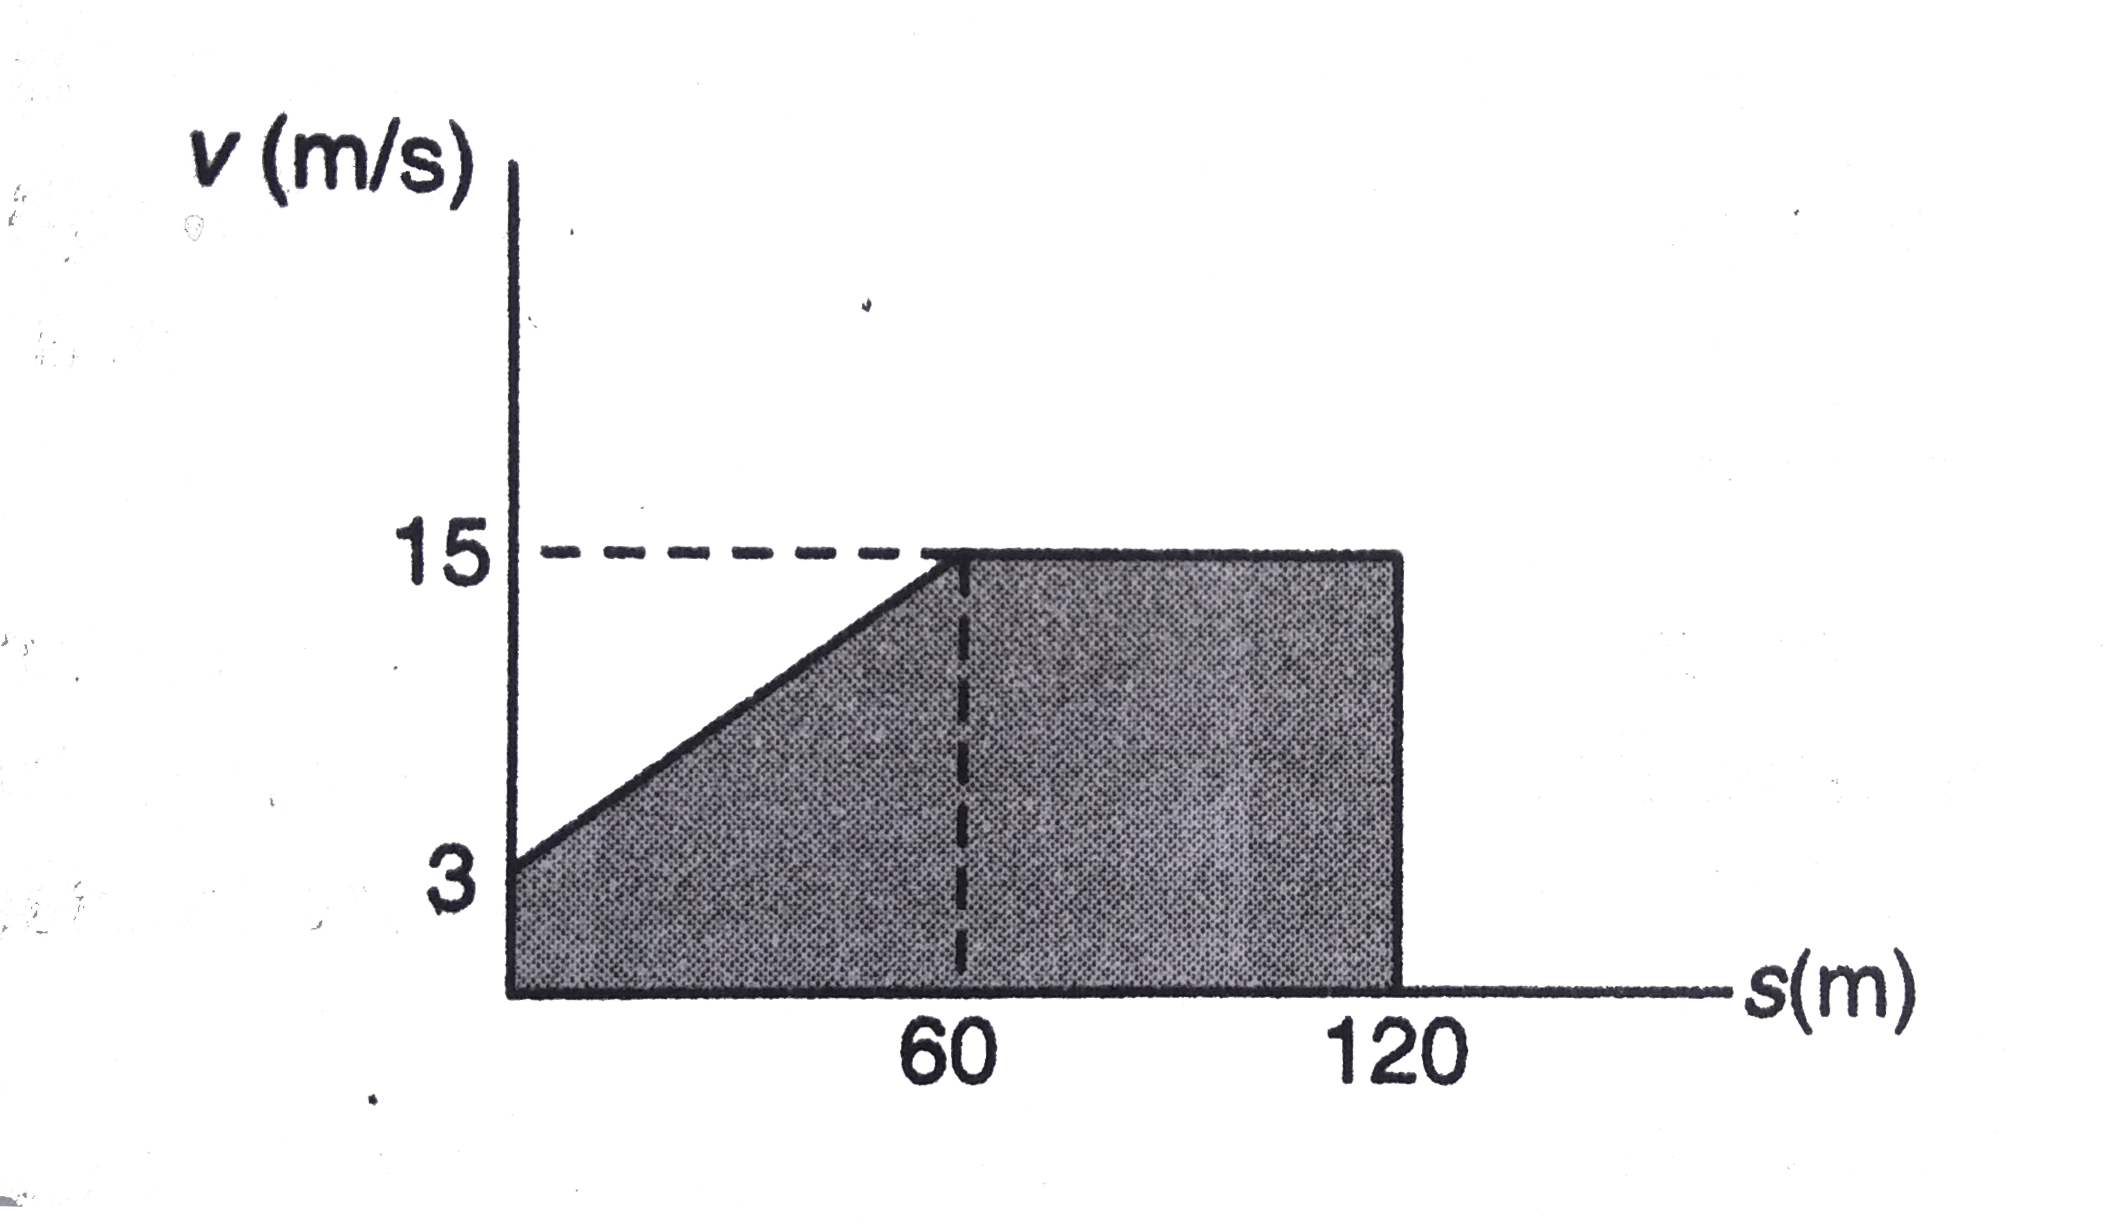
View SolutionThe v-s graph describing the motion of a motorcycle is shown in figure. Construct the a-s graph of the motion and determine the time needed for the motorcycle to reach the position s=120m. Given In 5=1.6.
View Solution

