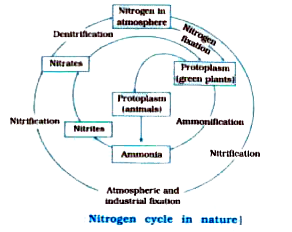
Give the diagrammatic representation of carbon cycle in biosphere.Solution in Punjabi
Step by step video & image solution for Give the diagrammatic representation of carbon cycle in biosphere. by Biology experts to help you in doubts & scoring excellent marks in Class 12 exams.
Updated on:21/07/2023Topper's Solved these Questions
Similar Questions
The relation between species richness and area is described on a logarithmic scale by the equation [where S = species richness, A = area, Z = slope of the line (regression coefficient ), C= Y - intercept]
View SolutionGive the diagrammatic representation of ETS.
View SolutionGive schematic representation of carbon cycle.
View SolutionGive diagrammatic representation of pyramid of numbers.
View SolutionWrite a diagrammatic representation of life cycle of HIV.
View SolutionDescribe the life cycle of common fern (Dryopteris) with suitable cycle diagrammatic representation.
View SolutionGive diagrammatic representation of amitosis division.
View SolutionGive the diagrammatic representation of Miller's experiment.
View SolutionDraw diagrammatic representation of life cycle of Dryopteris .
View SolutionDraw well labelled diagrammatic representation of TCA cycle.
View SolutionGive a diagrammatic representation of Rainbow production
View SolutionGive the diagrammatic representation of cyclic photophosphorylation.
View SolutionGive a graphic representation of carbon cycle in nature.
View SolutionGive the diagrammatic representation of nitrogen cycle in nature.

View SolutionGive a diagrammatic representation of translation.
View Solution
