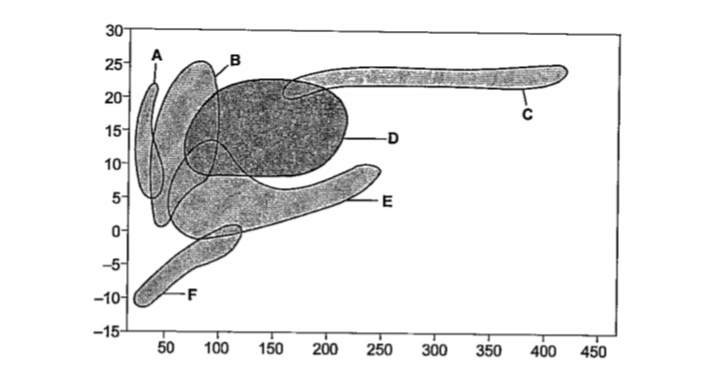
The graph given below shows the distribution of biomes:
(c) Why is 'F' located at the given position in the graph?
 Solution in Punjabi
Step by step video & image solution for The graph given below shows the distribution of biomes: (c) Why is 'F' located at the given position in the graph? by Biology experts to help you in doubts & scoring excellent marks in Class 12 exams.
Updated on:21/07/2023Topper's Solved these Questions
Similar Questions
the unique event of flowering plant is-
View SolutionA disease caused by an autosomal primary non-disjunction is.
View SolutionThe graph of y=f(x) is given below
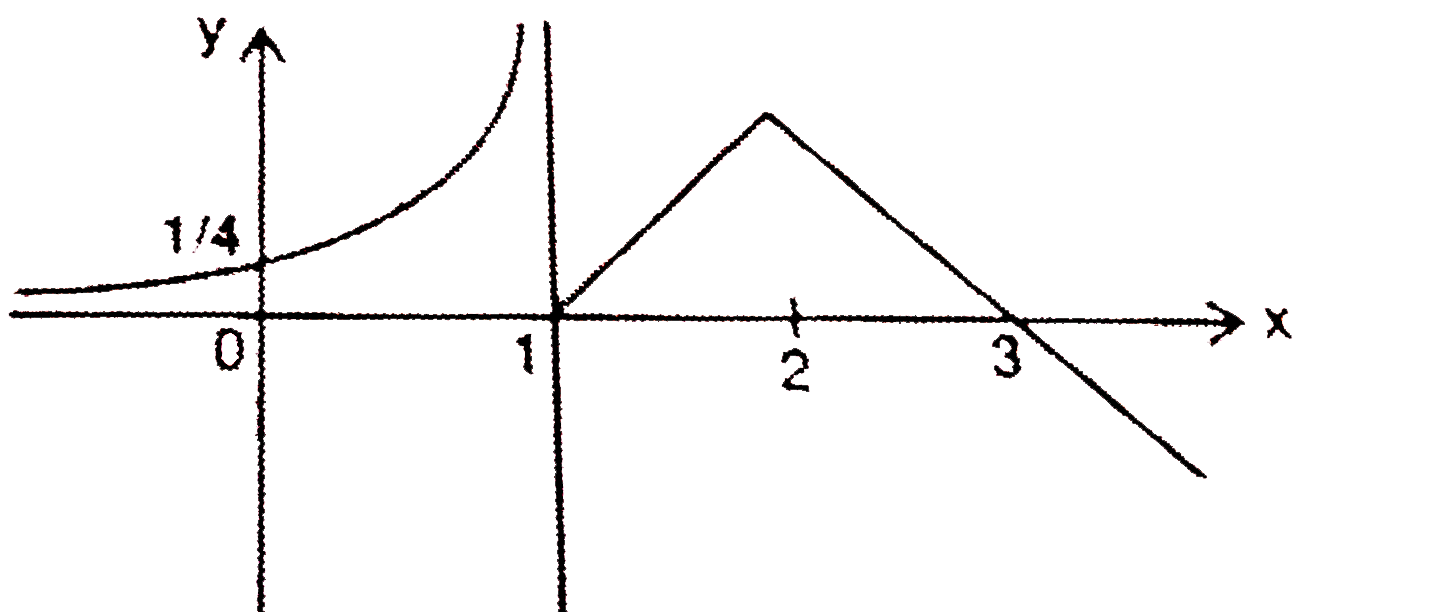
then the graph y=|f(|x|)| is :
View SolutionThe graph of f(x) is given below.
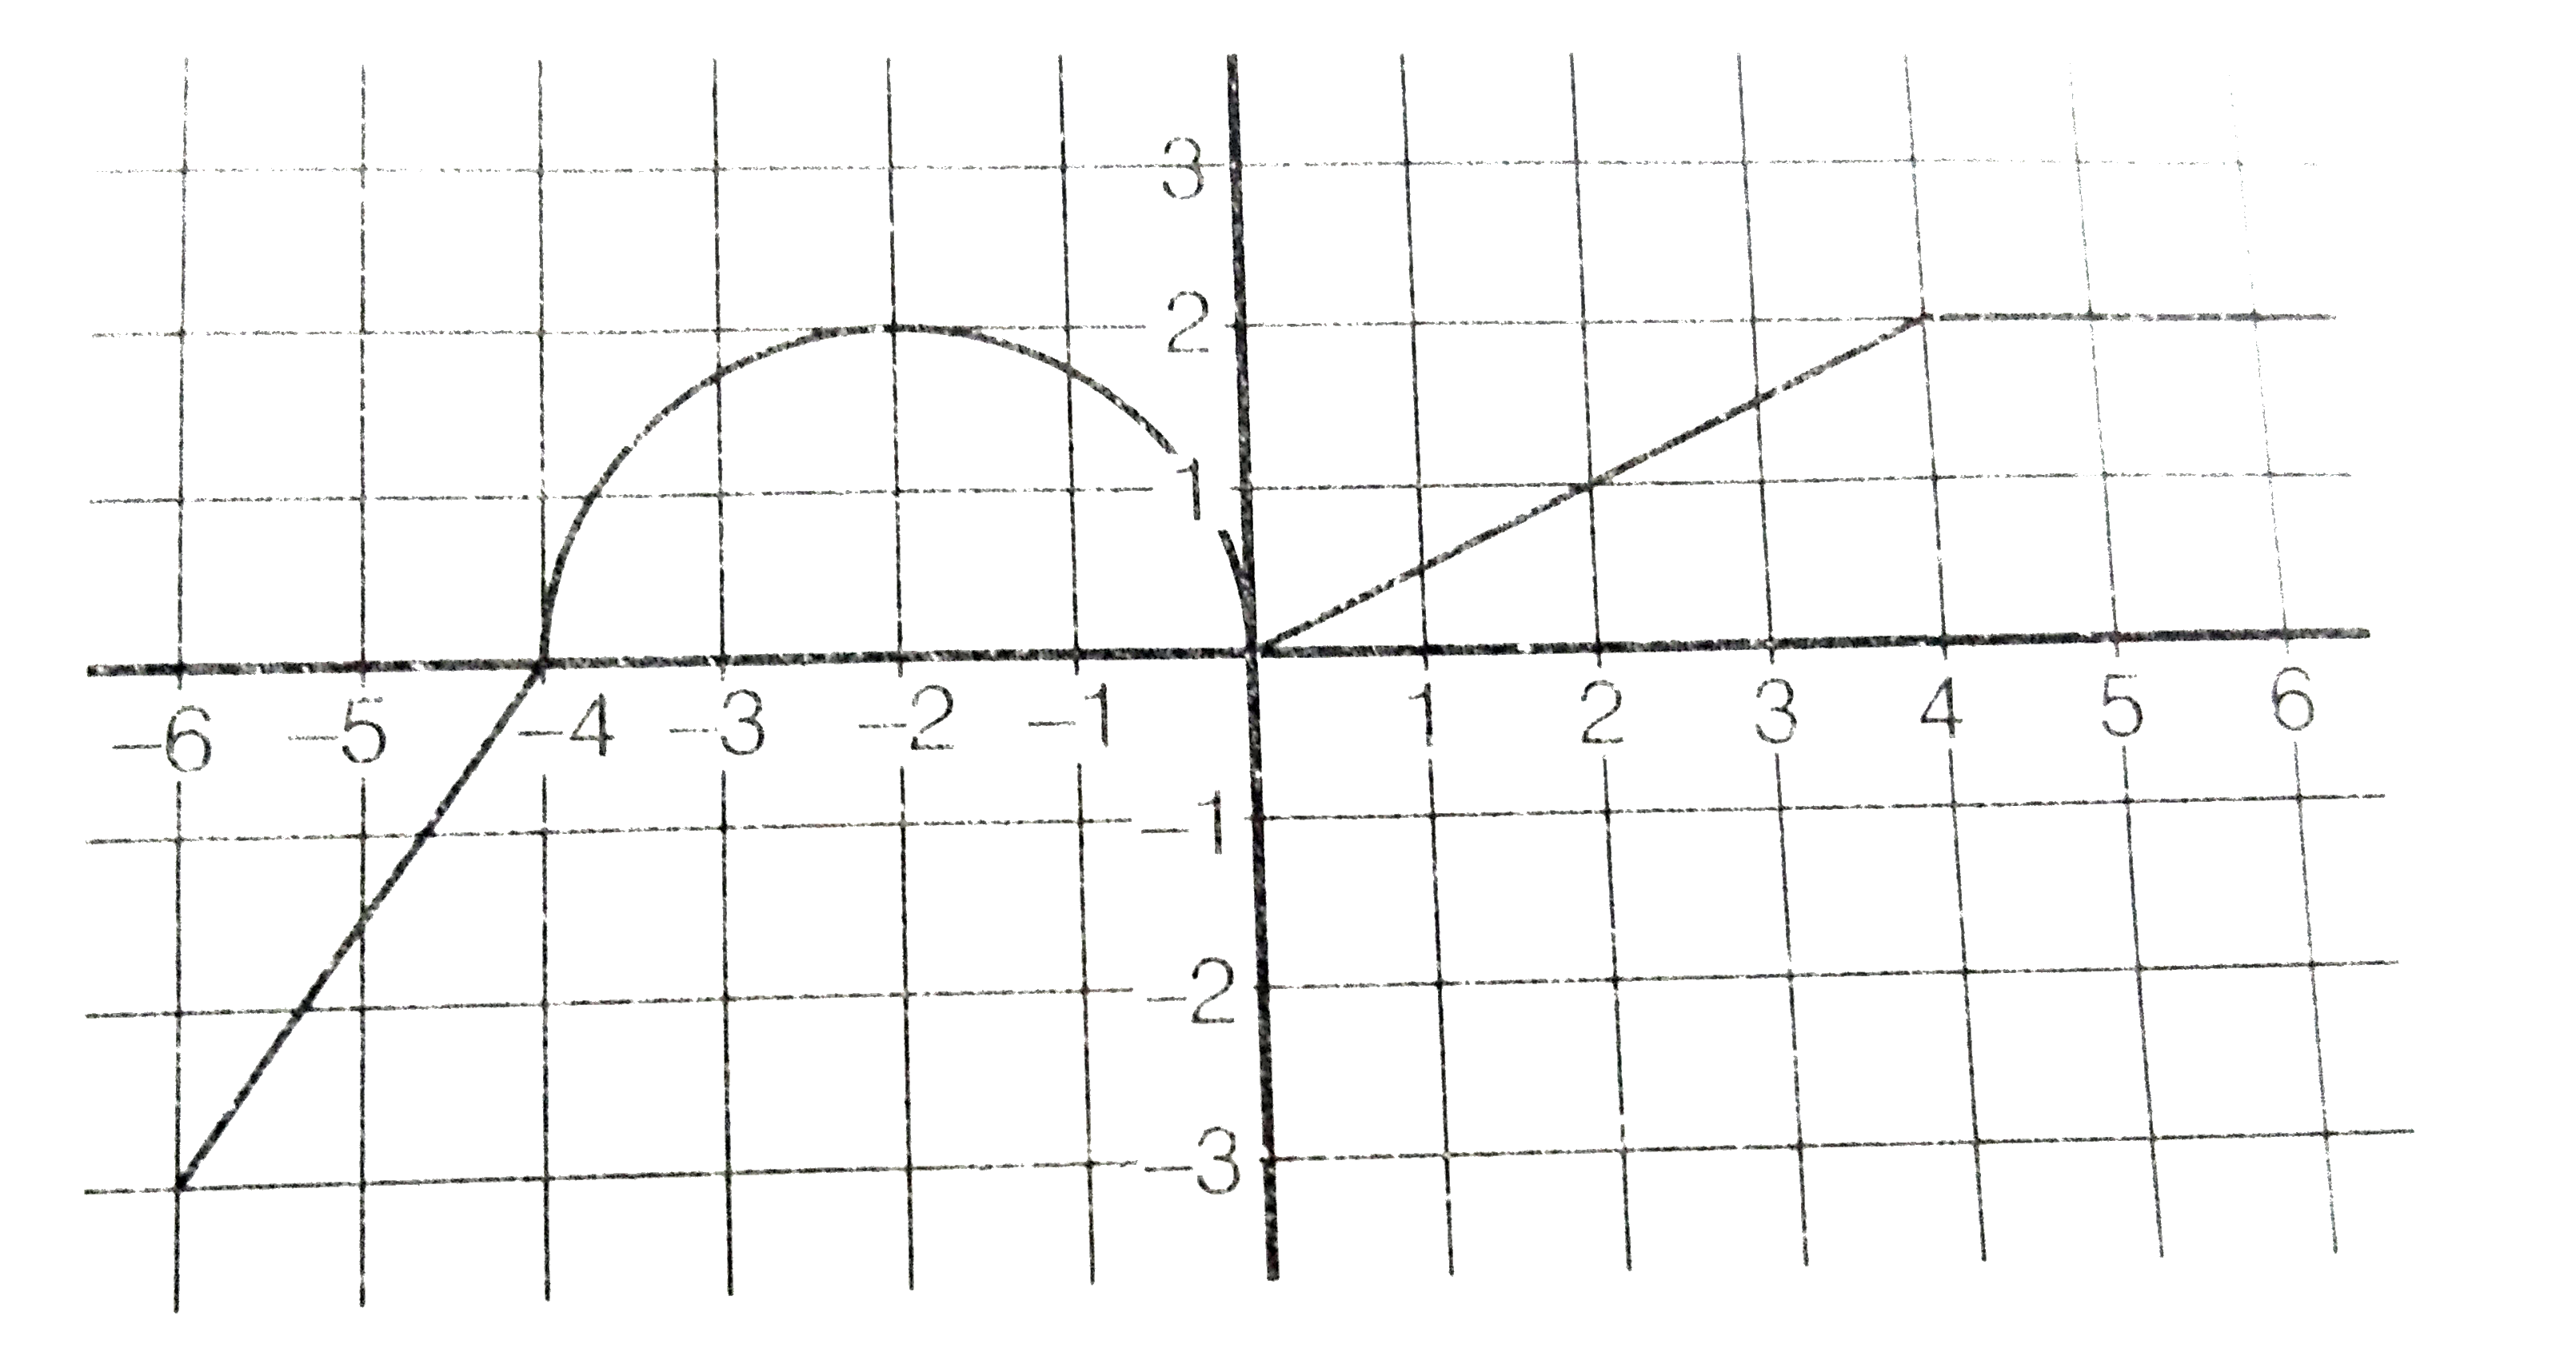
Then, (a) Graph of −f(x)+2 is

View SolutionConsider the following function f whose graph is given below.
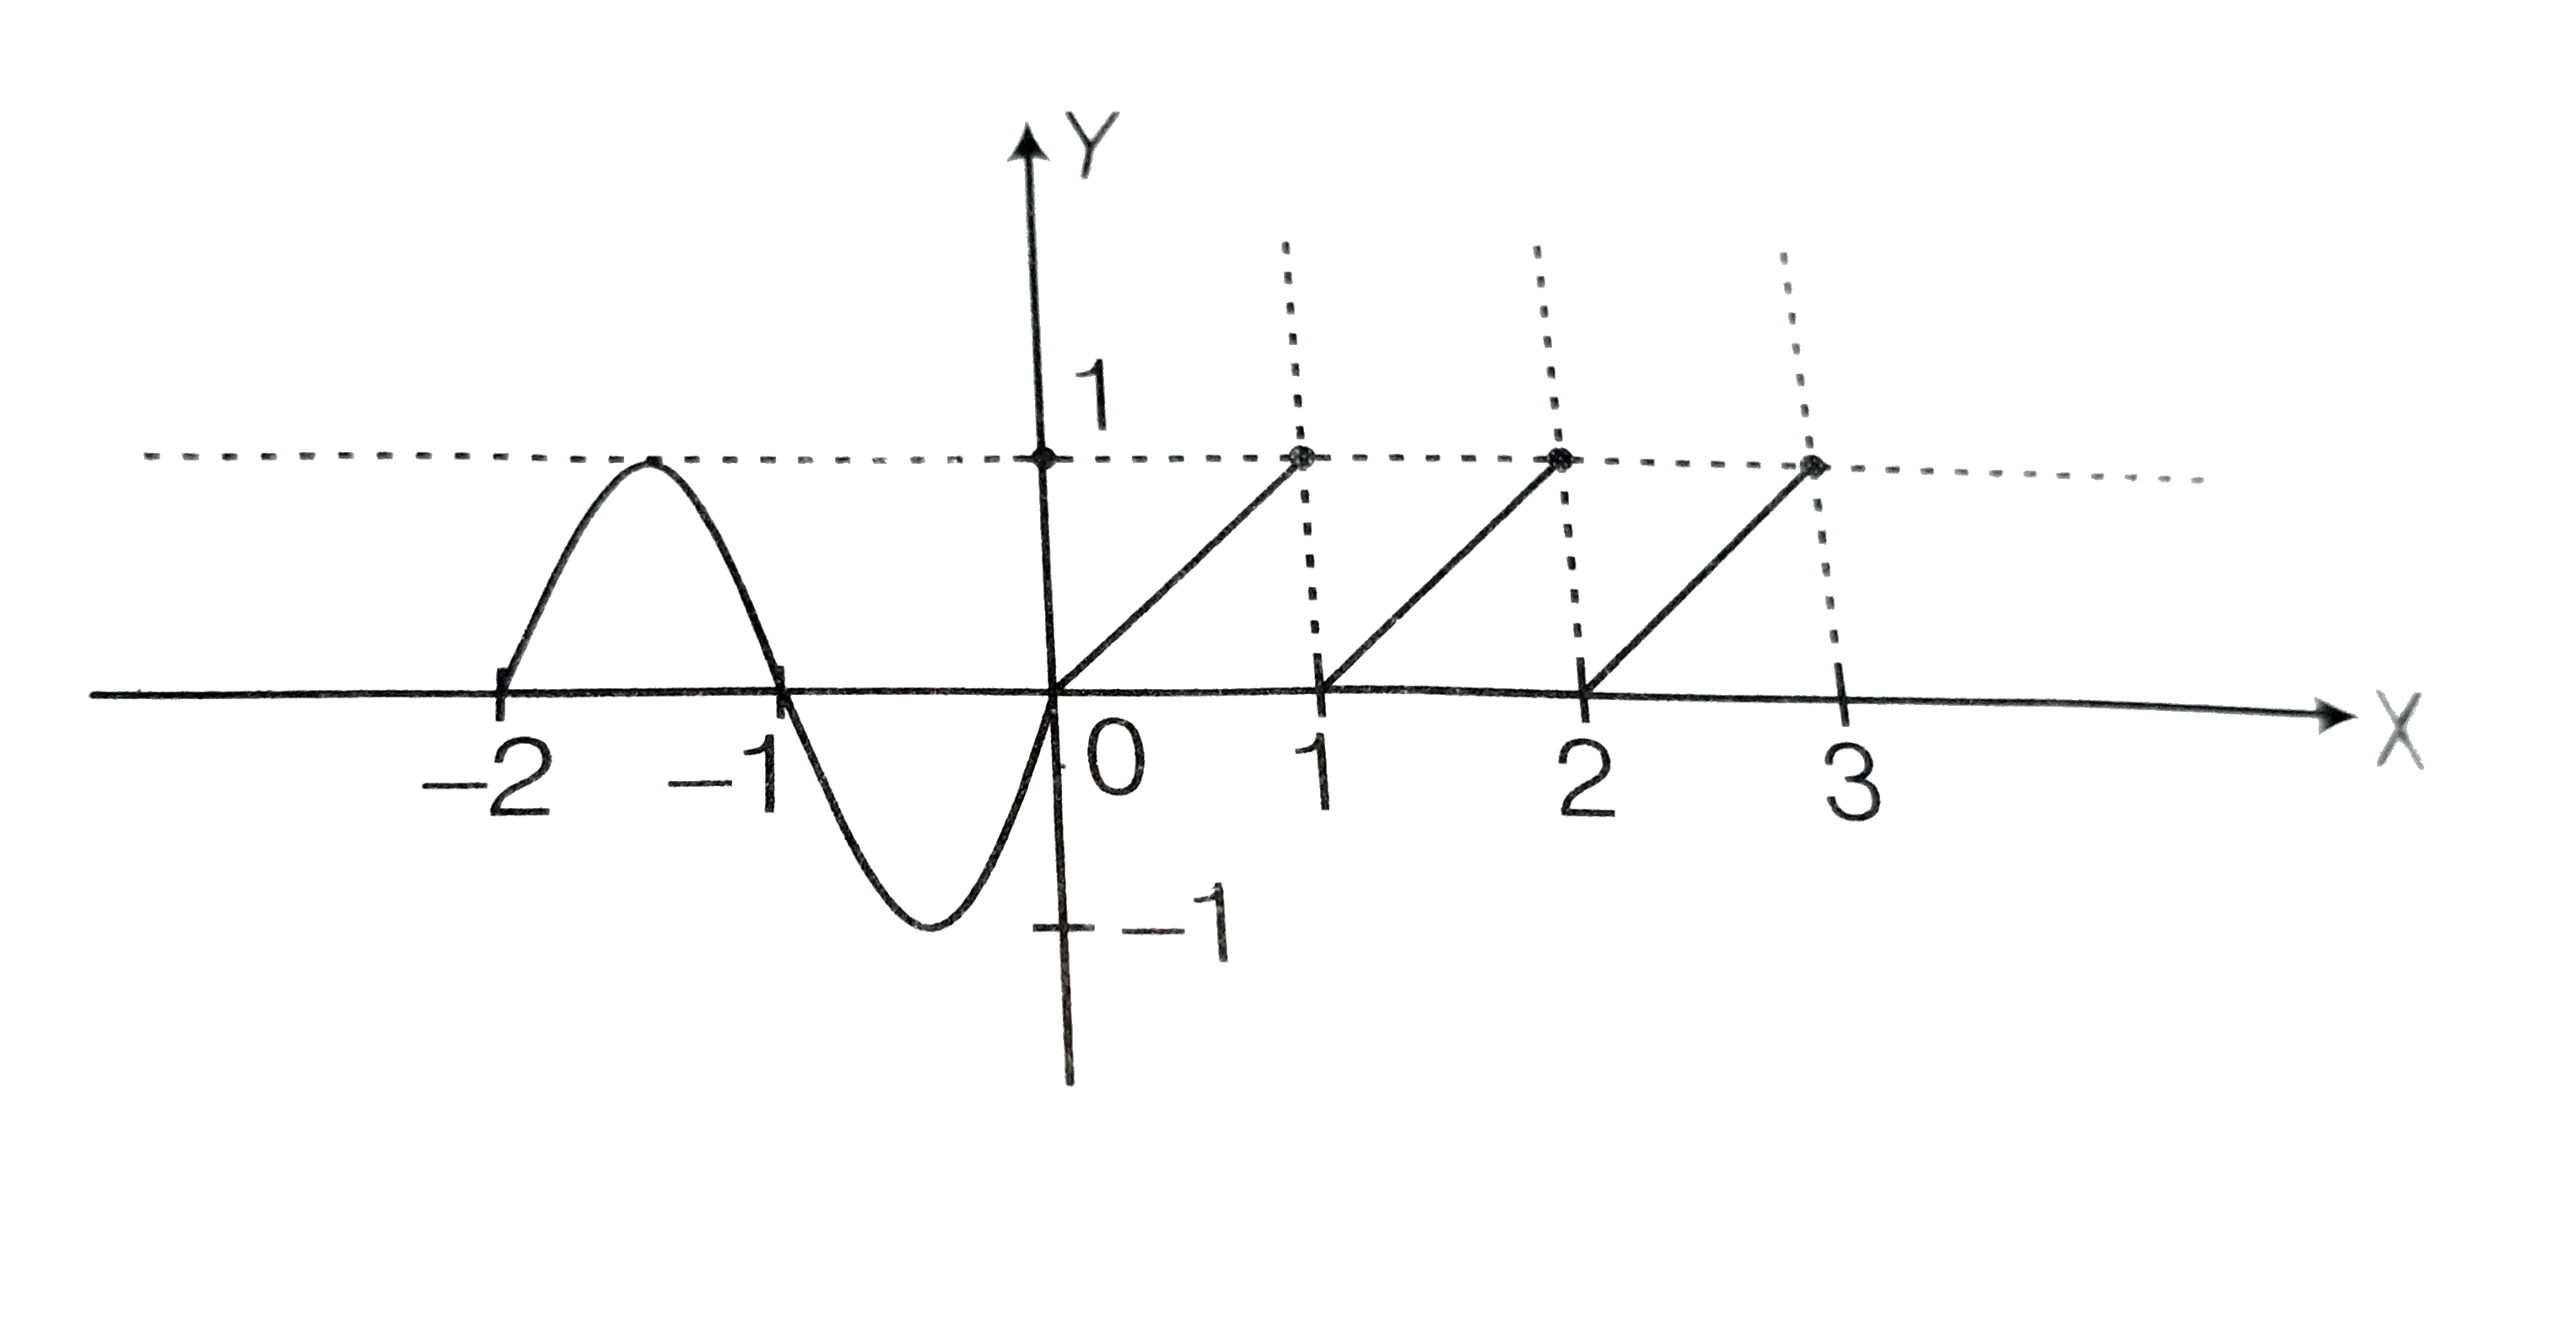
Draw the graph of following functions.
(c) −f(x)
View SolutionThe graph given below is showing biome distribution with respect to annual temperature and precipitation. Identify A, B and C, respectively.
View Solutionविस्थापन तथा समय के बीच निम्न ग्राफ प्राप्त होता है
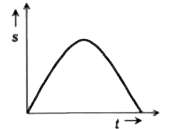
इसके संगत सही वेग-समय ग्राफ होगा
View Solutionऊर्जा के वितरण को दर्शाने वाले मैक्सवेल बोल्ट्ज़मान द्वारा दिए ग्राफ में_____
View SolutionThe graph given below shows the distribution of biomes:
(a)What do the 'X' and 'Y' axis represent?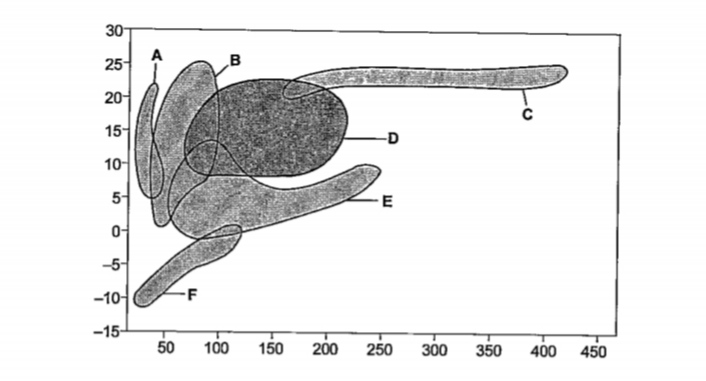
View SolutionThe graph given below shows the distribution of biomes: (b) Mark 'grassland' and coniferous forest' biomes.
View SolutionClimatic Zones and Biomes on Earth || Graph on Biome Distribution
View SolutionThe graph of f(x) is given below.

Then, (a) Graph of −f(x)+2 is

View SolutionConsider the following function f whose graph is given below.

Draw the graph of following functions.
(c) −f(x)
View SolutionThe graph of y=f(x) is given below

then the graph y=|f(|x|)| is :
View SolutionThe graph given below is showing biome distribution with respect to annual temperature and precipitation. Identify A, B and C, respectively.
View Solution
