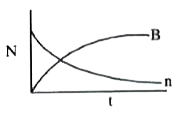
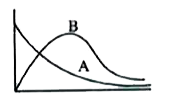
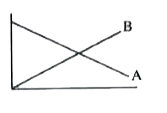
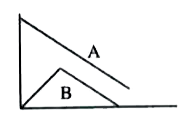
A radio active nucleus .A. decys in to radio active nucleus .B. and then in to stable nucleus .C.. Graph drawn between number of atoms of .A. and .B. with time is
Hint : At t = 0, NA=N0andNB=0 As time increases, NA decreases exponentially, NB increases to maxi-mum and falls exponentially to zero.


The correct Answer is:B
Similar Questions
A radioactive nucleus A with a half life T, decays into nucleus B. At t=0, there is no nucleus B. At some time t, the ratio of the number of B to that of A is 0.3 . Then, t is given by
View SolutionA sample of a radioactive nucleus A disintegrates to another radioactive nucleus B, which in turn disintegrates to some other stable nucleus C. Plot of a graph showing the variation of number of atoms of nucleus B vesus time is : (Assume that at t = 0, there are no B atoms in the sample)
View Solution
Knowledge Check
A radioactive nucleus A with a half life T, decays into nucleus B. At t=0, there is no nucleus B. At somewhat t, the ratio of the number of B to that of A is 0.3 . Then, t is given by
At=Tlog(1.3)Bt=Tlog(1.3)Ct=T2log2log1.3Dt=Tlog1.3log2A radioactive nucleus A with a half life T, decays into a nucleus B. At t = 0, there is no nucleus B. At sometime t, the ratio of the number of B to that of A is 0.3. Then, t is given by :
At=Tlog(1.3)Bt=(T2)log2log1.3Ct=Tlog1.3log2Dt=Tlog(1.3)A radioactive nucleus A with a half life T, decays into a nucleus B. At t = 0, there is no nucleus B. At sometime t, the ratio of the number of B to that of A is 0.3. Then, t is given by :
At = T log (1.3)Bt=Tlog(1.3)Ct=T2log2log1.3Dt=Tlog1.3log2
A nucleus .A. decays into .b. with half life .T1. and B decays into .C. with half life T2, Graphs are drwan between number of atoms/activity versus time which are as shown, then

View SolutionA radioactive sample has N0 active at t=0 . If the rate of disintegration at any time is R and the number of atoms is N, them the ratio R/N varies with time as.
View SolutionA nucleus A (parent) decays into B (Daughter) with half life T1 and B decays into C with half life T2. Graph is drawn between number of atoms/activity versus time. Select the correct graph (s)
View SolutionA radioactive sample has N0 active at t=0 . If the rate of disintegration at any time is R and the number of atoms is N, them the ratio R/N varies with time as.
View SolutionA parent radioactive nucleus A (decay constant λA) converts into a radio-active nucleus B of decay constant λb, initially, number of atoms of B is zero At any time Na,Nb are number of atoms of nuclei A and B respectively then maximum velue of Nb.
View Solution
