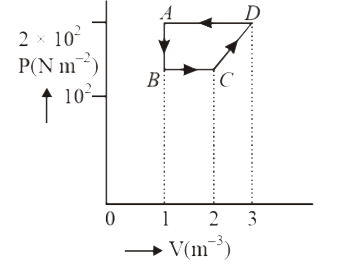
The P-V diagram of a diatomic ideal gas system going under cyclic process as shown in figure. The work done during an adiabatic process CD is (use γ=1.4):
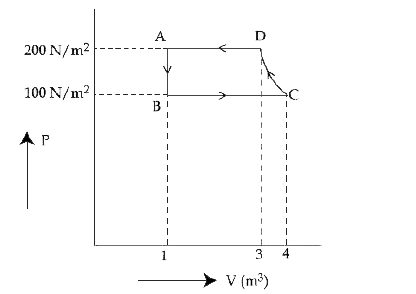
200 J
400 J
−500J
−400J
Step by step video & image solution for The P-V diagram of a diatomic ideal gas system going under cyclic process as shown in figure. The work done during an adiabatic process CD is (use gamma=1.4): by Physics experts to help you in doubts & scoring excellent marks in Class 12 exams.
Updated on:21/07/2023Topper's Solved these Questions
- JEE MAIN 2021BOOK - JEE MAINS PREVIOUS YEARCHAPTER - JEE MAIN 2021EXERCISE - PHYSICS SECTION B
30 Videos
- JEE MAIN 2021BOOK - JEE MAINS PREVIOUS YEARCHAPTER - JEE MAIN 2021EXERCISE - PHYSICS (SECTION B)
30 Videos
- JEE MAINBOOK - JEE MAINS PREVIOUS YEARCHAPTER - JEE MAINEXERCISE - All Questions
473 Videos
- JEE MAIN 2022BOOK - JEE MAINS PREVIOUS YEARCHAPTER - JEE MAIN 2022EXERCISE - Question
492 Videos
Similar Questions
Knowledge Check
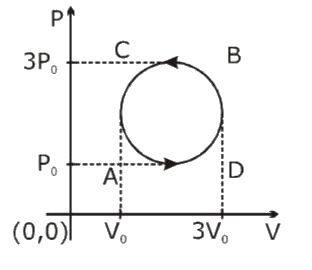
A cyclic process is shown in the figure. Work done during the cyclic process ABCDA is
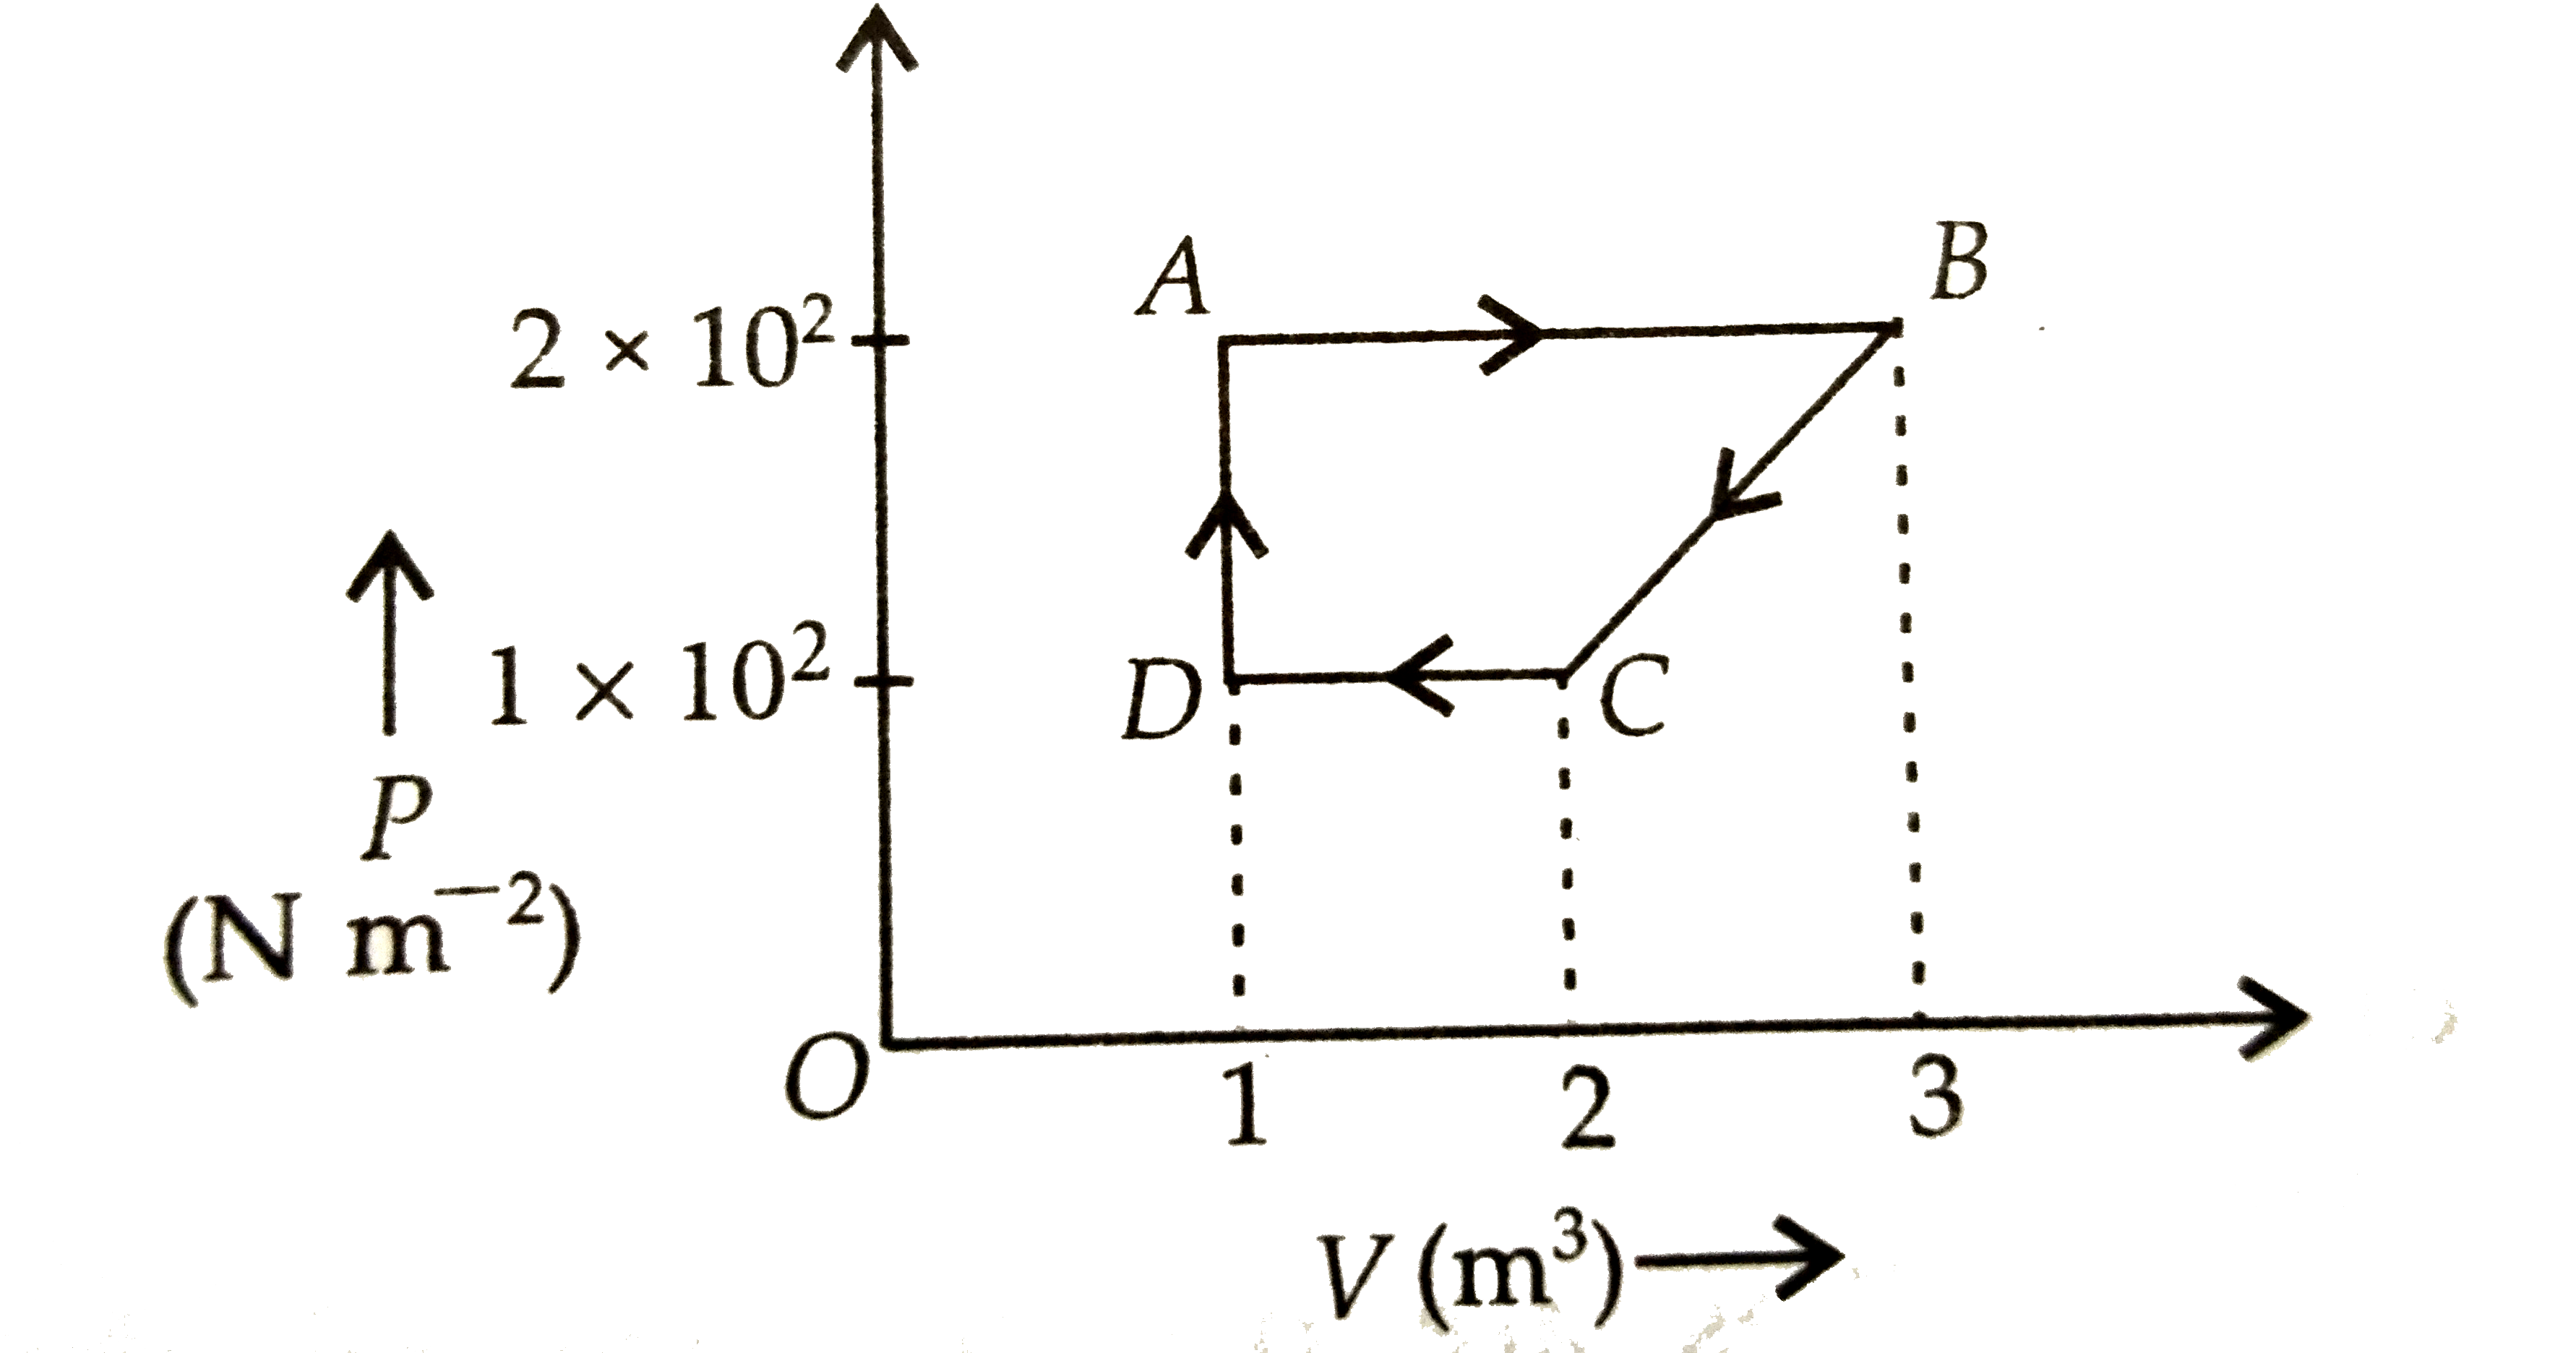 A1600 JB150 JC600 JD900 J
A cyclic process is shown in the figure. Work done during the cyclic process ABCDA is
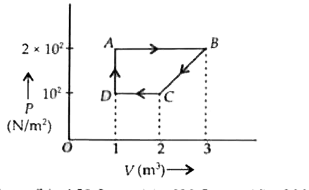 A160 JB150 JC600 JD900 J
A cyclic process is shown in the figure. Work done during the cyclic process ABCDA is
 A150JB163JC145JD166J
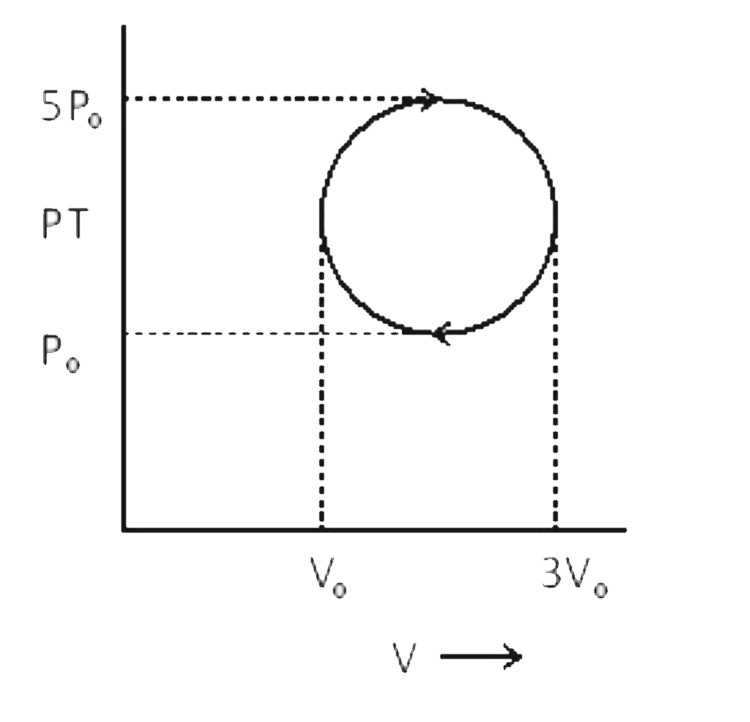
P – V graph for a cyclic process is shown in figure . Work done is given by
View SolutionTwo moles of a monoatomic ideal gas undergoes a process AB as shown in the figure. Then, find the work done during the process in Joule.
View SolutionFind the work done by gas going through a cyclic process shown in figure?

View SolutionWork done in the cyclic process shown in figure is-
View SolutionFind the work done by gas going through a cyclic process shown in figure?
View Solution

