The monthly maximum temperature of a city is given in degree celcius in the following data. By taking suitable classes, prepare the grouped frequency distribution table 29.2, 29.0, 28.1, 28.5, 32.9, 29.2, 34.2, 36.8, 32.0,31.0, 30.5, 30.0, 33, 32.5, 35.5, 34.0, 32.9, 31.5, 30.3,31.4, 30.3, 34.7, 35.0, 32.5, 33.5, 29.0, 29.5, 29.9, 33.2, 30.2 From the table,answer the following questions. For how many days the maximum temperature was less than 34∘Solution in Marathi
Step by step video & image solution for The monthly maximum temperature of a city is given in degree celcius in the following data. By taking suitable classes, prepare the grouped frequency distribution table 29.2, 29.0, 28.1, 28.5, 32.9, 29.2, 34.2, 36.8, 32.0,31.0, 30.5, 30.0, 33, 32.5, 35.5, 34.0, 32.9, 31.5, 30.3,31.4, 30.3, 34.7, 35.0, 32.5, 33.5, 29.0, 29.5, 29.9, 33.2, 30.2 From the table,answer the following questions. For how many days the maximum temperature was less than 34@ by Maths experts to help you in doubts & scoring excellent marks in Class 9 exams.
Updated on:21/07/2023Topper's Solved these Questions
Similar Questions
Which of the following data is not primary?
View SolutionChoose the correct alternative answer for each of the following questions : M = {1, 3, 5}, N = {2, 4, 6,}, then M∩N=?
View SolutionIn ΔPQR,∠P=70∘,∠Q=65∘ , then find ∠R
View SolutionThe maximum temperature (in degrees celcius) and relative humidity (in percent) for Delhi for the month of August 1998, as reported by meteorological department, are given below. Construct a frequency table for each: Maximum temperatures (in degree celcius) 32.5, 30.5, 33.8, 31.0, 28.6, 33.9, 33.3, 32.4, 30.4, 32.6, 34.7, 34.9, 31.9, 35.2, 35.3, 35.5, 36.4, 36.9, 37.0, 34.4, 32.5, 31.4, 34.4, 35.6, 37.3, 37.5, 36.9, 37.0, 36.3, 36.9, 36.7 Relative humidity (in percent) 90,97,92,95,93,95,93,85,83,85,83,77,83,77,74,60,71,65,74,80,87,82,81,76,61,63,58,58,56,57,54
View SolutionThe maximum temperatures (in degrees celcius) and relative humidity (in percent) for Delhi for the month of August 1998, as reported by Meteorological department, are given below. Construct a frequency table for each. Maximum temperatures (in degree celcius) 32.5, 30.5, 33.8, 31.0, 28.6, 33.9, 31.4, 34.4, 35.6, 37.3, 37.5, 36.7, 37.0, 36.3 ,36.9, 36.7 Relative humidity (in percent) 90,97,92,95,93,95,93,85,83,85,83,77,83,77,74,60,71,65,74, 80,87,82,81,76,61,63,58,58,56,57,54
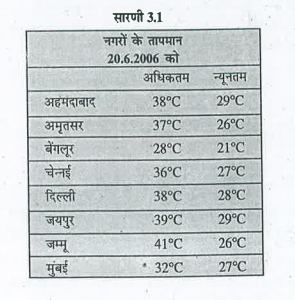
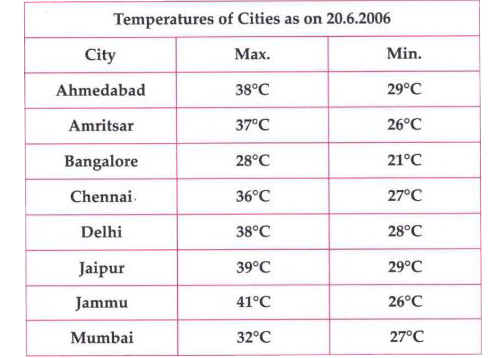
View SolutionAt the beginning of this chapter, take the minimum and maximum temperature data of the given cities (Table 3.1). Draw a double bar graph of these figures and answer the following questions: - Which city is the hottest and which city is the coldest?
View SolutionAt the beginning of this chapter, take the minimum and maximum temperature data of the given cities (Table 3.1). Draw a double bar graph of these figures and answer the following questions: - Write the names of two cities in which the maximum temperature of one was less than the minimum temperature of the other.
View Solutionवर्ष 1974 के अगस्त माह के लिए मोषम विभाग द्वारा जारी किया गया दिल्ली का अधिकतम तापमान (डिग्री सेल्सियम में ) नीचे दिए गए है। इन आँकड़ों के लिए एक बारम्बारता सारणी बनाइए :-
अधिकतम तापमान (डिग्री सेल्सियस में )
32.5, 30.3, 33.8, 31.0, 28.6, 33.9, 33.3, 32.4, 30.4, 32.6, 34.7, 34.9, 31.6, 35.2, 35.3, 35.5, 36.4, 36.6, 37.0, 34.4, 32.5, 31.4, 34.4, 35.6, 37.3, 37.5, 36.9, 37.0, 36.3, 36.9, 36.7.
View SolutionThe monthly maximum temperature of a city is given in degree celcius in the following data. By taking suitable classes, prepare the grouped frequency distribution table 29.2, 29.0, 28.1, 28.5, 32.9, 29.2, 34.2, 36.8, 32.0,31.0, 30.5, 30.0, 33, 32.5, 35.5, 34.0, 32.9, 31.5, 30.3,31.4, 30.3, 34.7, 35.0, 32.5, 33.5, 29.0, 29.5, 29.9, 33.2, 30.2 From the table,answer the following questions. For how many days the maximum temperature was less than 34∘
View Solutionकिसी कक्षा के छात्रों द्वारा प्राप्त अंकों की बारम्बारता बंटन सारणी इस प्रकार है:

निम्नलिखित प्रश्नों के उत्तर दें :
कितने छात्रों ने 30 से कम अंक प्राप्त किया?
View SolutionThe maximum daily temperatures (in ∘C) of a city during a week are given below :
28.9, 32.6, 24.6, 26.1, 29.2, 30 and 27.4
Find the mean temperature.
View SolutionThe maximum daily temperatures (in ∘C) of a city during a week are given below :
28.9, 32.6, 24.6, 26.1, 29.2, 30 and 27.4
Fidnt the range of the data.
View Solutionइस अध्याय के प्रारम्भ में दिए हुए विभिन्न नगरों के न्यून्तम और अधिकतम तापमानों के आँकड़ो को लीजिये। इन आँकड़ो का एक दोहरा दंड आलेख खींचकर निम्नलिखित प्रश्नो के उत्तर दीजिये : दी हुई तिथि पर किस नगर के न्यून्तम और अधिकतम तापमान का अंतरसबसे अधिक हैं ?

View SolutionThe maximum daily temperature of a city in a month is as follows in Celsius. Create a classified frequency distribution table (simple class) with appropriate classes. 29.2, 29.0, 28.1, 28.5, 32.9, 29.2, 34.2, 36.8, 32.0, 31.0,30.5,30.0, 33,32.5,35.5,34.0,32.9,31.5, 30.3,31.4,30.4,30.3,34.7,35.0,32.5, 33.5,29.0,29.9,33.5,30.2
View SolutionRead the frequency distribution table given below and answer the questions that follow The class interval whose frequency is maximum.
View SolutionTake the data giving the minimum and the maximum temperature of various cities given in the table.

Which city has the largest difference in the minimum and maximum temperature on the given date ?
View Solution
