If financial year is 2017-2018 then which year is considered as Assessment year?Solution in Marathi
2016-17
2018-19
2017-18
2015-16
Step by step video & image solution for If financial year is 2017-2018 then which year is considered as Assessment year? by Maths experts to help you in doubts & scoring excellent marks in Class 9 exams.
Updated on:21/07/2023Topper's Solved these Questions
Similar Questions
Find d(A,B) , if co-ordinates of A and B are -2 and 5 respectively.
View SolutionDraw only Venn diagram as per given information: A TV survey says 136 students watch only programme P1, 107 watch only programme P2, 27 watch only programme P3, 25 students watch P1 and P2 but not P3. 37 watch P2 and P3 but not P1, 53 students watch P1 and P3 but not P2, 40 students watch all three programmes and 80 students do not watch any programme.
View SolutionWhile assessing income tax, the year next to a financial year is called _______ year for that financial year.
View Solutionfor computation of income tax which is the assesment year of financial year 01-04-2016 to 31-03-2017?
View SolutionIf financial year is 2014-15 then write the assessment year.
View SolutionBeginning from the Financial year 2017-18 NITI Aayog plans to replace the 5 year plans with which of the following?
View SolutionIf financial year is 2017-2018 then which year is considered as Assessment year?
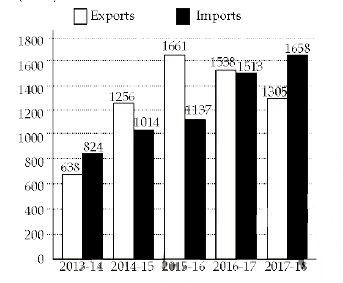
View SolutionThe given bar graph presents the imports and Exports of an item manufactured by a company for the give financial years, 2013-2014 to 2017 -2018.

What is the of total imports to total exports during the five financial years?
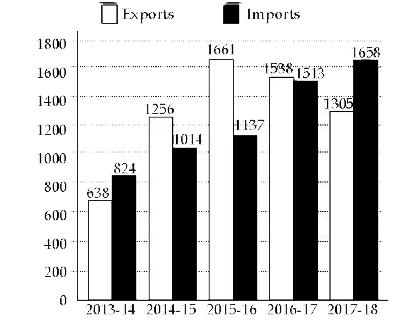
View SolutionThe given bar graph presents the Imports and Exports of an item manufactured by a company for the five financial years, 2013-2014 to 2017-2018.

In which financial year the percentage increase in total of Exports and Imports is the highest in comparison to its previous financial year?
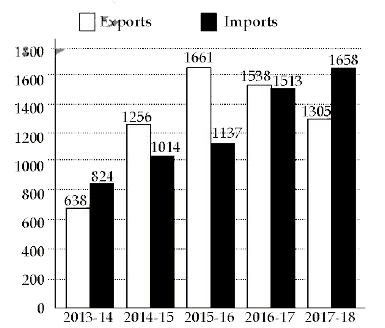
View SolutionThe given Bar graph presents the Imports and Exports of an item manufactured by a company for the five financial years, 2013-2014 to 2017-2018.

In which financial year the absolute difference of the Exports to those of Imports is the lowest?
View SolutionThe given bar graph (bar graph) shows the import and export (in tonnes) of an article manufactured by a company during the five financial years, 2013-2014 to 2017-2018. What is the average (in tonnes) of the rectangle during the five financial years?
View SolutionThe given bar graph (bar graph) shows the import and export of an article (in tonnes) manufactured by a company during the five financial years 2013-2014 to 2017-2018. In which financial year has there been maximum percentage increase in the total sum of imports and exports as compared to the previous financial year?
View Solutionदिया गया दंड आरेख (बार ग्राफ ) पाँच वित्त वर्षों, 2013−2014 से 2017−2018 के दौरान किसी कंपनी द्वारा निर्मित किसी वस्तु (टन में ) के आयात और निर्यात को दर्शाता है।

किस वित्त में पिछले वित्त वर्ष की तुलना में आयात में प्रतिशत वृद्धि सर्वाधिक है ?
View SolutionGiven bar graph (bar graph) for five financial years, 2013-2014 From 2017-2018 Refers to the import and export (in tonnes) of a commodity manufactured by a company during the period. In which financial year has the highest percentage growth in imports and exports taken place as compared to its previous financial year?
View SolutionThe given bar graph presents the Imports and Exports of an Item (in tonnes) manufactured by a company for the five financial years, 2013-2014 to 2017-2018.

What is the average of Import (in tonnes) during the five financial years?
View SolutionThe given bar graph presents the Imports and Exports of an Item (in tonnes) manufactured by a company for the five financial years, 2013-2014 to 2017-2018.

What is the ratio of total Exports to total Imports during the five financial years?
View Solution
