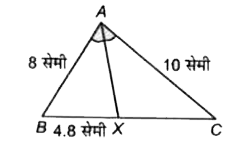
चित्र में, ΔABC में रेखा AX,∠BAC का कोदरधहक है । रेखाखण्ड AB = 8 सेमी, AC = 10 सेमी तथा BX = 4.8 सेमी। रेखाखण्ड XC की माप होगी

4 सेमी
5 सेमी
6 सेमी
3 सेमी
The correct Answer is:C
Step by step video, text & image solution for चित्र में, Delta ABC में रेखा AX, /_BAC का कोदरधहक है । रेखाखण्ड AB = 8 सेमी, AC = 10 सेमी तथा BX = 4.8 सेमी। रेखाखण्ड XC की माप होगी by Maths experts to help you in doubts & scoring excellent marks in Class 12 exams.
Topper's Solved these Questions
- BOOK - ARIHANT PUBLICATION BIHARCHAPTER - त्रिभुज EXERCISE - अभ्यास प्रशन17videos
त्रिभुज
- BOOK - ARIHANT PUBLICATION BIHARCHAPTER - त्रिकोणमितीय फलनों के मान EXERCISE - अभ्यास प्रश्न18videos
त्रिकोणमितीय फलनों के मान
- BOOK - ARIHANT PUBLICATION BIHARCHAPTER - पाइथागोरस प्रमेय के अनुप्रयोग EXERCISE - अभ्यास प्रश्न12videos
पाइथागोरस प्रमेय के अनुप्रयोग
Similar Questions
यदि किसी ΔABC का O लंबकेन्द्र, G केन्द्रक तथा S परिकेन्द्र है तथा SG=3 सेमी हो, तो OG बराबर है
01:37View Solutionsin38212∘ का मान है
06:07View Solutionयदि किसी समकोण त्रिभुज का क्षेत्रफल A तथा समकोण वाली भुजाओं में से एक की लम्बाई b हो, तो कर्ण पर पड़ने वाले समलम्ब की लम्बाई होगी
02:11View SolutionHow many lines of symmetry does the above figure have ?
01:31View SolutionWhich of the following are correct chain isomers of butane ? (i)
02:46View SolutionDetermine the point of symmetry of a regular hexagon.
02:45View SolutionDtermine the images of the following figure about the given line :
02:17View SolutionIn the figure above (not to scale), ¯¯¯¯¯¯AB⊥¯¯¯¯¯¯CDandAD is the bisector of ∠BAE.AB=3cm and AC=5cm. Find CD.
05:41View SolutionMatch the following Column A to Column B
 02:10View Solution
Match the following Column A to Column B
 02:17View Solution
Match the following Column A to Column B
 02:10View Solution
The inequation represented by the graph given below is :
04:23View SolutionThe inequation that best describes the graph given below is _________
01:13View SolutionThe inequation that best describes the following graph is _________
04:05View SolutionWhich inequations represent the shaded region in the given figure
02:26View SolutionIn the figure (not to scale) AB = AC and BD = CD. Find ∠ADB
ltimg src="https://d10lpgp6xz60nq.cloudfront.net/physics_images/PS_MATH_IX_C15_E05_003_Q01.png" width="80%"gt02:55View Solution

