एक विद्यालय की टीम ने इस वर्ष 6 खेलों में जीत प्राप्त की जबकि पिछले वर्ष 4 में ही की थी। पिछले वर्ष की तुलना में जीत कितने प्रतिशत बढ़ी?
The correct Answer is:0.5
Step by step video, text & image solution for एक विद्यालय की टीम ने इस वर्ष 6 खेलों में जीत प्राप्त की जबकि पिछले वर्ष 4 में ही की थी। पिछले वर्ष की तुलना में जीत कितने प्रतिशत बढ़ी? by Maths experts to help you in doubts & scoring excellent marks in Class 7 exams.
Topper's Solved these Questions
- BOOK - STUDENTS FRIENDSCHAPTER - राशियों की तुलनाEXERCISE - EXERCISE 7A39videos
राशियों की तुलना
- BOOK - STUDENTS FRIENDSCHAPTER - राशियों की तुलनाEXERCISE - EXERCISE 7B10videos
राशियों की तुलना
- BOOK - STUDENTS FRIENDSCHAPTER - भिन्न एवं दशमलव EXERCISE - EXERCISE 2F (Type III. एक दशमलव संख्या में दूसरे दशमलव संख्या से भाग देने पर आधारित प्रश्न : )13videos
भिन्न एवं दशमलव
- BOOK - STUDENTS FRIENDSCHAPTER - रेखा एवं कोण EXERCISE - Exercise 1B लघु उत्तरीय प्रश्न2videos
रेखा एवं कोण
Similar Questions
निम्नलिखित का अनुपात ज्ञात करें :
30 दिनों का 36 घंटे से38:08View Solutionयदि 5 लीटर पेट्रोल का मूल्य 300 रु० हो, तो 15 लीटर पेट्रोल का दाम क्या होगा?
06:14View Solutionज्ञात करें:
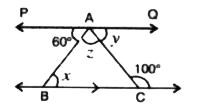
36÷0.229:56View Solutionदी गई चित्र में BC∣∣PQ तो x,y,z का मान ज्ञात करें।
 44:03View Solution
समतल में गति से पिछले वर्ष आये हुए महत्वपूर्ण प्रश्न
03:24View Solutionयह ज्ञात है की महाविद्यालय के छात्रों में से 60 % छात्रावास में रहते है और 40 % छात्रावास में नहीं रहते है । पूर्ववर्ती वर्ष से परिणाम सूचित करते है की छात्रावास में रहने वाले छात्रों में से30 % छात्रों में से 20 % छात्रों ने A ग्रेड लिए। वर्ष के अंत में महाविद्यालय के एक छात्र को यादृच्छया चुना गया और पाया गया की उसे A ग्रेड मिला है । इस बात की क्या प्रायिकता है की वह छात्रावास में रहने वाला है ?
02:08View Solutionपिछले वर्ष के बोर्ड्स परीक्षाओ में वृत पर आधारित प्रश्न
03:24View SolutionUP Board Special#!#पिछले वर्ष की परीक्षाओ में आए हुए प्रश्न
02:31View SolutionThe ratio of income of A and B last year was 4:3, respectively. The ratios of their individual incomes of the last year and the present year are 3:4 and 5:6, respectively. If their total income for the present year is Rs. 8.04 lakh, then the income of B last year was :
पिछले वर्ष A और B की आय का अनुपात क्रमशः 4 : 3 था | पिछले वर्ष और इस वर्ष की उनकी आय का अनुपात क्रमशः 3 :4 और 5 : 6 है | यदि वर्तमान वर्ष के लिए उनकी कुल आय 8.04 लाख रुपये है, तो पिछले वर्ष B की आय कितनी थी ?02:57View SolutionThe population of a town has increased by 5% at the end of the first year and decreased by 4% at the end of second year. If the population at the end of second year was 55,12,248, then the population at the beginning of first year was:
एक शहर की आबादी पहले वर्ष के अंत में 5% बढ़ी है और दूसरे वर्ष के अंत में 4% कम हुई। यदि दूसरे वर्ष के अंत में जनसंख्या 55,12,248 थी, तो पहले वर्ष की शुरुआत में जनसंख्या थी:04:17View SolutionThe table shows the number of cars sold by three showrooms over a period of six years. यह तालिका तीन शोरूम द्वारा छः वर्षों की अवधि में बेची गयी कारों की संख्या दर्शाती है | By what percent did the total number of cars sold by all three showrooms decrease during the year 2016, as compared to that in the year 2015 (nearest to one decimal place)? वर्ष 2015 की तुलना में वर्ष 2016 में तीनों शोरूम के द्वारा बेची गयी कारों की कुल संख्या में कितने प्रतिशत की कमी आयी है ? (एक दशमलव स्थान के निकटतम )
03:43View SolutionThe given Bar Graph presents the number of students of two schools for six years. दिया गया दंड आरेख छः वर्ष की अवधि में दो विद्यालयों में छात्रों की संख्या को दर्शाता है | In which year, the percentage increase in students in school B is the highest in comparison to its previous year? किस वर्ष में, विद्यालय B में छात्रों की संख्या में प्रतिशत वृद्धि इसके पिछले वर्ष की तुलना में सबसे अधिक रही है?
03:22View SolutionThe given Bar Graph presents the number of students of two schools for six years. दिया गया दंड आरेख छः वर्ष की अवधि में दो विद्यालयों में छात्रों की संख्या को दर्शाता है | In which year, the percentage increase of students in school A is the highest in comparison to its previous year? किस वर्ष, विद्यालय A में छात्रों की संख्या में प्रतिशत वृद्धि पिछले वर्ष की तुलना में सर्वाधिक है ?
03:16View SolutionThe given Bar Graph presents the number of students of two schools for six years. दिया गया दंड आरेख छः वर्ष की अवधि में दो विद्यालयों में छात्रों की संख्या को दर्शाता है | In which year the percentage increase in the number of total students in schools A and B taken together is the highest in comparison to its previous year? किस वर्ष विद्यालय A और B को मिलाकर कुल छात्रों की संख्या में प्रतिशत वृद्धि पिछले वर्ष की तुलना में सर्वाधिक है ?
03:33View SolutionThe given Bar Graph presents the results in terms of the number of students in a school for the five academic years, 2013-2014 to 2017-2018. In which year the percentage increase in total number of students is the lowest in comparison to its previous academic year? दिया गया दंड आरेख पांच शैक्षणिक वर्षों : 2013-2014 से 2017-2018 तक एक विद्यालय में छात्रों की संख्या के संदर्भ में परिणामों को प्रस्तुत करता है | किस वर्ष छात्रों की कुल संख्या में प्रतिशत वृद्धि पिछले शैक्षणिक वर्ष की तुलना में सबसे कम है ?
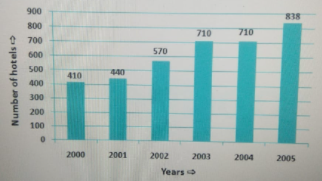
01:21View SolutionStudy the chart and answer the questions:
In which of the given years is the percentage increase in the number of hotels in comparison to the previous year, is the maximum?
चार्ट का अध्ययन करें और प्रश्नों का उत्तर दें:पिछले वर्ष की तुलना में होटलों की संख्या में किस वर्ष में अधिकतम प्रतिशत वृद्धि हुई है?02:05View Solution

