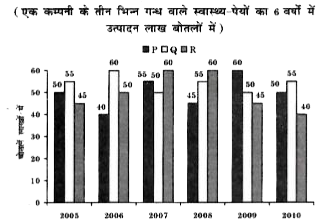
What was the approximate decline in the prodcution of flavour R in 2010 as compared to the production of 2008 in percentage?
वर्ष 2008 की तुलना में वर्ष 2010 में गन्ध R के उत्पादन में कितने प्रतिशत की कमी आई थी?
0.3033
0.5333
43.33
33.33
The correct Answer is:D
अभीष्ट कमी = 60−4060× 100 = 33.33%
Similar Questions
The given bar graph shows the number of marks scored by a student in each subject in three years.
दिया गया दंड आरेख एक छात्र के द्वारा तीन वर्षो में प्रत्येक विषय में लाये गए अंकों को दर्शाता है |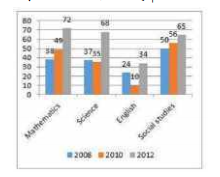 In the given chart, what is the percentage increase in marks in Mathematics in 2012 compared to 2008 (round off) ? /
इस आरेख में वर्ष 2008 की तुलना में वर्ष 2012 में गणित के अंकों में कितने प्रतिशत की वृद्धि हुई है ?View SolutionThe Table shows the Number of Laptops and Desktops manufactured by a company.
यह तालिका किसी कंपनी के द्वारा निर्मित लैपटॉप एवं डेस्कटॉप की संख्या को दर्शाती है | Approximately what was the percentage decrease in number of desktops manufactured in 2012
from 2011? (correct to nearest integer)
2011 की तुलना में 2012 में निर्मित डेस्कटॉप की संख्या में लगभग कितने प्रतिशत की कमी आई है ?View Solution
Knowledge Check
- Question 1 - Select One
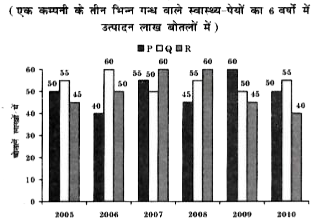
The percentage of the total production of flavour R in 2007 and 2008 with respect to the production of flavour P in 2005 and 2006 is :
वर्ष 2007 तथा 2008 में गन्ध R का कुल उत्पादन, वर्ष 2005 तथा 2006 में गन्ध P के उत्पादन की तुलना में कितने प्रतिशत रहा है?
 A1.3333B0.9767C1.0225D1.1535
 - Question 2 - Select One
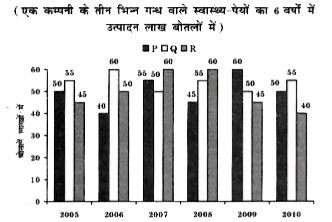
What is the difference between the average production of flavour Q in 2008, 2009 and 2010 from that of flavour P in 2005, 2006 and 2007 in lakh bottles?
वर्ष 2008, 2009 तथा 2010 में गन्ध के औसत उत्पादन तथा वर्ष 2005, 2006 तथा 2007 में गन्ध P के औसत उत्पादन का अन्तर कितनी बोतलों का रहा है?
 A5.5 lakh/ 5.5 लाखB5 lakh/ 5 लाखC50 lakh/50 लाखD0.5 lakh/0.5 लाख
 - Question 3 - Select One
A health drink company prepares the drinks of three different flavours P, Q, R. The production of three flavours over a period of six years has been expressed on bar graph provided below. Study the graph and answer the questions.
(Production of 3 different flavours of health drinks of a company in 6 years in Lakh bottles)
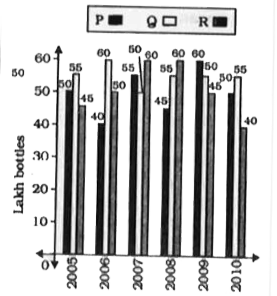
What was the approximate decline in the production of flavour R in 2010 as compared to the production of 2008 in percentage?A43.33%B33.33%C30.33%D53.33%
In the given bar graph, the Blue bar shows the income and the Red bar shows the expenditure of a company. Study the graph and answer the question that follows
दिए गए दंड आरेख में, नीला दंड एक कंपनी की आय दिखाता है और लाल दंड खर्च (लाख रुपये में) को दर्शाता है। आरेख का अध्ययन करें और उस प्रश्न का उत्तर दें जो नीचे पूछा गया है। The percentage decrease in the income of the company in 2002 as compared to that in 2001 is:
2001 की तुलना में 2002 में कंपनी की आय में कितने प्रतिशत में कमी आई है:View SolutionThe table shows the number of cars sold by three showrooms over a period of six years.
यह तालिका तीन शोरूम द्वारा छः वर्षों की अवधि में बेची गयी कारों की संख्या दर्शाती है |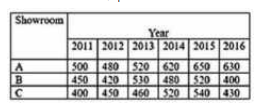 By what percent did the total number of cars sold by all three showrooms decrease during the year 2016, as compared to that in the year 2015 (nearest to one decimal place)?
वर्ष 2015 की तुलना में वर्ष 2016 में तीनों शोरूम के द्वारा बेची गयी कारों की कुल संख्या में कितने प्रतिशत की कमी आयी है ? (एक दशमलव स्थान के निकटतम )View SolutionThe following line diagram represents the yearly sales figure of a company in the years 2001-2010. Examine the diagram and answer the question.
निम्नलिखित रेखा आरेख किसी कंपनी की वर्ष 2007-2010 के दौरान वार्षिक बिक्री के आंकड़ों को दर्शाता है। आरेख का अध्ययन करें और नीचे दिए गए प्रश्नों के उत्तर दें-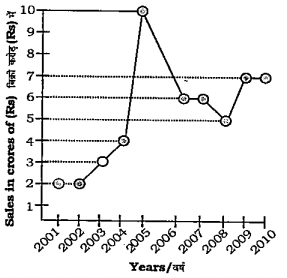 By what percent did the sales in 2008 decrease in comparison to the sales in 2006?
वर्ष 2006 में बिक्री की तुलना में वर्ष 2008 में बिक्रो में कितने प्रतिशत की कमी आई?View SolutionThis table shows the percentage of students passing out of five different colleges over three years. It is given that from each college, 200 students appeared every year.
यह तालिका तीन वर्षों में पांच अलग-अलग कॉलेजों से पास करने वाले छात्रों का प्रतिशत दर्शाती है | यह दिया गया है कि प्रत्येक कॉलेज से हर वर्ष 200 छात्र शामिल हुए |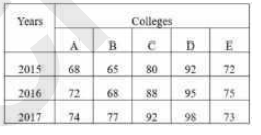 What is the approximate percentage increase in the number of students passing out of college B in the year 2017 as compared to the previous year?
कॉलेज B से वर्ष 2017 में पास करने वाले छात्रों की संख्या में पिछले वर्ष की तुलना में लगभग कितने प्रतिशत की वृद्धि हुई है ?View SolutionIn the following table, the production of various crops (in tonnes) is given from 2015 to 2019. Study the table and answer the question that follows:
दी गयी तालिका में, 2015 से 2019 तक विभिन्न फसलों का उत्पादन (टन में ) दिया गया है | इस तालिका का अध्ययन करें तथा फिर पूछे गए प्रश्न का उत्तर दीजिए |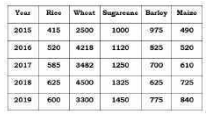 The percentage growth of maize in the year 2019 over the year 2015 is: (correct to one decimal place)
वर्ष 2019 में वर्ष 2015 की तुलना में मक्का के उत्पादन में कितने प्रतिशत की वृद्धि हुई है ? ( दशमलव के एक स्थान तक )View Solution

