For a given mass of a gas what is the shape of (p) versus (1V) graph at constant temperature ?
The correct Answer is:A
To determine the shape of the graph of pressure (P) versus 1V at constant temperature for a given mass of gas, we can follow these steps:
1. Start with the Ideal Gas Law:
The ideal gas law is given by the equation:
PV=nRT
where P is the pressure, V is the volume, n is the number of moles of gas, R is the universal gas constant, and T is the absolute temperature.
2. Rearranging the Ideal Gas Law:
To find the relationship between pressure and volume, we can rearrange the equation to express pressure P in terms of volume V:
P=nRTV
3. Expressing Pressure in terms of 1V:
We can rewrite the equation to express P as a function of 1V:
P=nRT⋅1V
Here, nRT is a constant for a given mass of gas at constant temperature.
4. Identifying the Relationship:
From the equation P=nRT⋅1V, we can see that pressure P is directly proportional to 1V. This means that if we plot P on the y-axis and 1V on the x-axis, we will get a linear relationship.
5. Graph Characteristics:
Since P is directly proportional to 1V, the graph will be a straight line that passes through the origin. The slope of this line will be equal to nRT.
Conclusion:
The shape of the graph of pressure (P) versus 1V at constant temperature for a given mass of gas is a straight line with a positive slope equal to nRT.
---
The ideal gas law is given by the equation:
PV=nRT
where P is the pressure, V is the volume, n is the number of moles of gas, R is the universal gas constant, and T is the absolute temperature.
To find the relationship between pressure and volume, we can rearrange the equation to express pressure P in terms of volume V:
P=nRTV
We can rewrite the equation to express P as a function of 1V:
P=nRT⋅1V
Here, nRT is a constant for a given mass of gas at constant temperature.
From the equation P=nRT⋅1V, we can see that pressure P is directly proportional to 1V. This means that if we plot P on the y-axis and 1V on the x-axis, we will get a linear relationship.
Since P is directly proportional to 1V, the graph will be a straight line that passes through the origin. The slope of this line will be equal to nRT.
The shape of the graph of pressure (P) versus 1V at constant temperature for a given mass of gas is a straight line with a positive slope equal to nRT.
Topper's Solved these Questions
- THERMOMETRY,THERMAL EXPANSION & KINETIC THEORY OF GASESBOOK - DC PANDEY ENGLISHCHAPTER - THERMOMETRY,THERMAL EXPANSION & KINETIC THEORY OF GASESEXERCISE - Exercise 20.4
3 Videos
- THERMOMETRY,THERMAL EXPANSION & KINETIC THEORY OF GASESBOOK - DC PANDEY ENGLISHCHAPTER - THERMOMETRY,THERMAL EXPANSION & KINETIC THEORY OF GASESEXERCISE - Exercise 20.5
7 Videos
- THERMOMETRY,THERMAL EXPANSION & KINETIC THEORY OF GASESBOOK - DC PANDEY ENGLISHCHAPTER - THERMOMETRY,THERMAL EXPANSION & KINETIC THEORY OF GASESEXERCISE - Exercise 20.2
7 Videos
- THERMOMETRY THERMAL EXPANSION AND KINETIC THEORY OF GASESBOOK - DC PANDEY ENGLISHCHAPTER - THERMOMETRY THERMAL EXPANSION AND KINETIC THEORY OF GASESEXERCISE - Medical entrance gallary
30 Videos
- UNIT AND DIMENSIONSBOOK - DC PANDEY ENGLISHCHAPTER - UNIT AND DIMENSIONSEXERCISE - Assertion And Reason
2 Videos
Similar Questions
For a given mass of a gas, what is the shape of (pV) versus (T) graph on isothermal process ?
View SolutionWhat is the type of graph between log P and log V at constant temperature?
View SolutionBy what percentage should the pressure of a given mass of a gas be increased so as to decrease its volume by 10% at a constant temperature?
View SolutionThe volume of a given mass of a gas in a vessel is reduced to half at constant temperature what is the change in pressure?
View SolutionThe pressure of a given mass of a gas contained in a vessel at constant temperature is reduced to half. Calculte the change in volume of the gas
View SolutionThe temperature of a given mass of a gas is increased from 19∘C to 20∘C at constant pressure. The volume V of the gas is
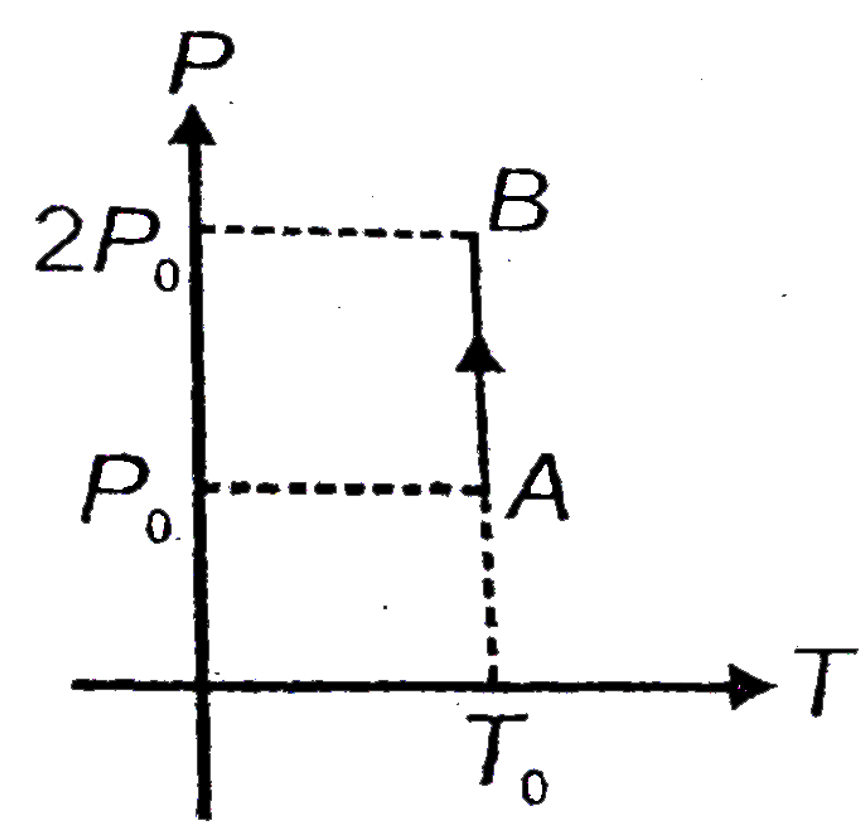
View SolutionFor a given mass of gas the variation of pressure versus temperature is shown in the figure. What is the ratio of volume of the gas at points A and B.
 .
.
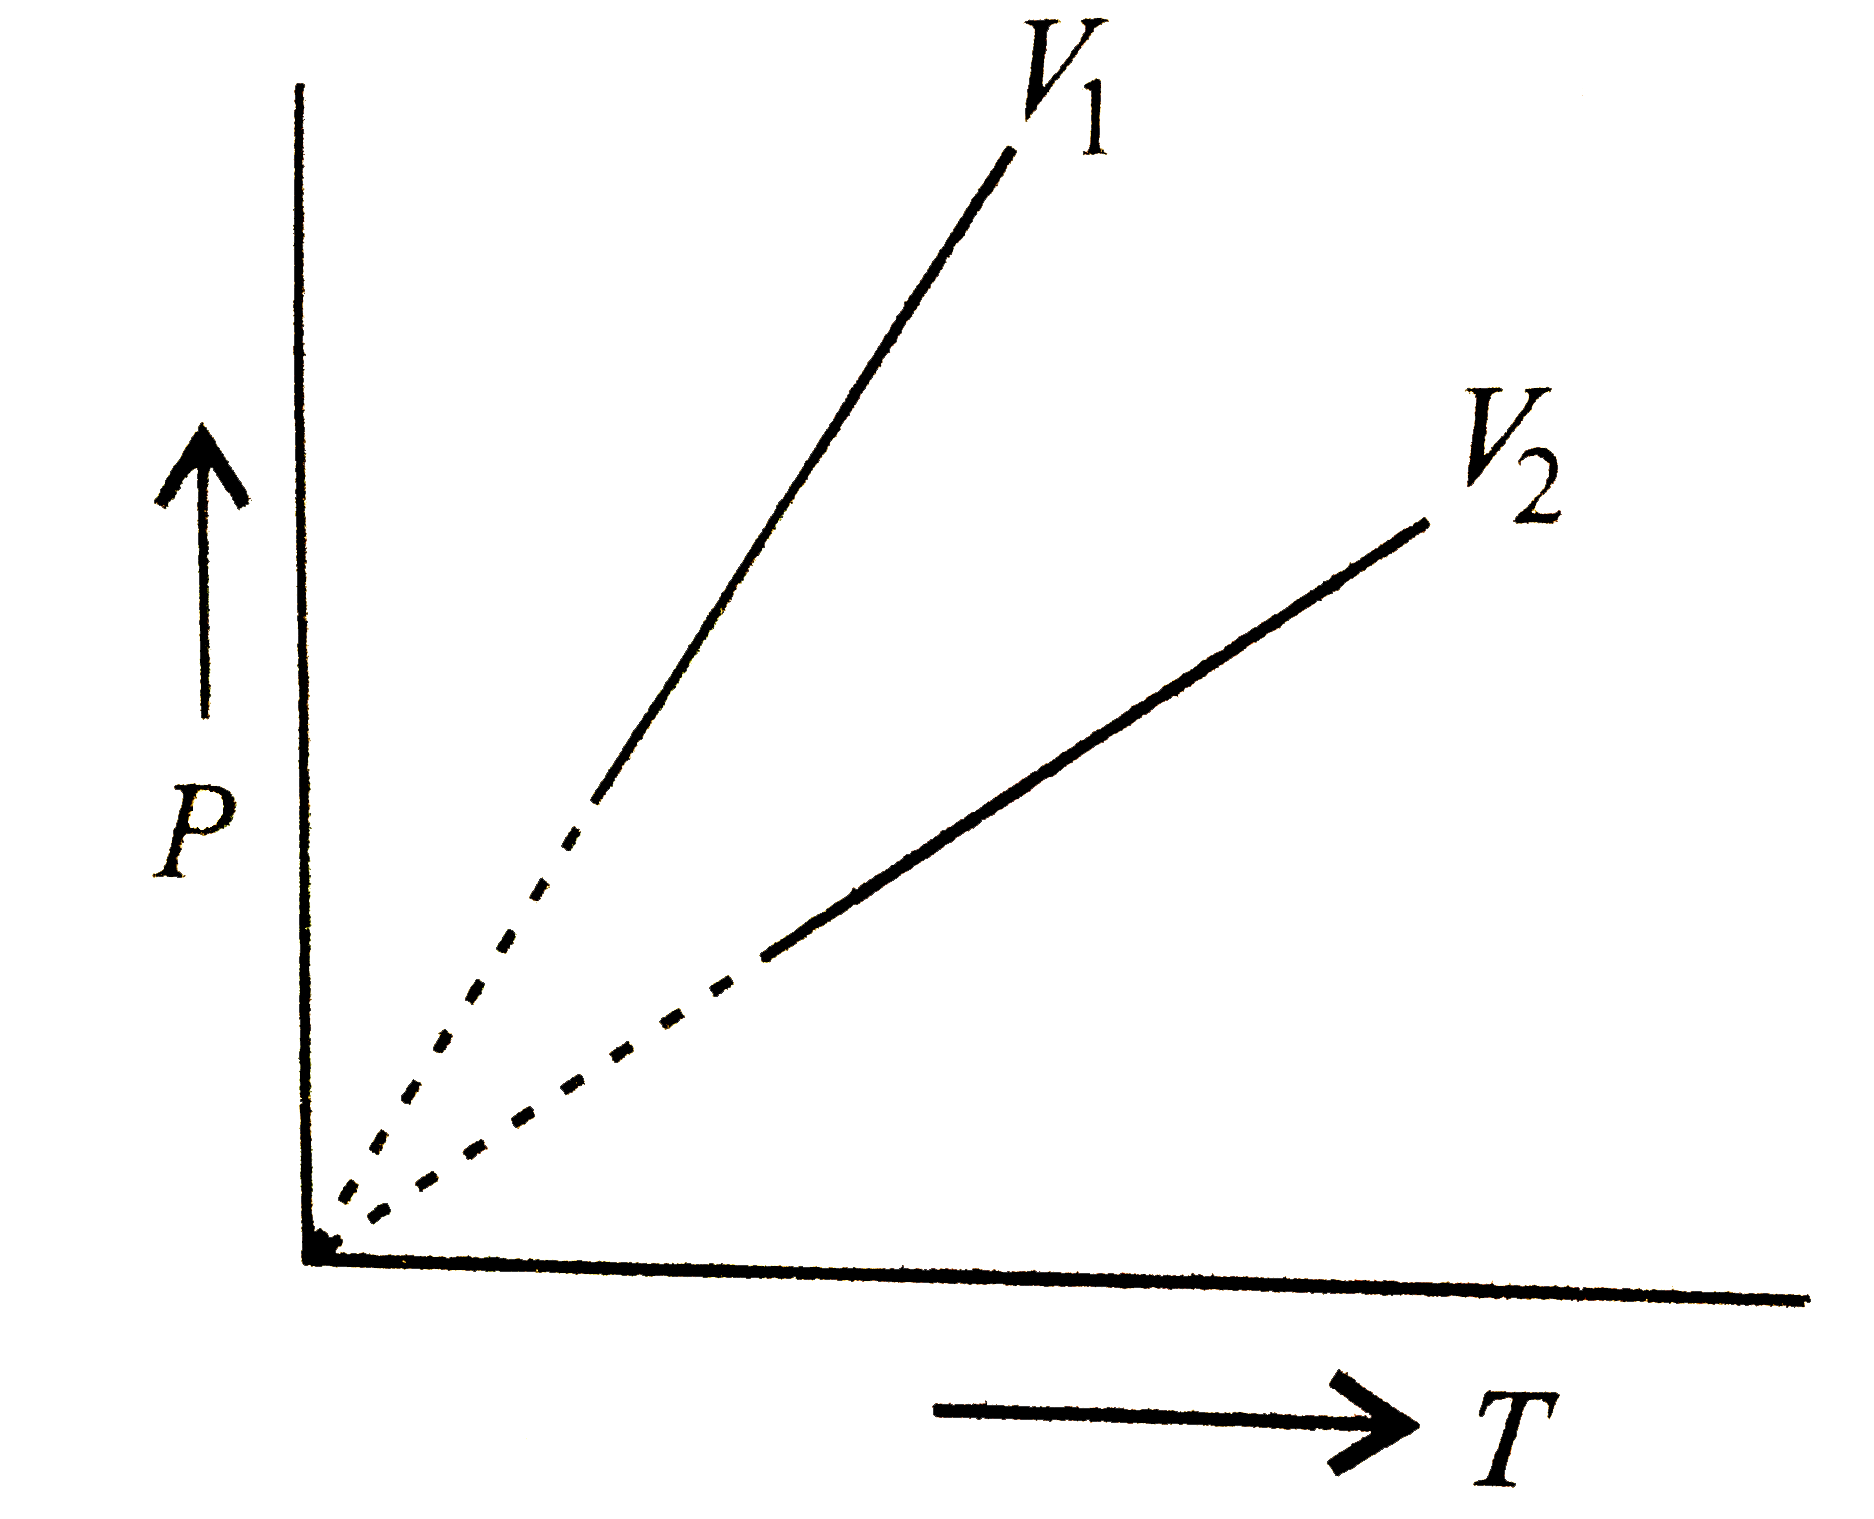
View SolutionA plot of P vs T for a given mass of gas at constant volume is a straight line . P vs T at constant volumes V1 and V2 for an ideal gas are shown below :
Which of the following is correct ?

View SolutionThe pressure and volume of a given mass of gas at a given temperature are P and V respectively. Keeping the temperature constant, the pressure is increased by 10% and the system is allowed to achieve a steady-state, then the pressure is decreased by 10% what cann be said about the final volume?
View SolutionThe percentage change in the volume of the given mass of a gas at constant temperature is 50% (increases). Calculate the percentage change in the presure of the gas.
View Solution