An observer starts moving with unifrom acceleration a towards a stationary sound soure of frequency fo. As the observer approaches the source ,the apparent frequency f heard by the observer varies with time t as
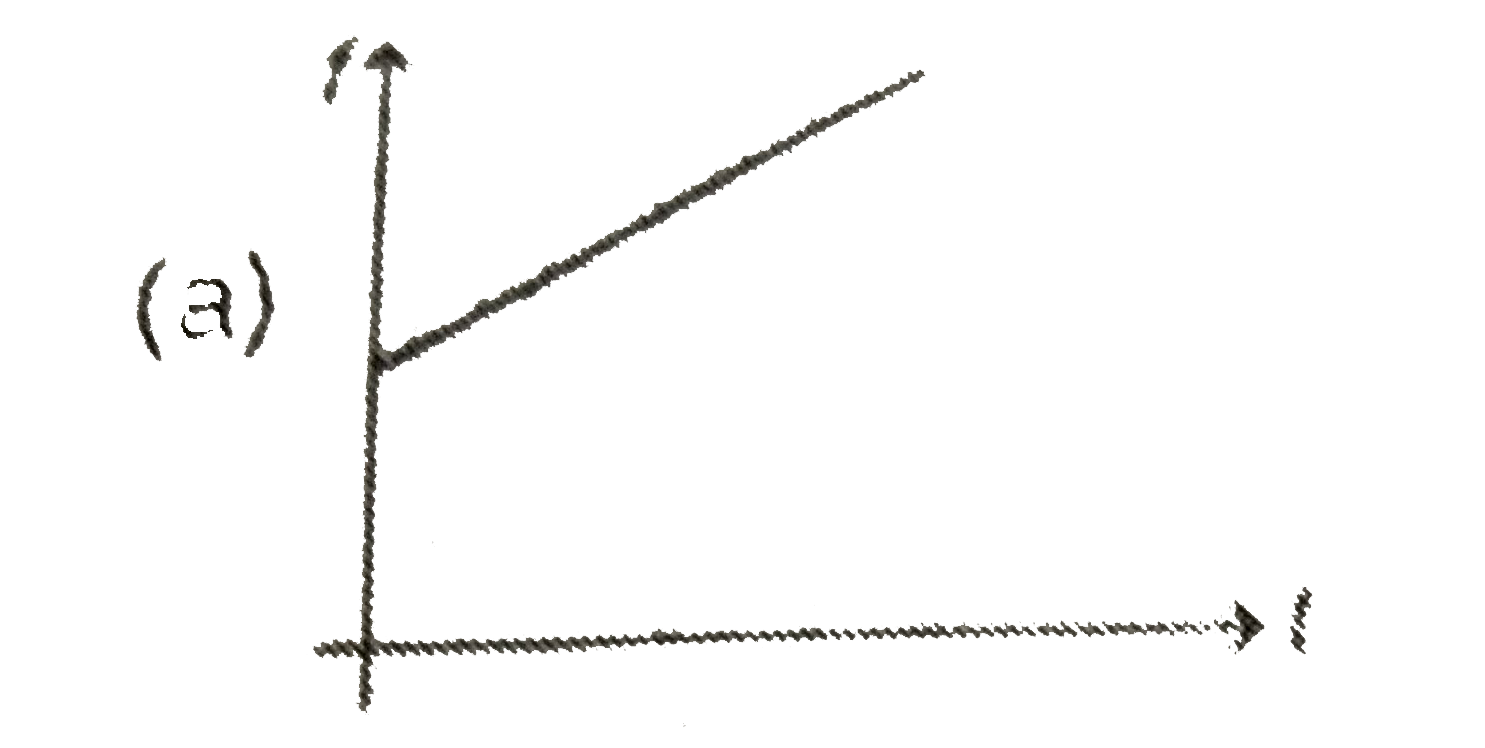
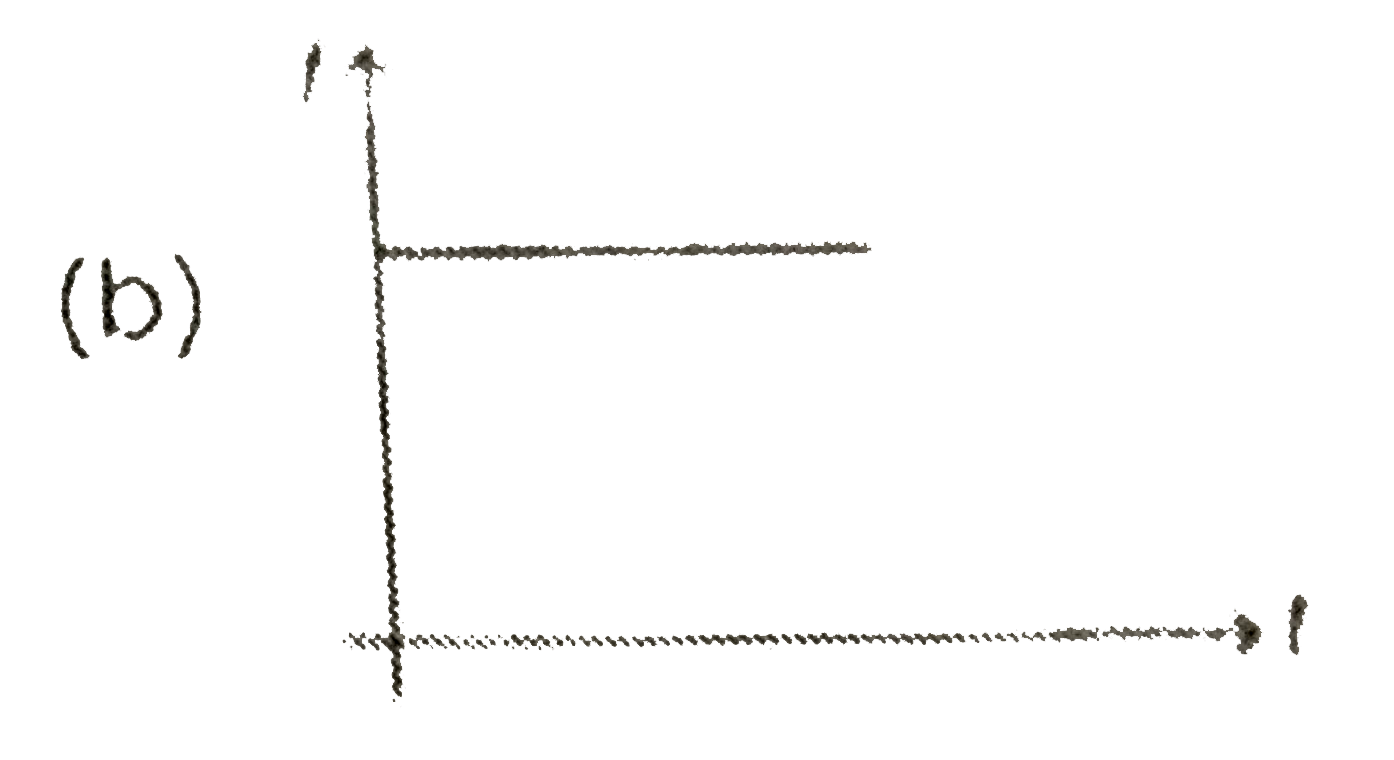
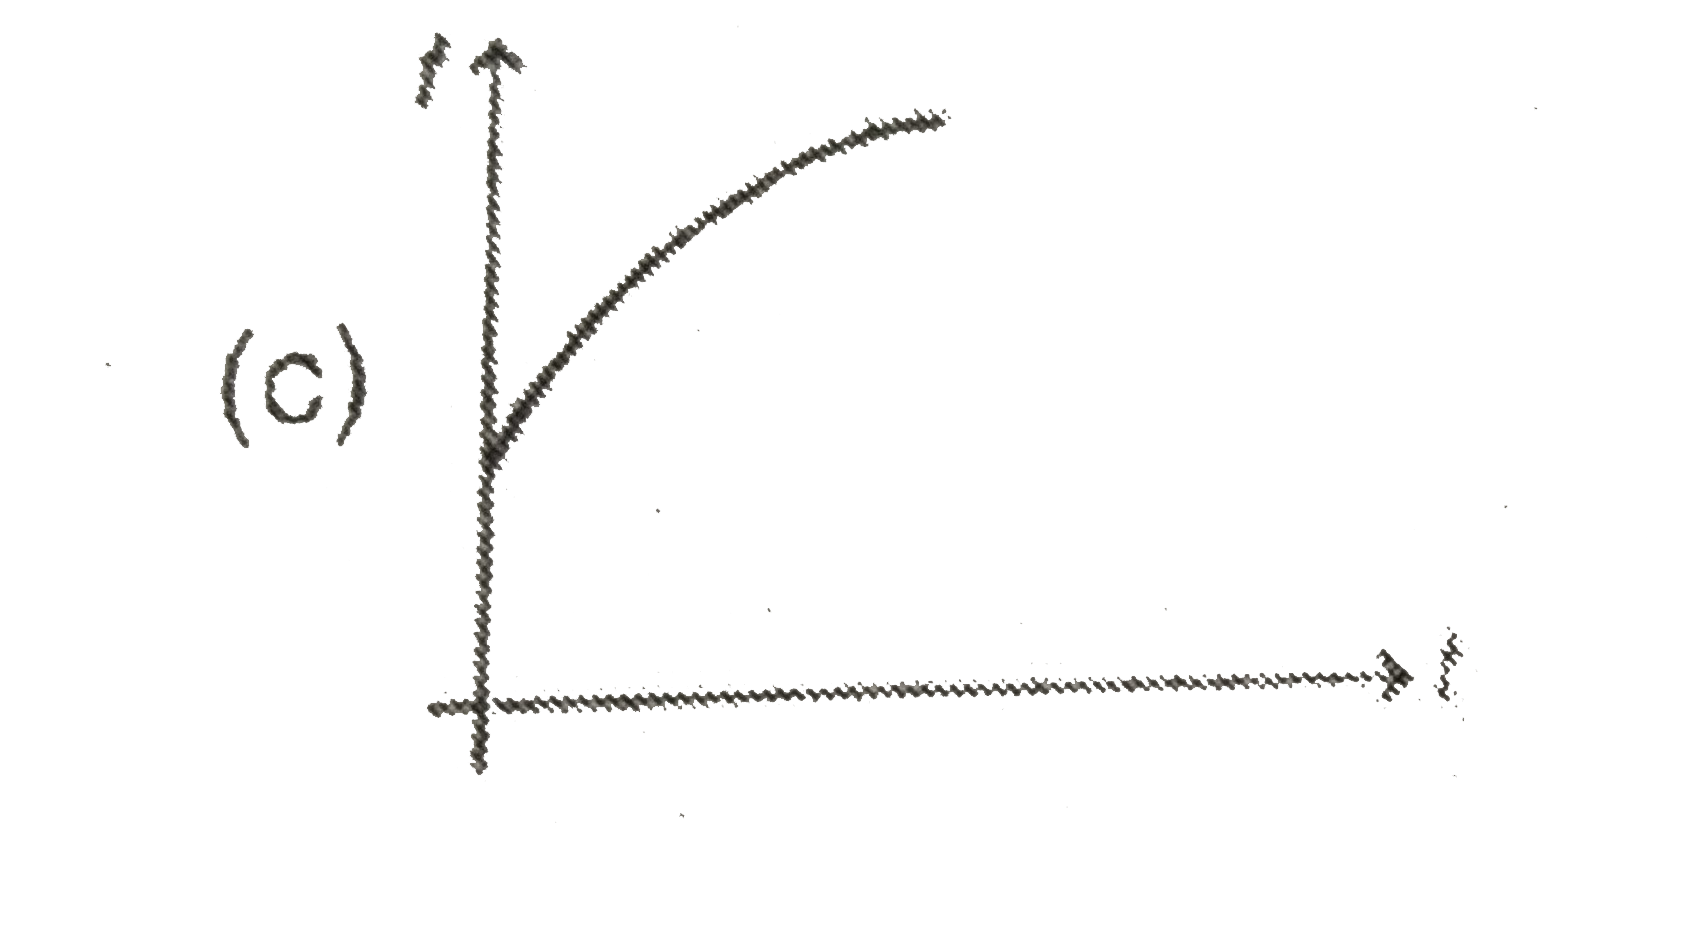
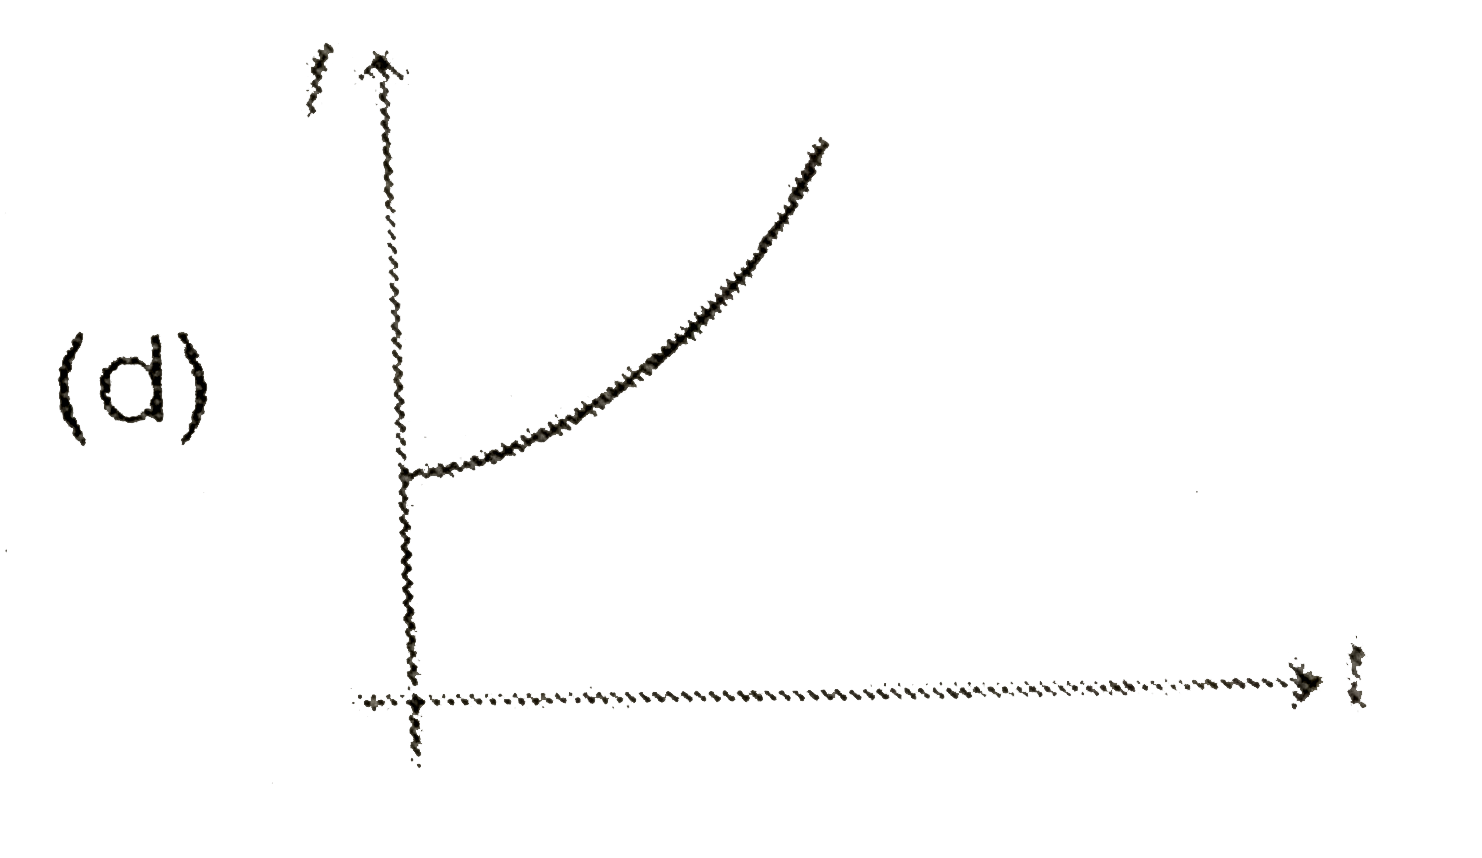
The correct Answer is:A
To solve the problem of how the apparent frequency f heard by an observer moving with uniform acceleration a towards a stationary sound source of frequency f0 varies with time t, we can follow these steps:
Step 1: Understand the Doppler Effect
The apparent frequency f is given by the formula:
f′=V+V0Vf0
where:
- f′ is the apparent frequency heard by the observer,
- V is the speed of sound,
- V0 is the speed of the observer,
- f0 is the frequency of the source.
Step 2: Determine the Speed of the Observer
Since the observer is moving with uniform acceleration a, we can express the speed of the observer V0 as:
V0=U+at
Given that the observer starts from rest, U=0, so:
V0=at
Step 3: Substitute the Observer's Speed into the Frequency Formula
Substituting V0 into the apparent frequency formula gives:
f′=V+atVf0
This can be simplified to:
f′=f0(1+atV)
Step 4: Analyze the Equation
The equation f′=f0(1+atV) indicates that the apparent frequency f′ increases linearly with time t. The term aV acts as the slope of this linear relationship.
Step 5: Identify the Graph
Since the relationship is linear, we expect a straight line graph where:
- The y-intercept is f0 (the frequency of the source when t=0),
- The slope is aVf0.
Thus, the correct graph will show a straight line starting from f0 and increasing with time.
Conclusion
The correct graph representing the variation of the apparent frequency f with time t is the one that shows a linear increase starting from f0.
---
The apparent frequency f is given by the formula:
f′=V+V0Vf0
where:
- f′ is the apparent frequency heard by the observer,
- V is the speed of sound,
- V0 is the speed of the observer,
- f0 is the frequency of the source.
Since the observer is moving with uniform acceleration a, we can express the speed of the observer V0 as:
V0=U+at
Given that the observer starts from rest, U=0, so:
V0=at
Substituting V0 into the apparent frequency formula gives:
f′=V+atVf0
This can be simplified to:
f′=f0(1+atV)
The equation f′=f0(1+atV) indicates that the apparent frequency f′ increases linearly with time t. The term aV acts as the slope of this linear relationship.
Since the relationship is linear, we expect a straight line graph where:
- The y-intercept is f0 (the frequency of the source when t=0),
- The slope is aVf0.
The correct graph representing the variation of the apparent frequency f with time t is the one that shows a linear increase starting from f0.
Topper's Solved these Questions
- WAVE MOTIONBook:DC PANDEY ENGLISHChapter:WAVE MOTIONExercise:More Than One Option is Correct
Explore 23 Videos
- WAVE MOTIONBook:DC PANDEY ENGLISHChapter:WAVE MOTIONExercise:Comprehion Type Questions
Explore 20 Videos
- WAVE MOTIONBook:DC PANDEY ENGLISHChapter:WAVE MOTIONExercise:JEE MAINS
Explore 50 Videos
- VECTORSBook:DC PANDEY ENGLISHChapter:VECTORSExercise:Medical enrances gallery
Explore 9 Videos
- WORK, ENERGY & POWERBook:DC PANDEY ENGLISHChapter:WORK, ENERGY & POWERExercise:Level 2 Comprehension Based
Explore 2 Videos
Similar Questions
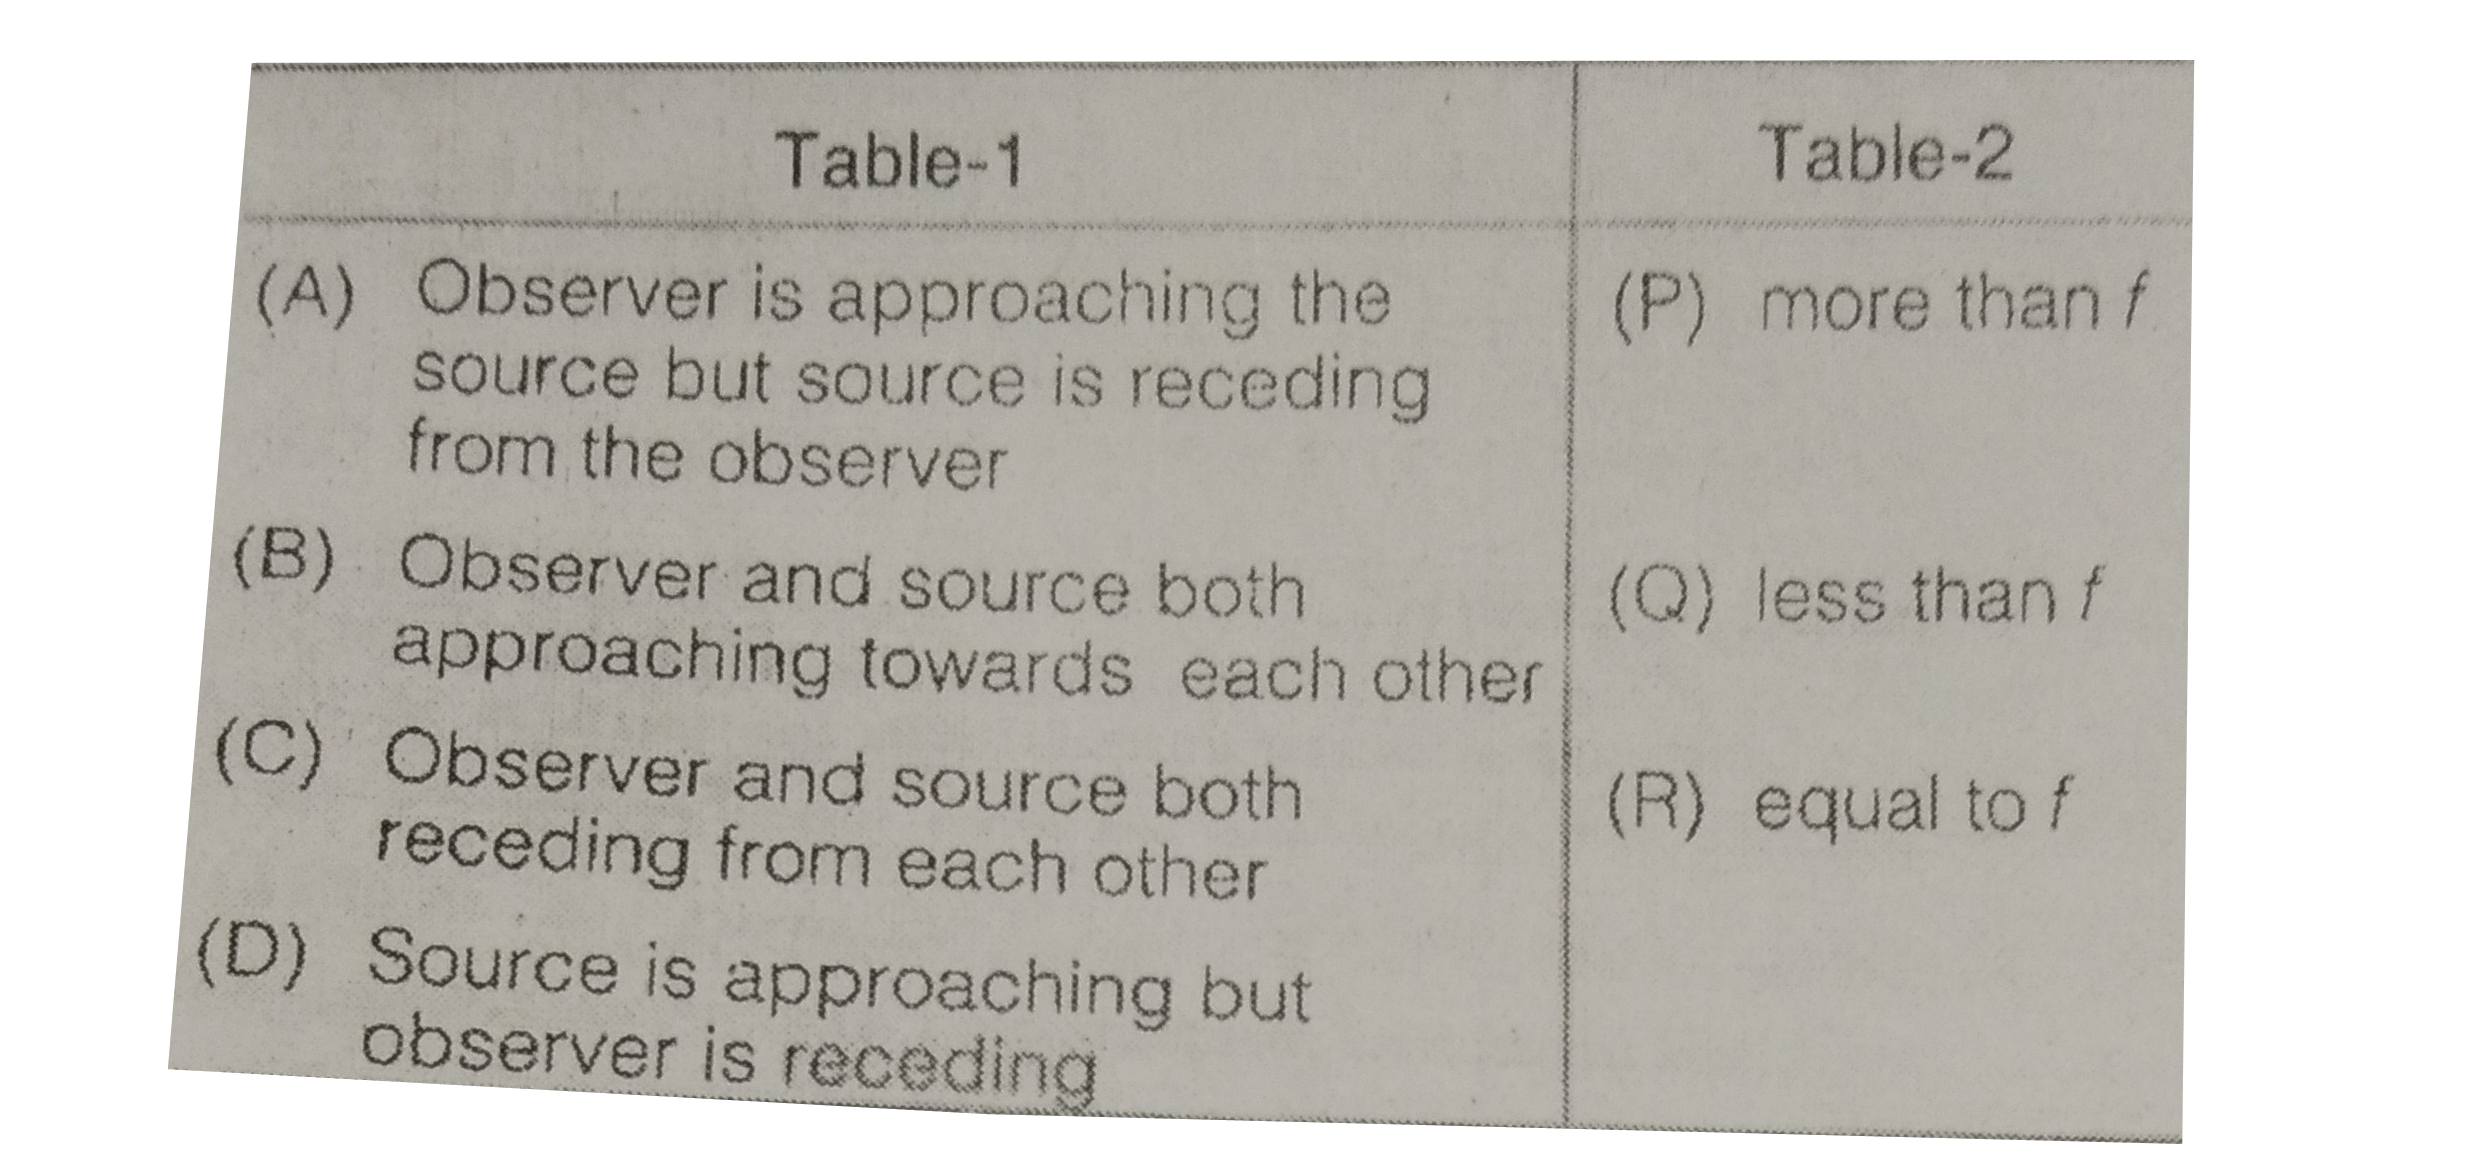
A sound source has frequency f. Source and observer both have same speed.For the apparent frequency observed by observer match the following.
View Solutionin which of the following case frequency of sound heard by the observer increases?
View SolutionAn observer moves with a constant acceleration towards a fixed source and start decelerating as soon as it passes the sound source. The variation of frequency f by observer with time t is best shown by
View Solution(A): When an observer moves towards a stationary source, the frequency of sound heard is greater than the actual frequency
(R) : Apparent frequency increases because the observer intercepts more number of waves when he moves towards the source.
View Solutionsource and observer both start moving simultaneously from origion one along y - axis with speed of source = 2 (speed of observer ). The graph between the apparent frequency observed by observer (f) and time (t) would be
View SolutionA source of sound S is moving with a velocity of 50m/s towards a stationary observer. The observer measures the frequency of the source as 1000 Hz. What will be the apparent frequency of the source as 1000 Hz. What will be the apparent frequency of the source when it is moving away from the observer after crossing him? The velocity of the sound in the medium is 350m/s
View SolutionA source of sound S is moving with a velocity of 50m/s towards a stationary observer. The observer measures the frequency of the source as 1000 Hz. What will be the apparent frequency of the source as 1000 Hz. What will be the apparent frequency of the source when it is moving away from the observer after crossing him? The velocity of the sound in the medium is 350m/s
View SolutionAn observer is moving with half the speed of light towards a stationary microwave source emitting waves at frequency 10 GhHz. What is the frequency of the microwave measured by the observer? (speed of light=3×10⁸ms)
View SolutionA source of sound emitting a note of frequency 200 Hz moves towards an observer with a velocity v equal to the velocity of sound. If the observer also moves away from the source with the same velocity v, the apparent frequency heard by the observer is
View SolutionA source of sound is travelling towards a stationary observer. The frequency of sound heard by the observer is 25% more that the actual frequency. If the speed of sound is v, that of the source is
View Solution
