Figure shows the position of a particle moving on the x - axis as a function of time
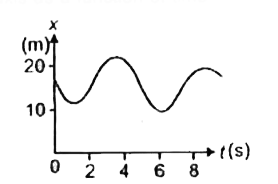
The particle has come to rest 4 times
The velocity at t = 8 s is negative
The velocity remains positive for t = 2 s to t = 6 s
The particle moves with constant velocity.
The correct Answer is:A
Step by step video & image solution for Figure shows the position of a particle moving on the x - axis as a function of time by Physics experts to help you in doubts & scoring excellent marks in Class 12 exams.
Updated on:21/07/2023Topper's Solved these Questions
- MOTION IN A STRAIGHT LINEBOOK - AAKASH INSTITUTE ENGLISHCHAPTER - MOTION IN A STRAIGHT LINEEXERCISE - ASSIGNMENT (SECTION - B)
33 Videos
- MOTION IN A STRAIGHT LINEBOOK - AAKASH INSTITUTE ENGLISHCHAPTER - MOTION IN A STRAIGHT LINEEXERCISE - ASSIGNMENT (SECTION - C)
36 Videos
- MOTION IN A STRAIGHT LINEBOOK - AAKASH INSTITUTE ENGLISHCHAPTER - MOTION IN A STRAIGHT LINEEXERCISE - EXERCISE
29 Videos
- MOTION IN A PLANEBOOK - AAKASH INSTITUTE ENGLISHCHAPTER - MOTION IN A PLANEEXERCISE - Assignement section -J (Aakash Challengers Questions)
7 Videos
- MOTION IN STRAIGHT LINEBOOK - AAKASH INSTITUTE ENGLISHCHAPTER - MOTION IN STRAIGHT LINEEXERCISE - Assignment (SECTION - J)
2 Videos
Similar Questions
Figure shows the displacement of a particle going along the X-axis as a function of time. The force acting on the particle is zero in the region

View SolutionFigure shows the position-time graph of a particle moving on the X--axis. Which of these option correctly describes the particle 's motion?
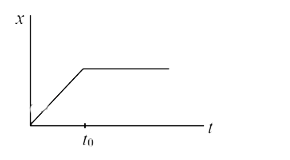
View SolutionFigure shows the graph of x-coordinate of a particle moving along x-axis as a function of time. Average velocity during t = 0 to 4 s and instantaneous velocity at t = 4.113 s respectively will be
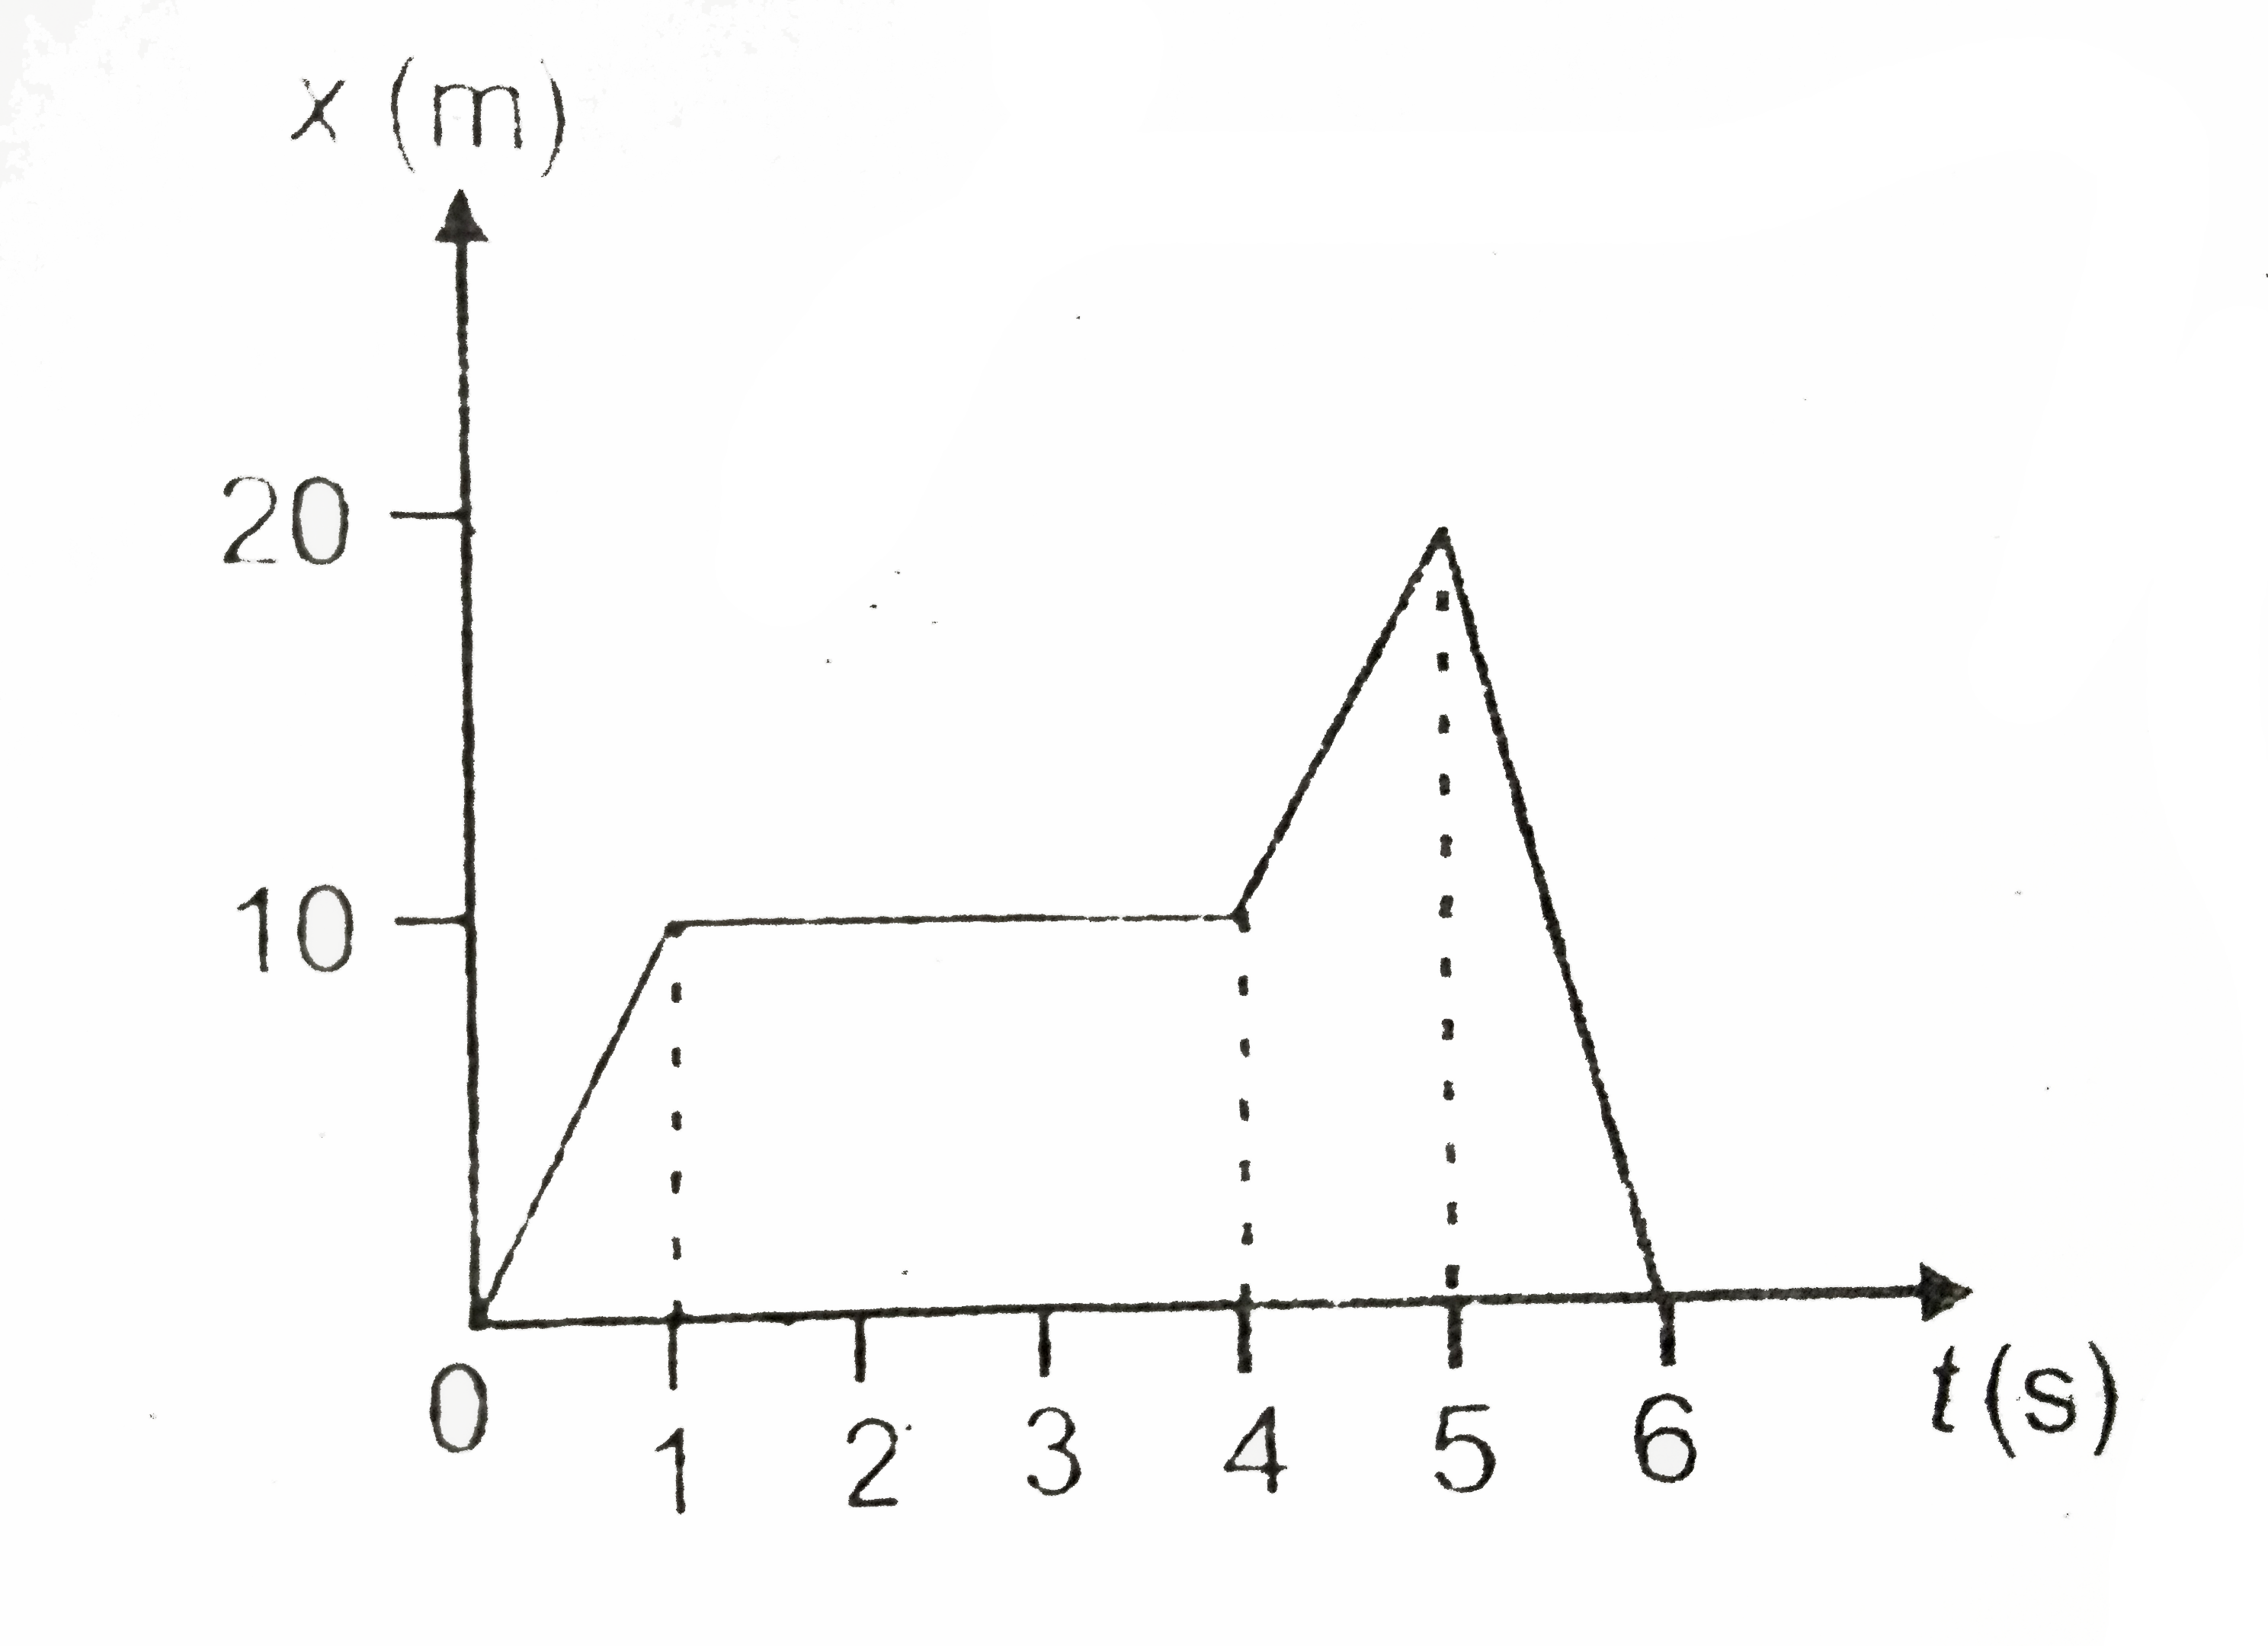
View SolutionFigure shows the graph of the x-coordinaste of a particle going along the X-axis as a function of time.Find a. te average velocity during 0 to 10s, b. instantaneous velocity at 2,5,8 and 12s.
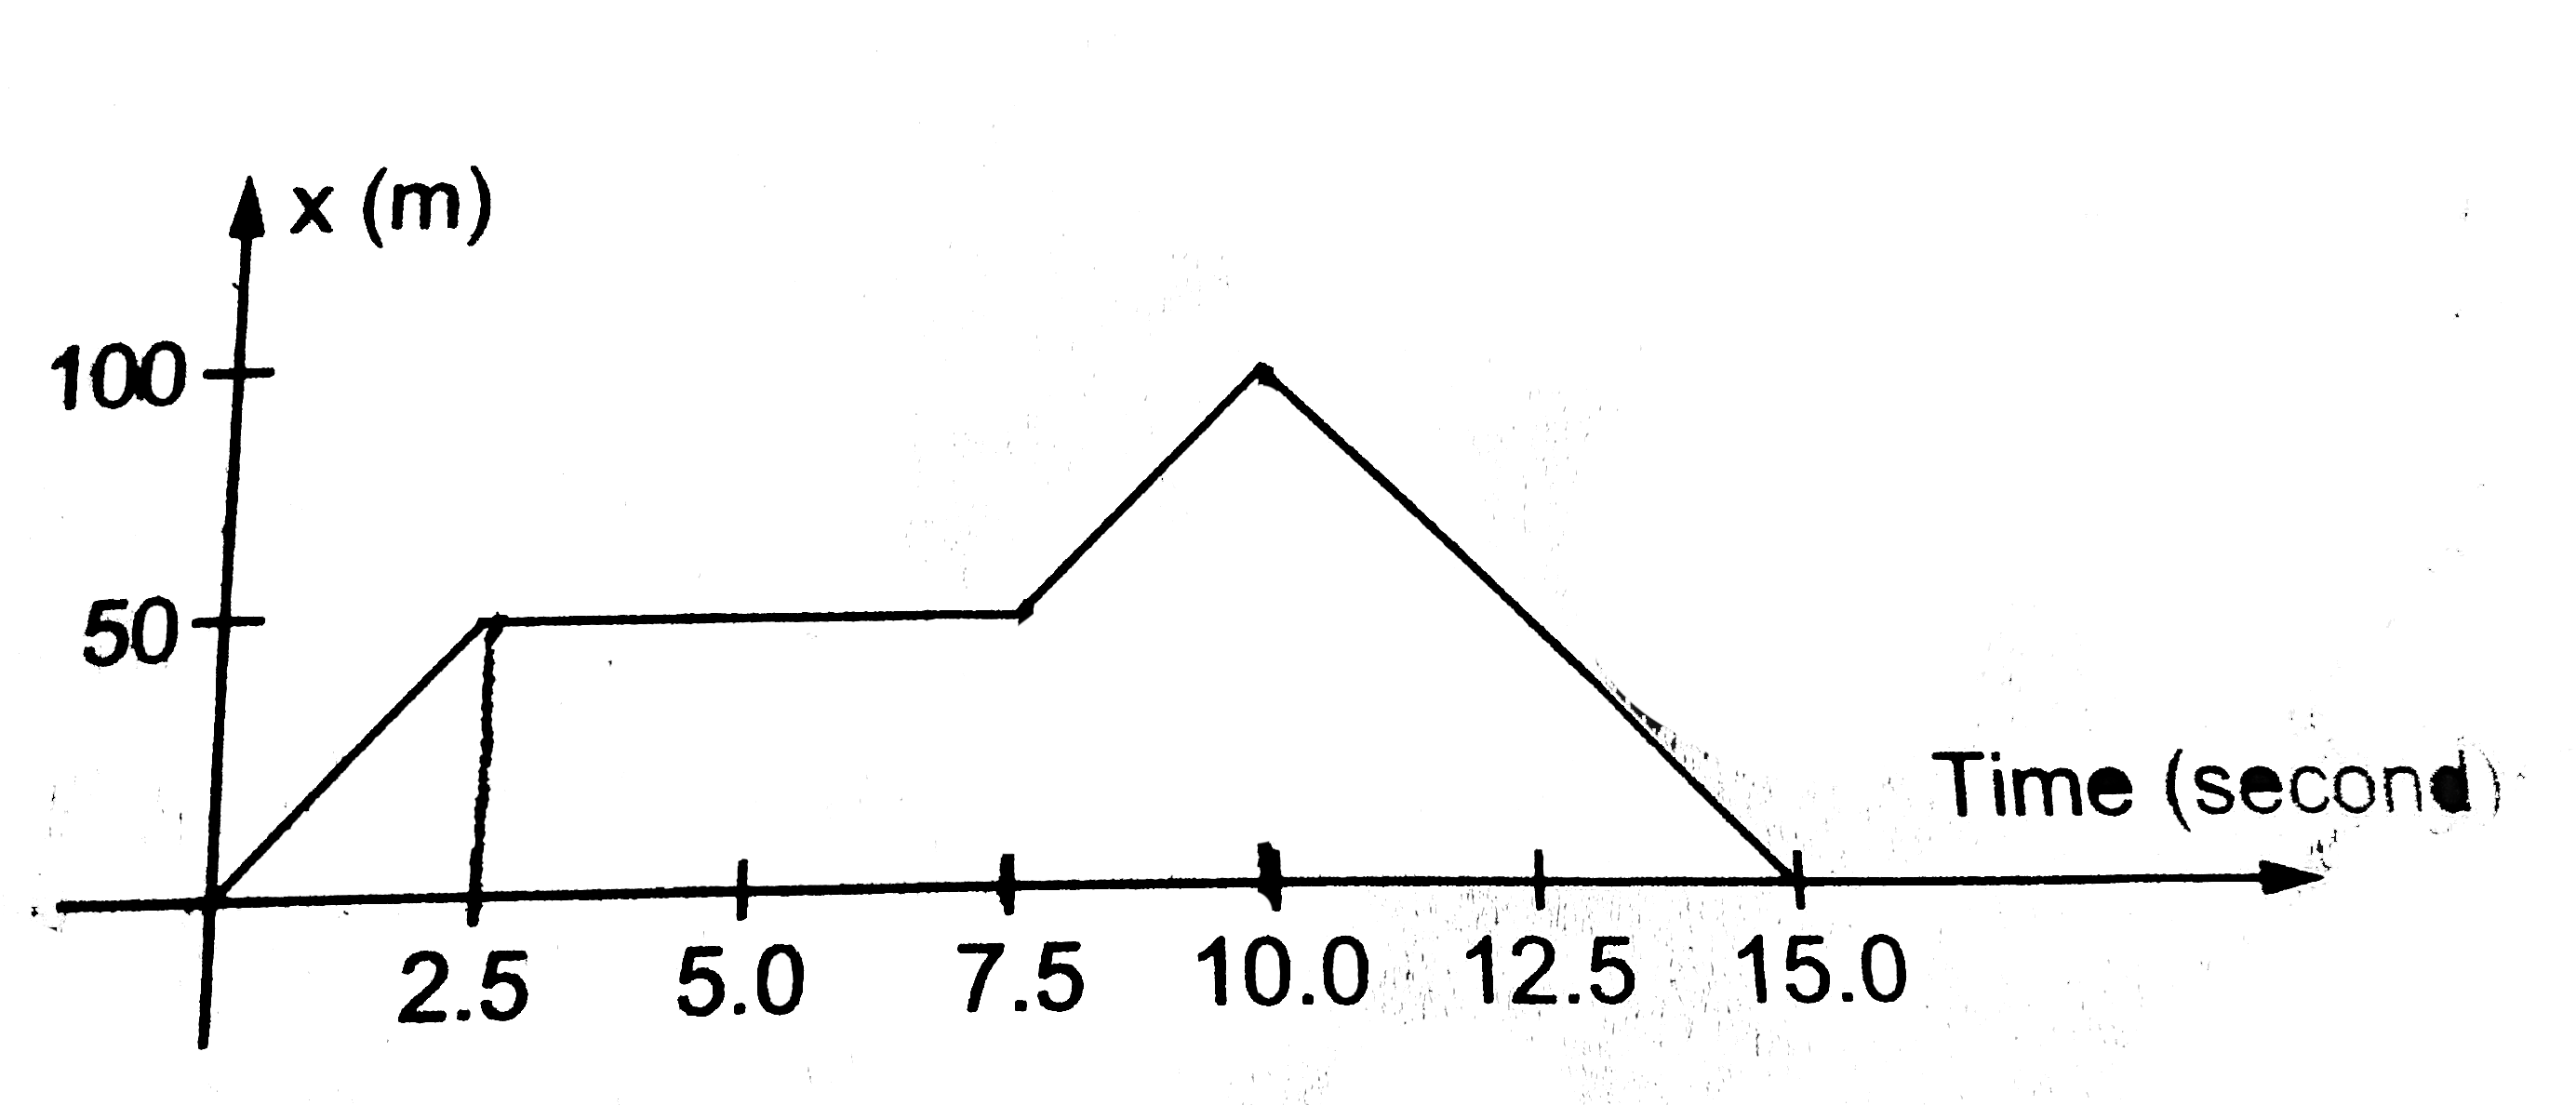
View SolutionFigure shows the graph of x - coordinate of a particle moving along x - axis as a function of time. Average velocity during t = 0 to 6 s and instantaneous velocity at t = 3 s respectively, will be
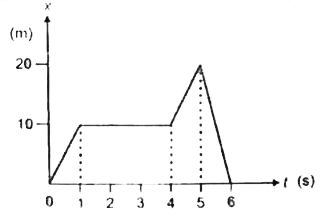
View SolutionFigure shows the displacement time graph of a particle moving on the X-axis

View SolutionFigure shows the displacement-time graph of a particle moving on the X-axis

View SolutionFigure shows the velocity of a particle moving on x-axis.
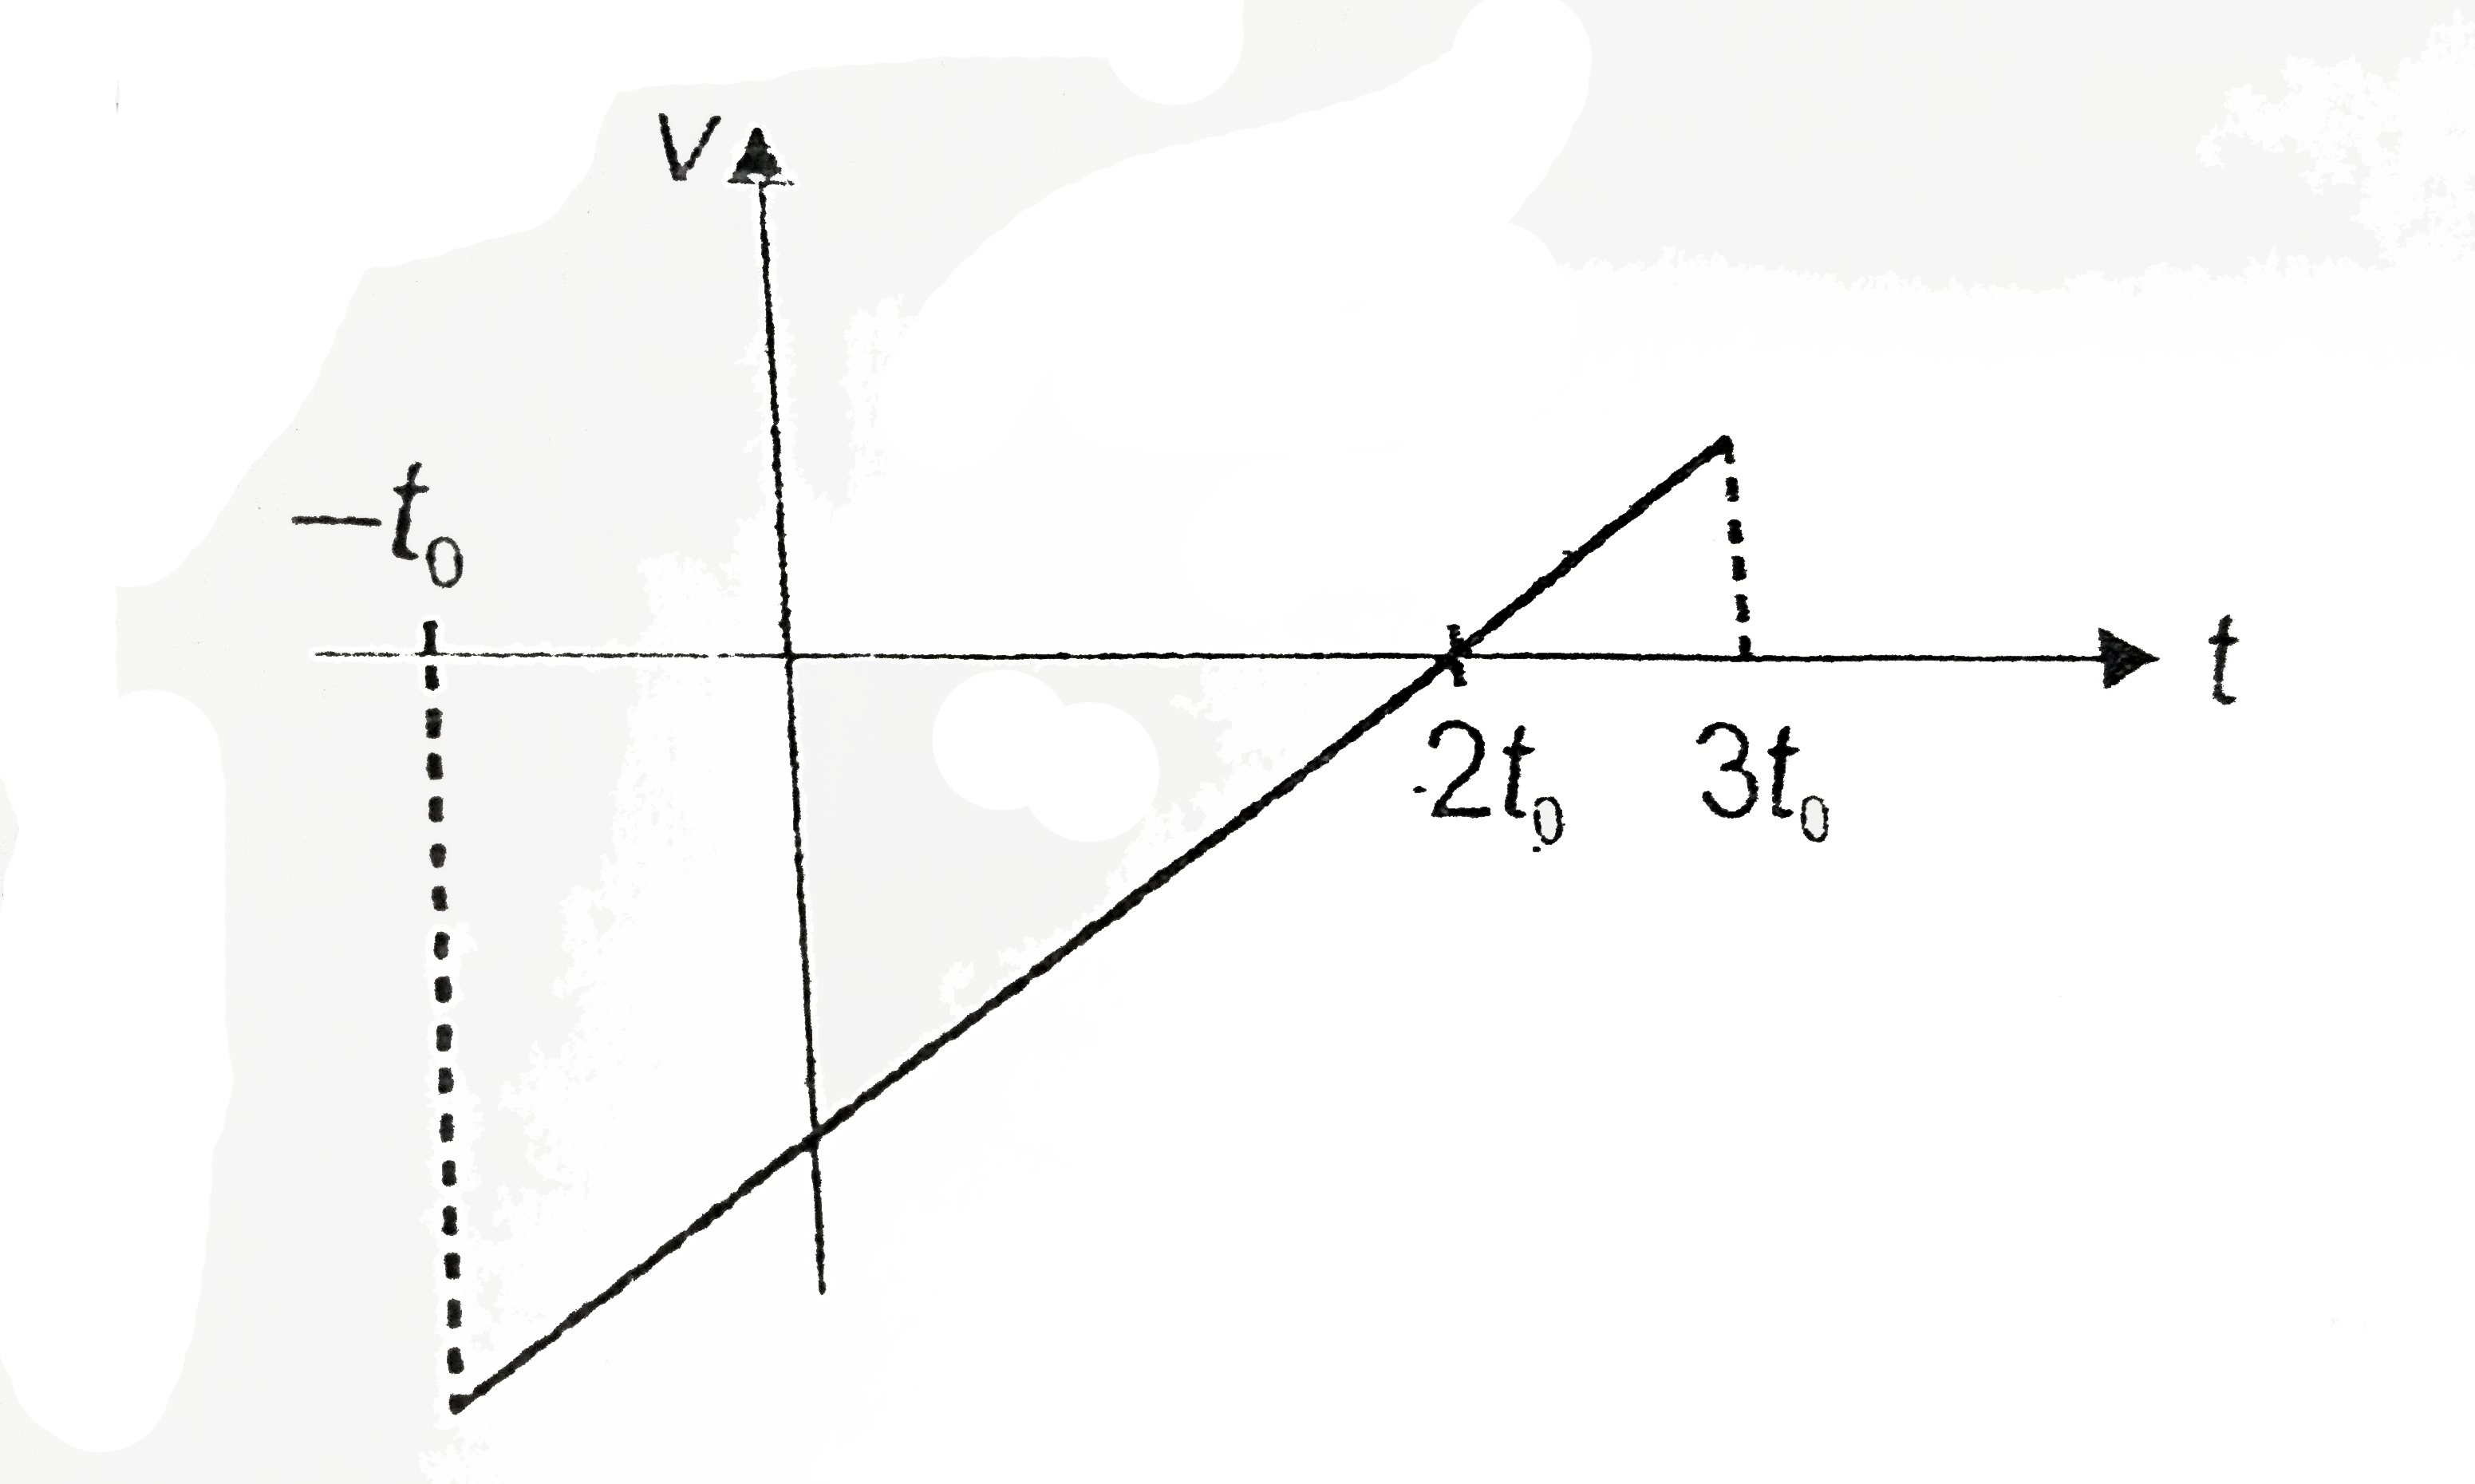
Which of the following statement is correct for the interval shown in graph?
View Solution(a) The position of a particle moving along the x-axis depends on the time according to equation. x=(3t2−t3) m. At what time does the particle reaches its maximum x-position?
(b) What is the displacement during the first 4s.
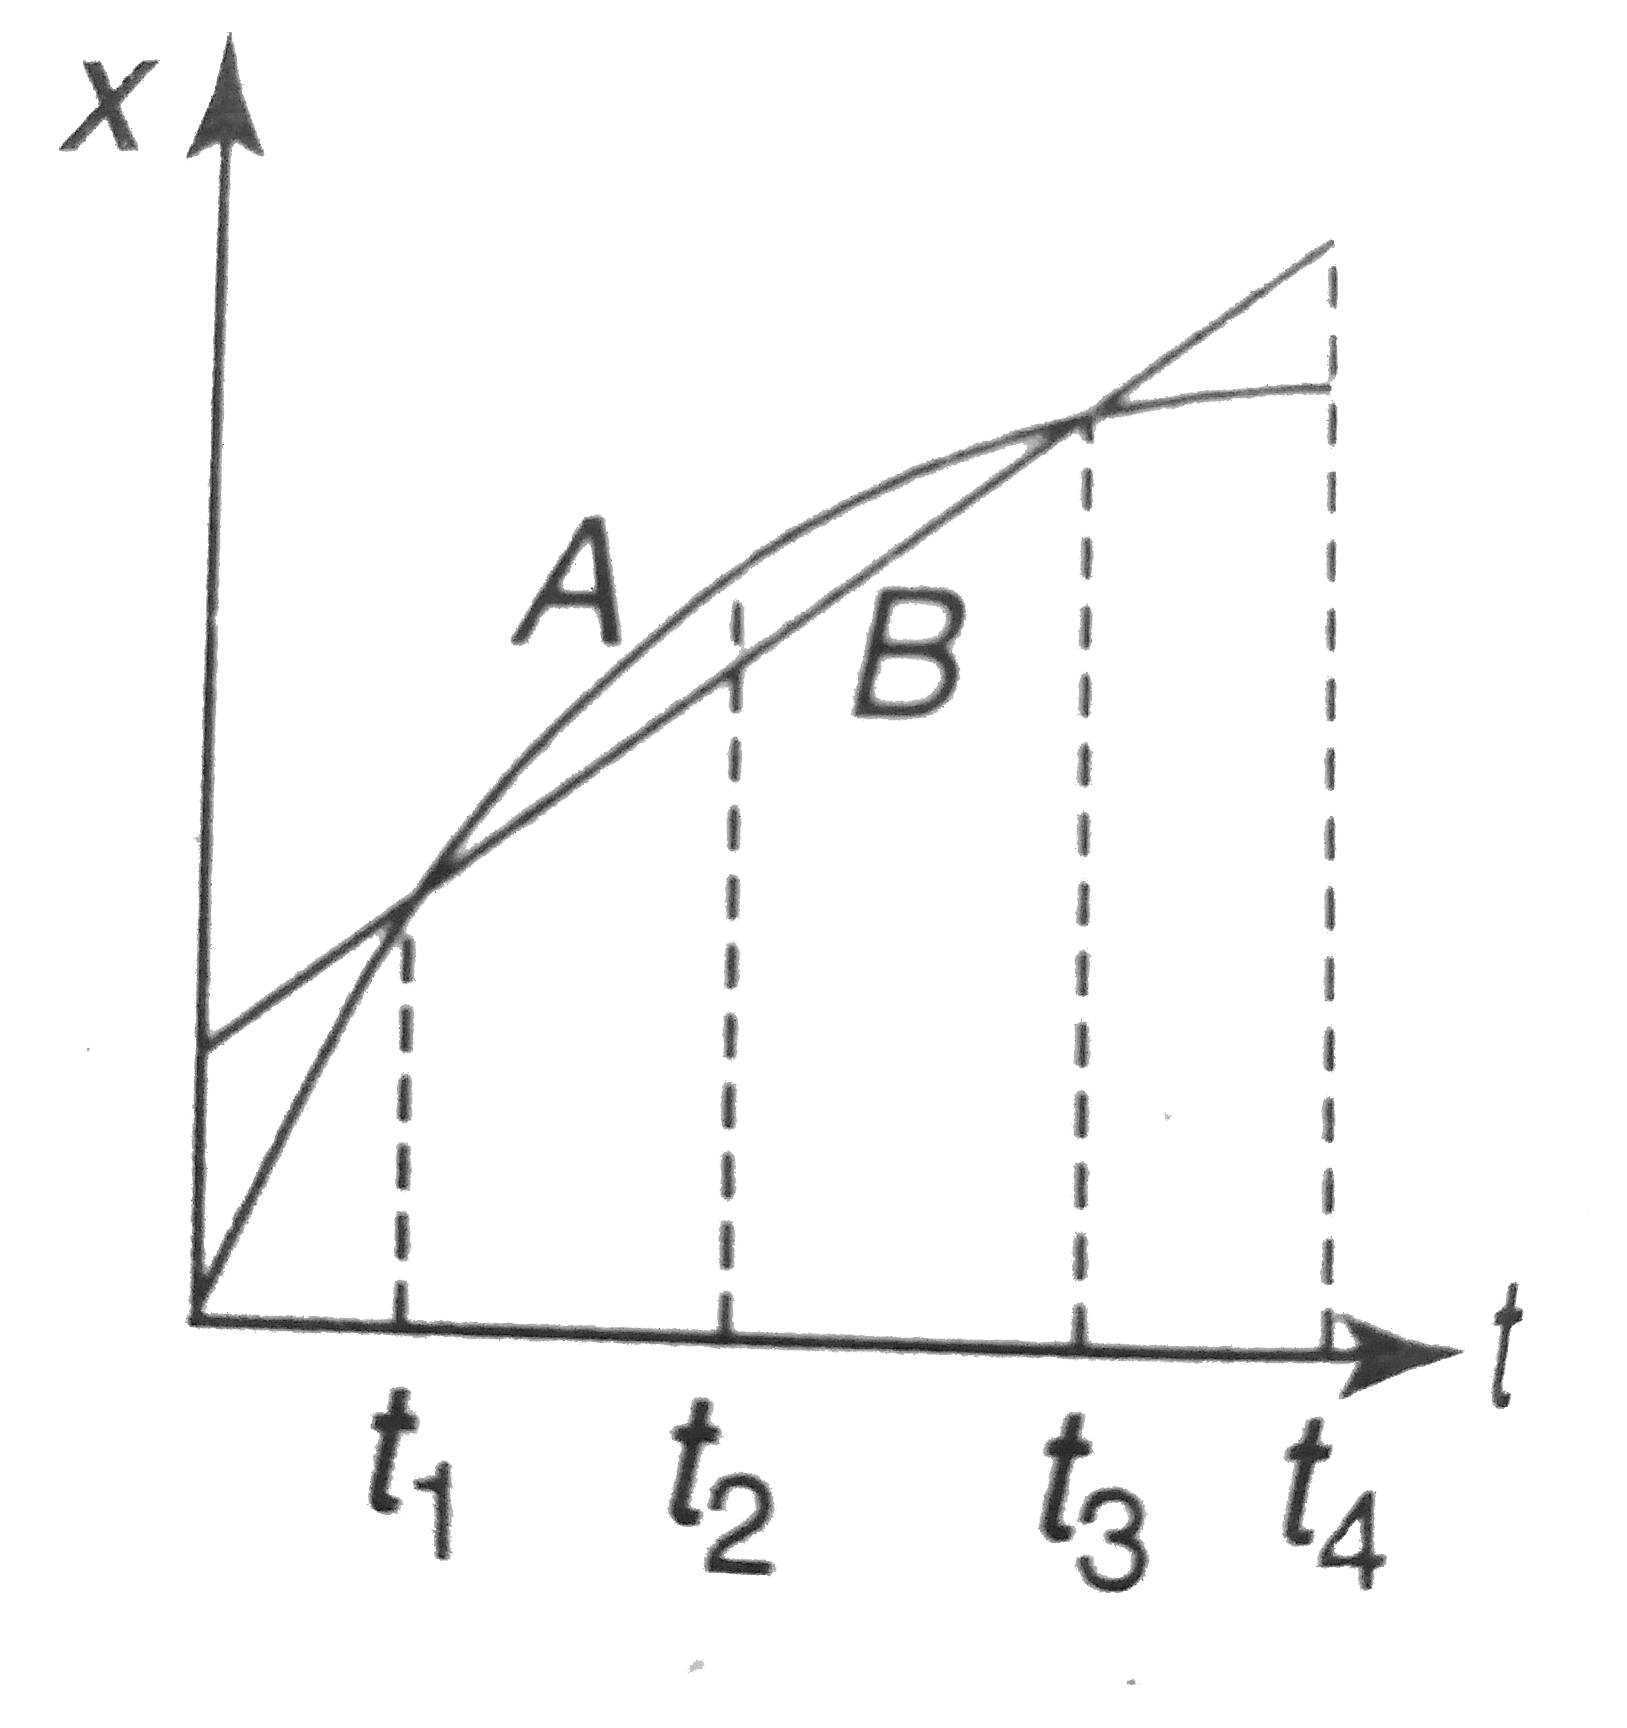
View SolutionThe graph given shows the positions of two cars, AandB, as a function of time. The cars move along the x-axis on parallel but separate tracks, so that they can pass each other's position without colliding. At which instant in time is car-A overtaking the car-B ?
View Solution
