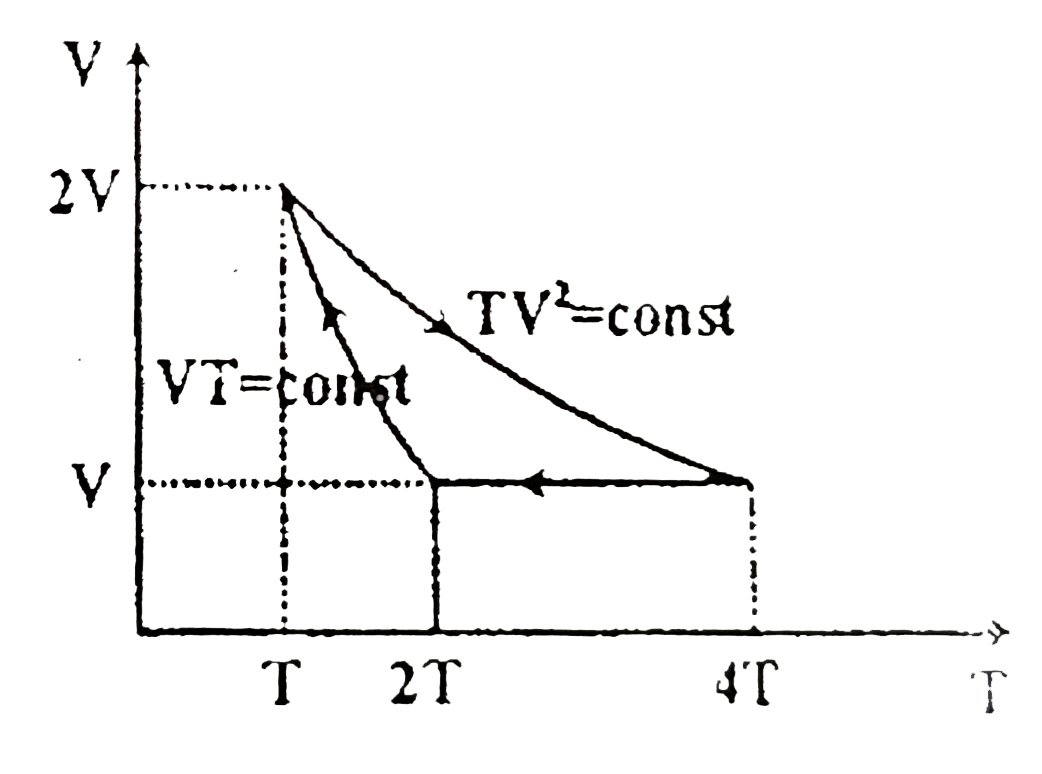
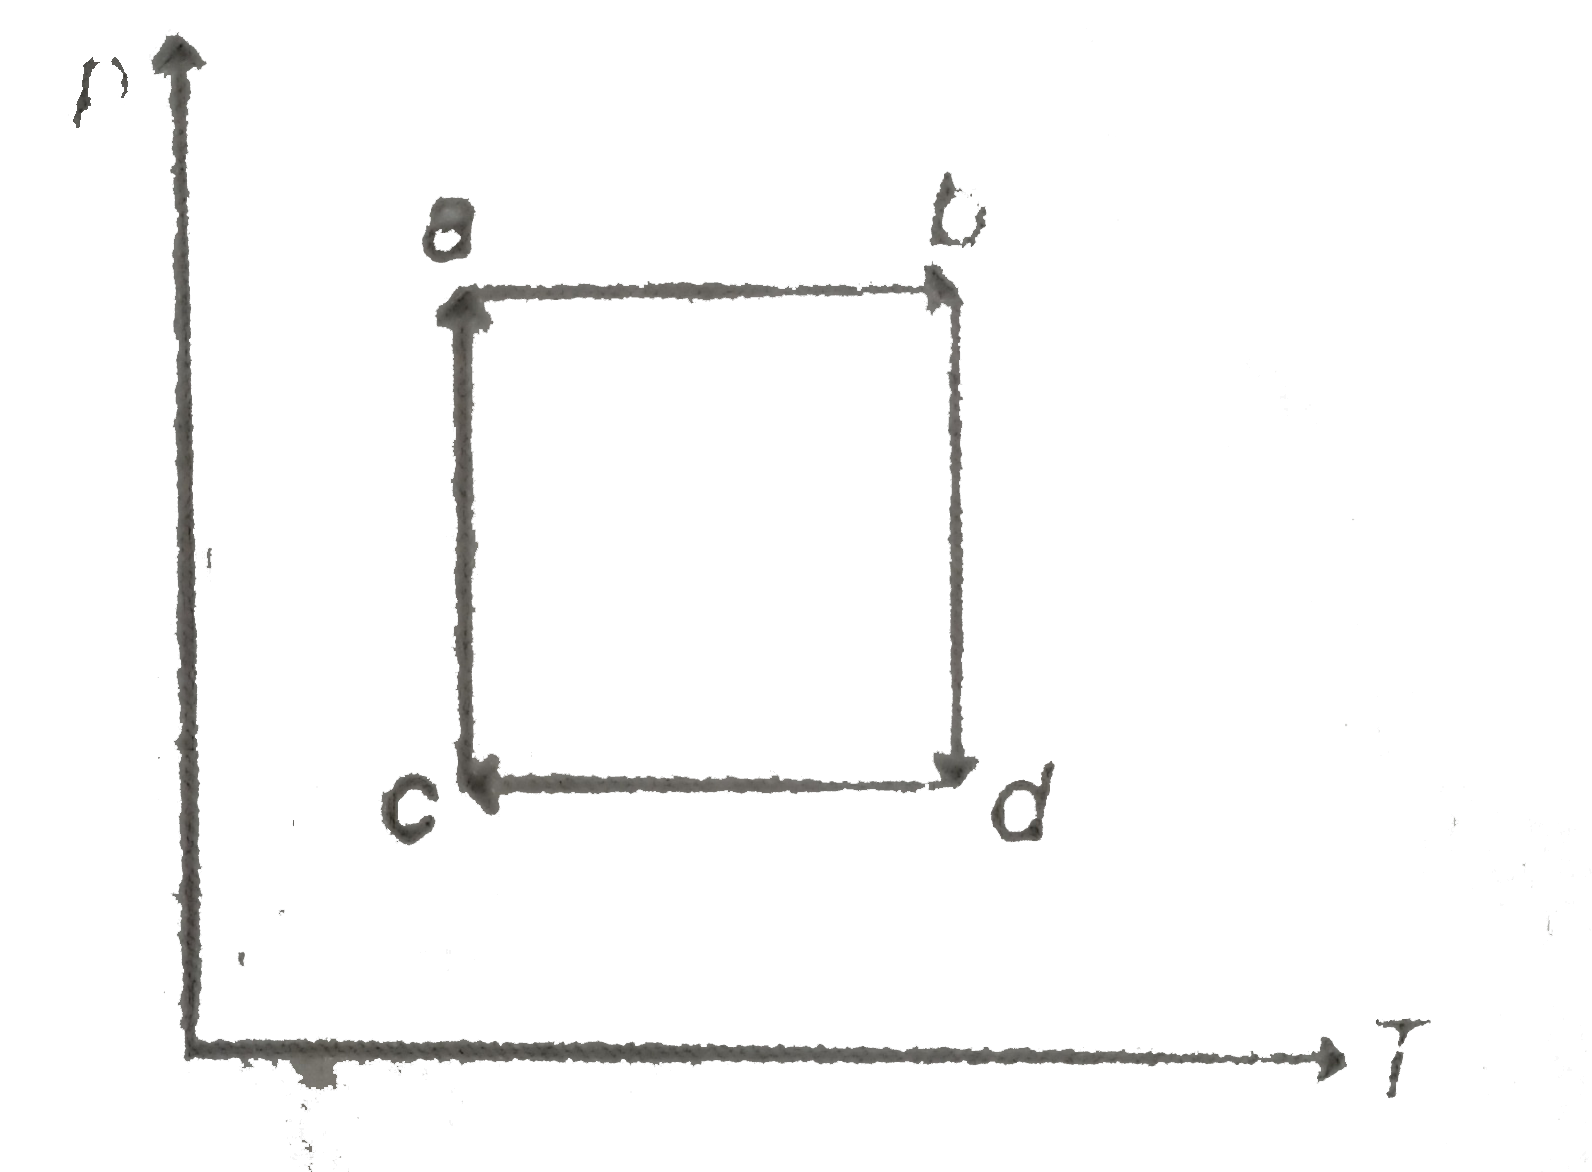
Figure shows the VT diagram for helium gas in a cyclic process. Find the ratio of maximum and minimum pressure.
2
4
6
8
The correct Answer is:D
Step by step video & image solution for Figure shows the VT diagram for helium gas in a cyclic process. Find the ratio of maximum and minimum pressure. by Physics experts to help you in doubts & scoring excellent marks in Class 11 exams.
Updated on:21/07/2023Topper's Solved these Questions
Similar Questions
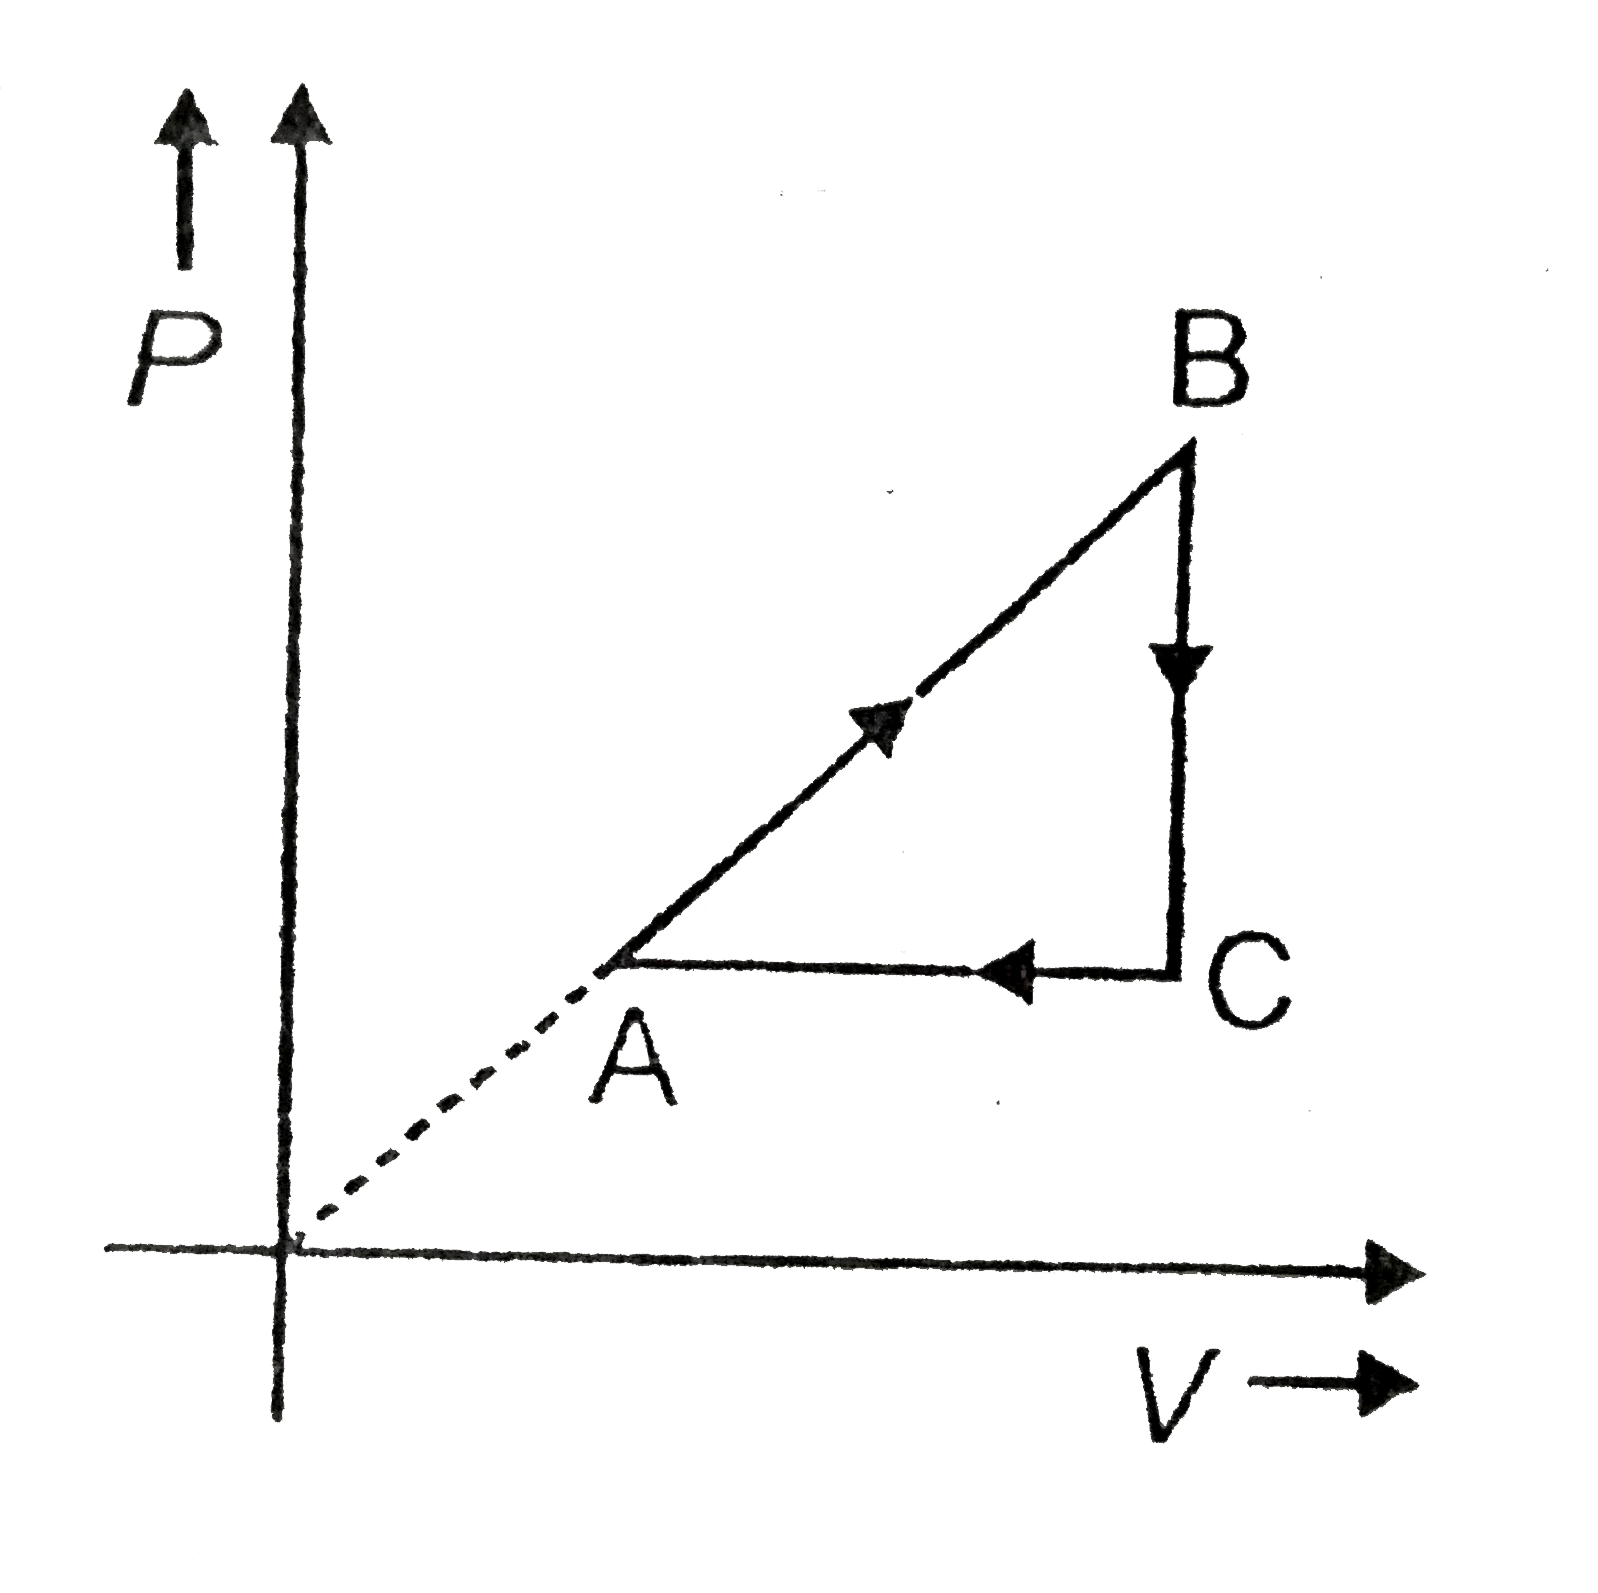
An ideal monoatomic gas goes through a cyclic process. Ratio of maximum temperature and minimum temperature is 2. find efficiency of cycle.
 .
.
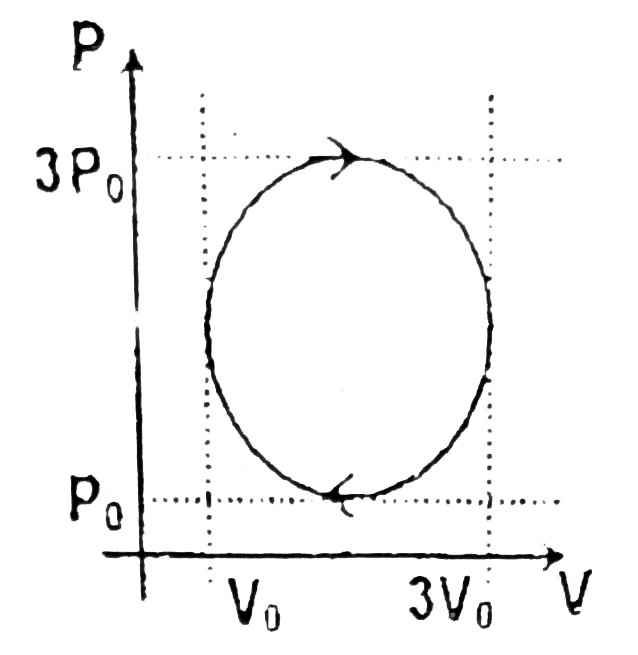
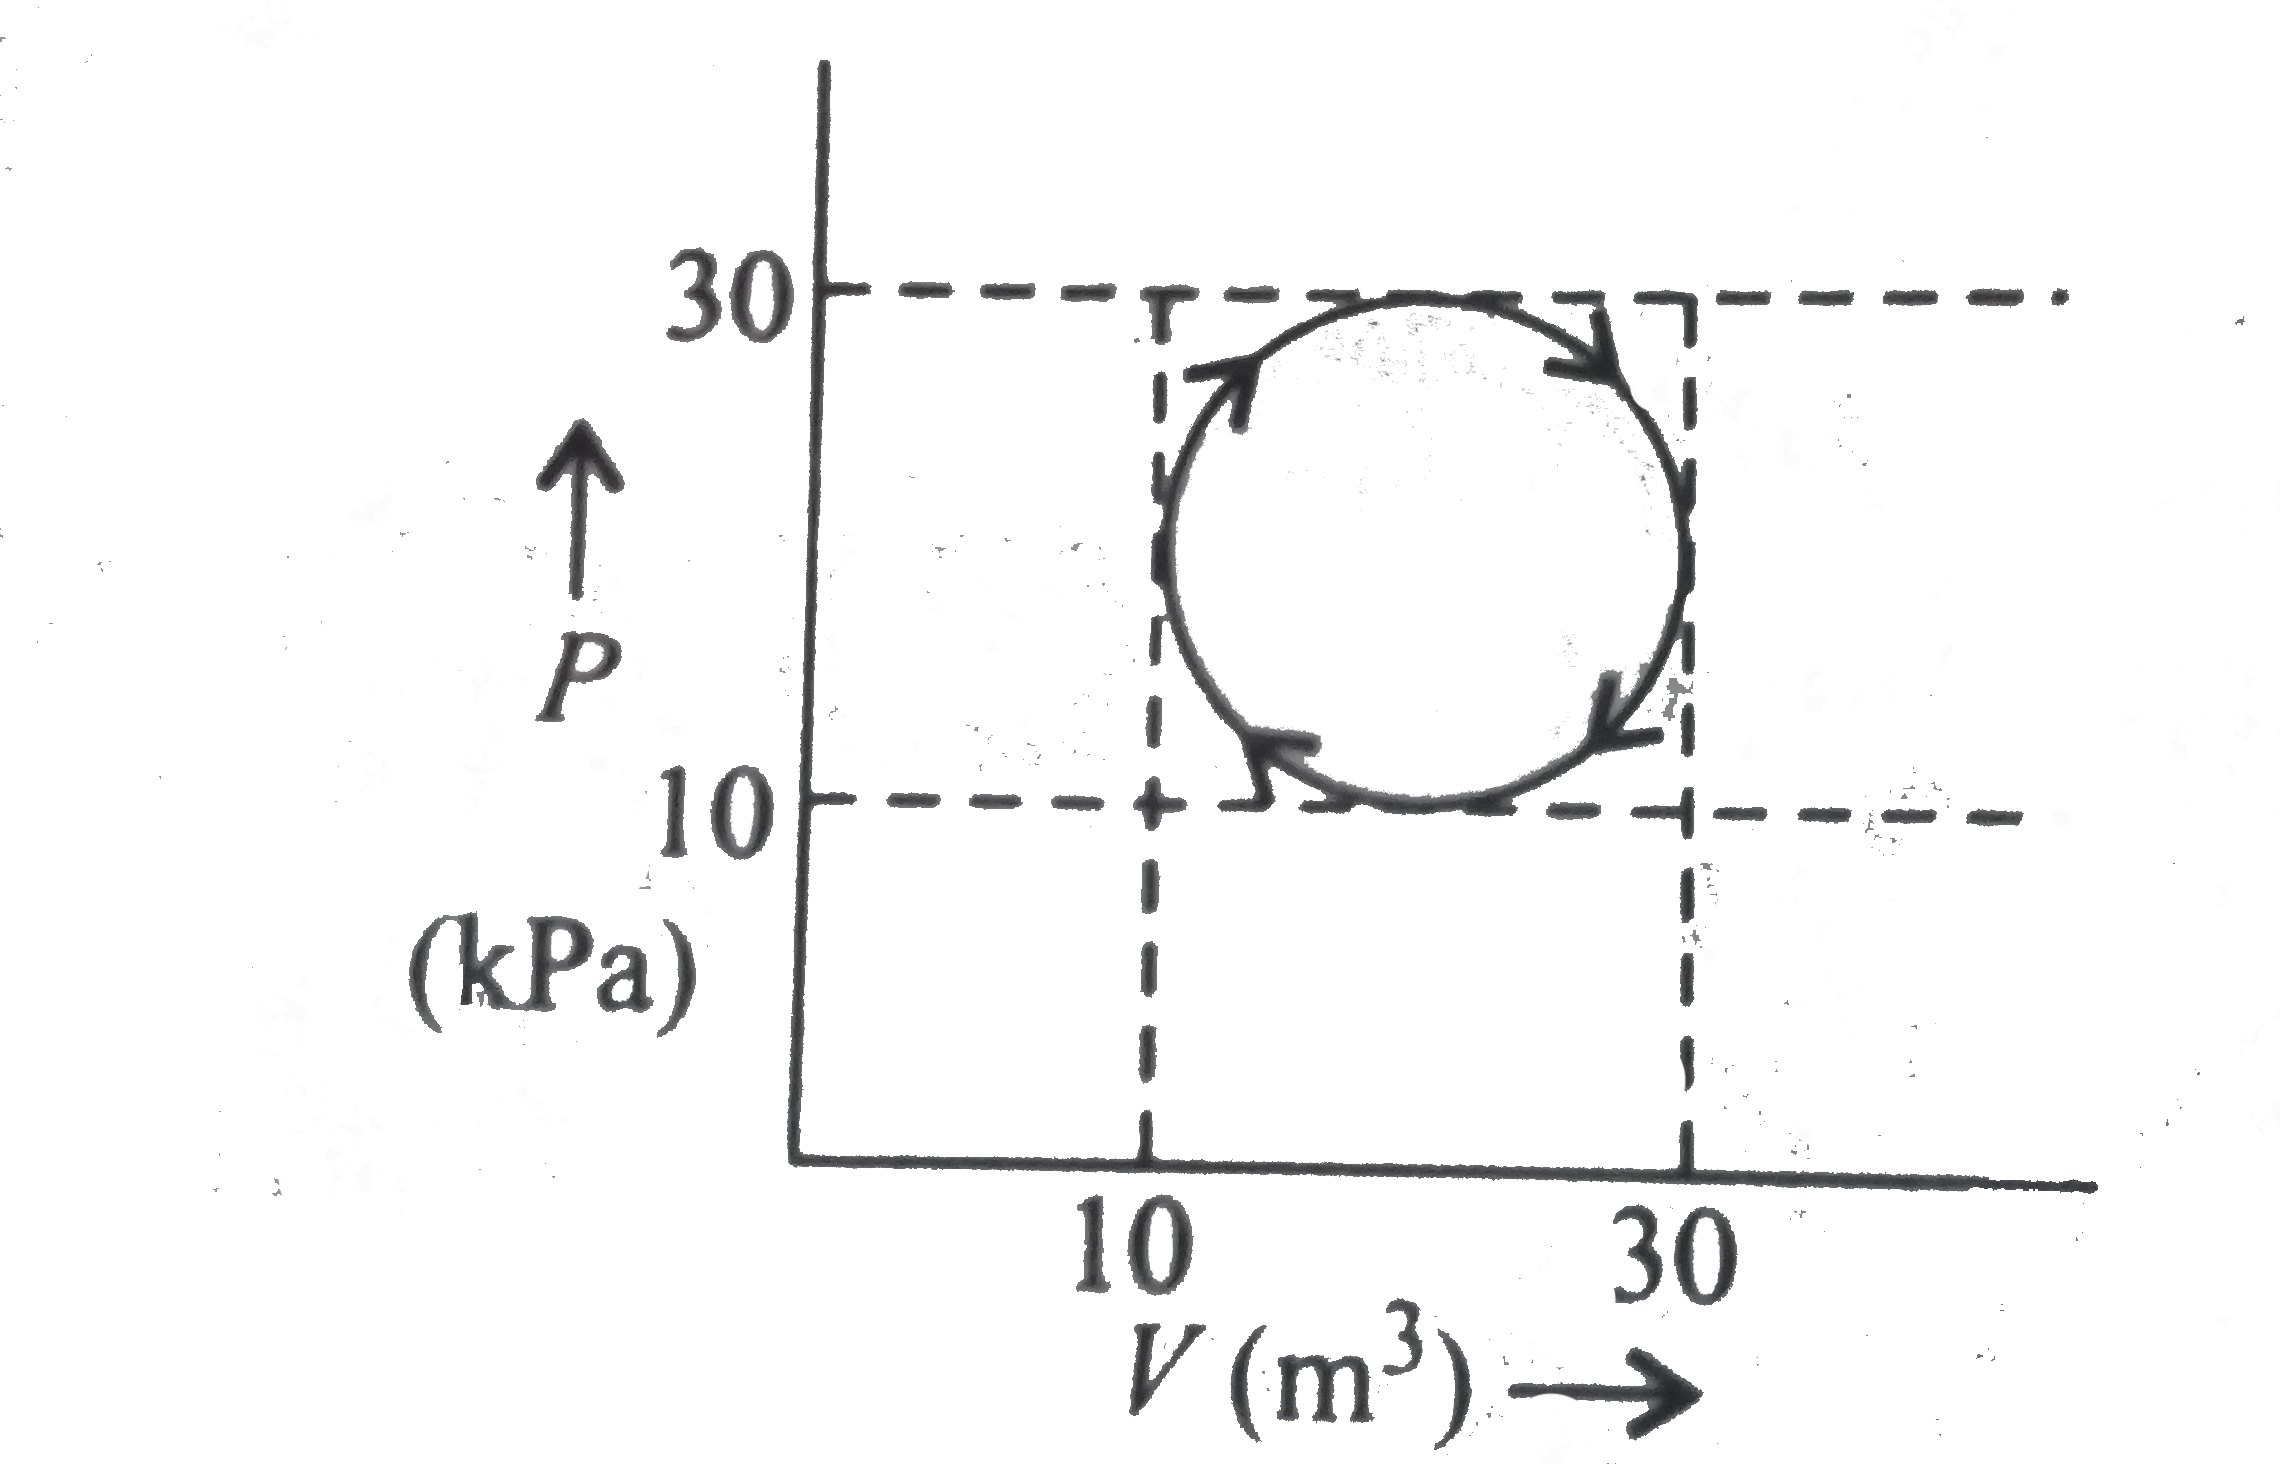
View SolutionAn ideal gas undergoes a circular cycle as shown in the figure. Find the ratio of maximum temperature of cycle to minimum temperature of cycle.
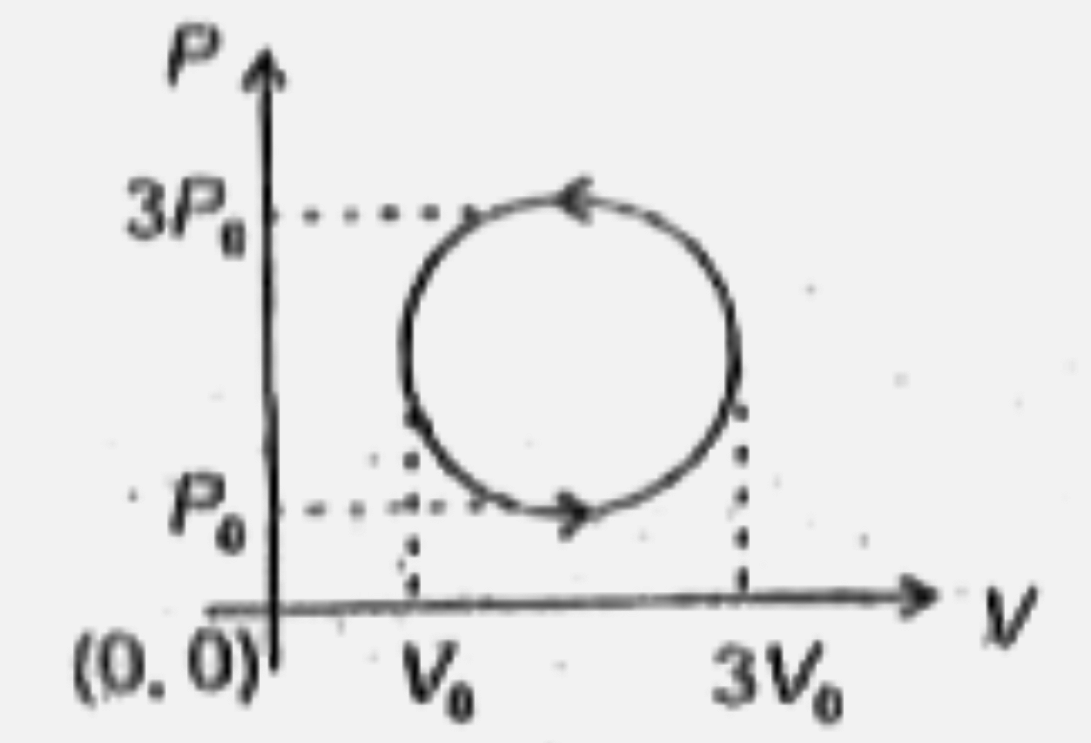
View SolutionWork done in the cyclic process shown in figure is
View SolutionOn a pT diagram, a cyclic process is performed as shown. Where is the volume maximum?
View SolutionWork done (in kJ) by the gas in the following cyclic process is
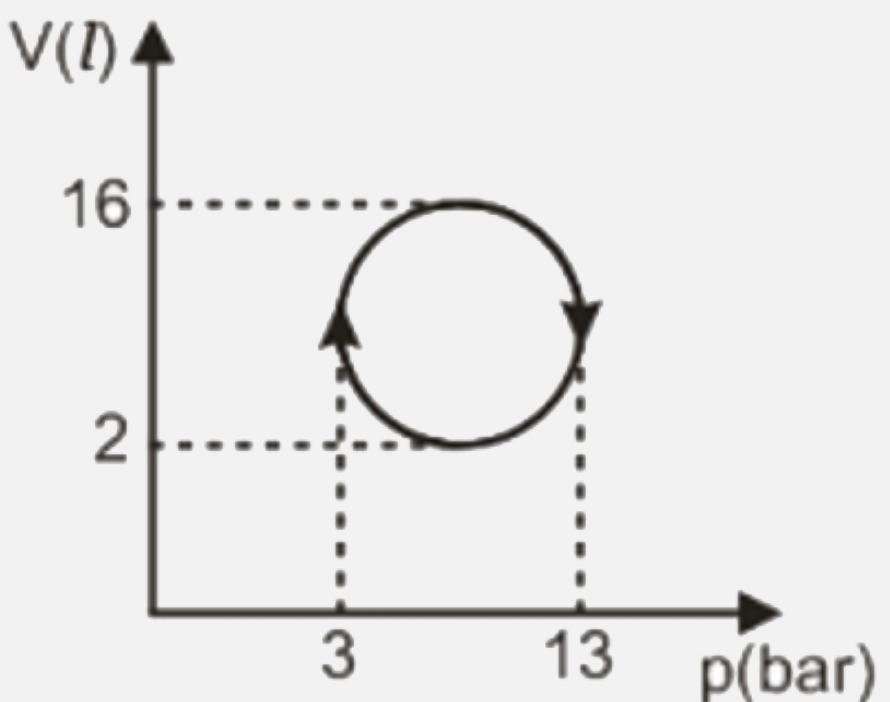
View SolutionFind the work done by gas going through a cyclic process shown in figure?

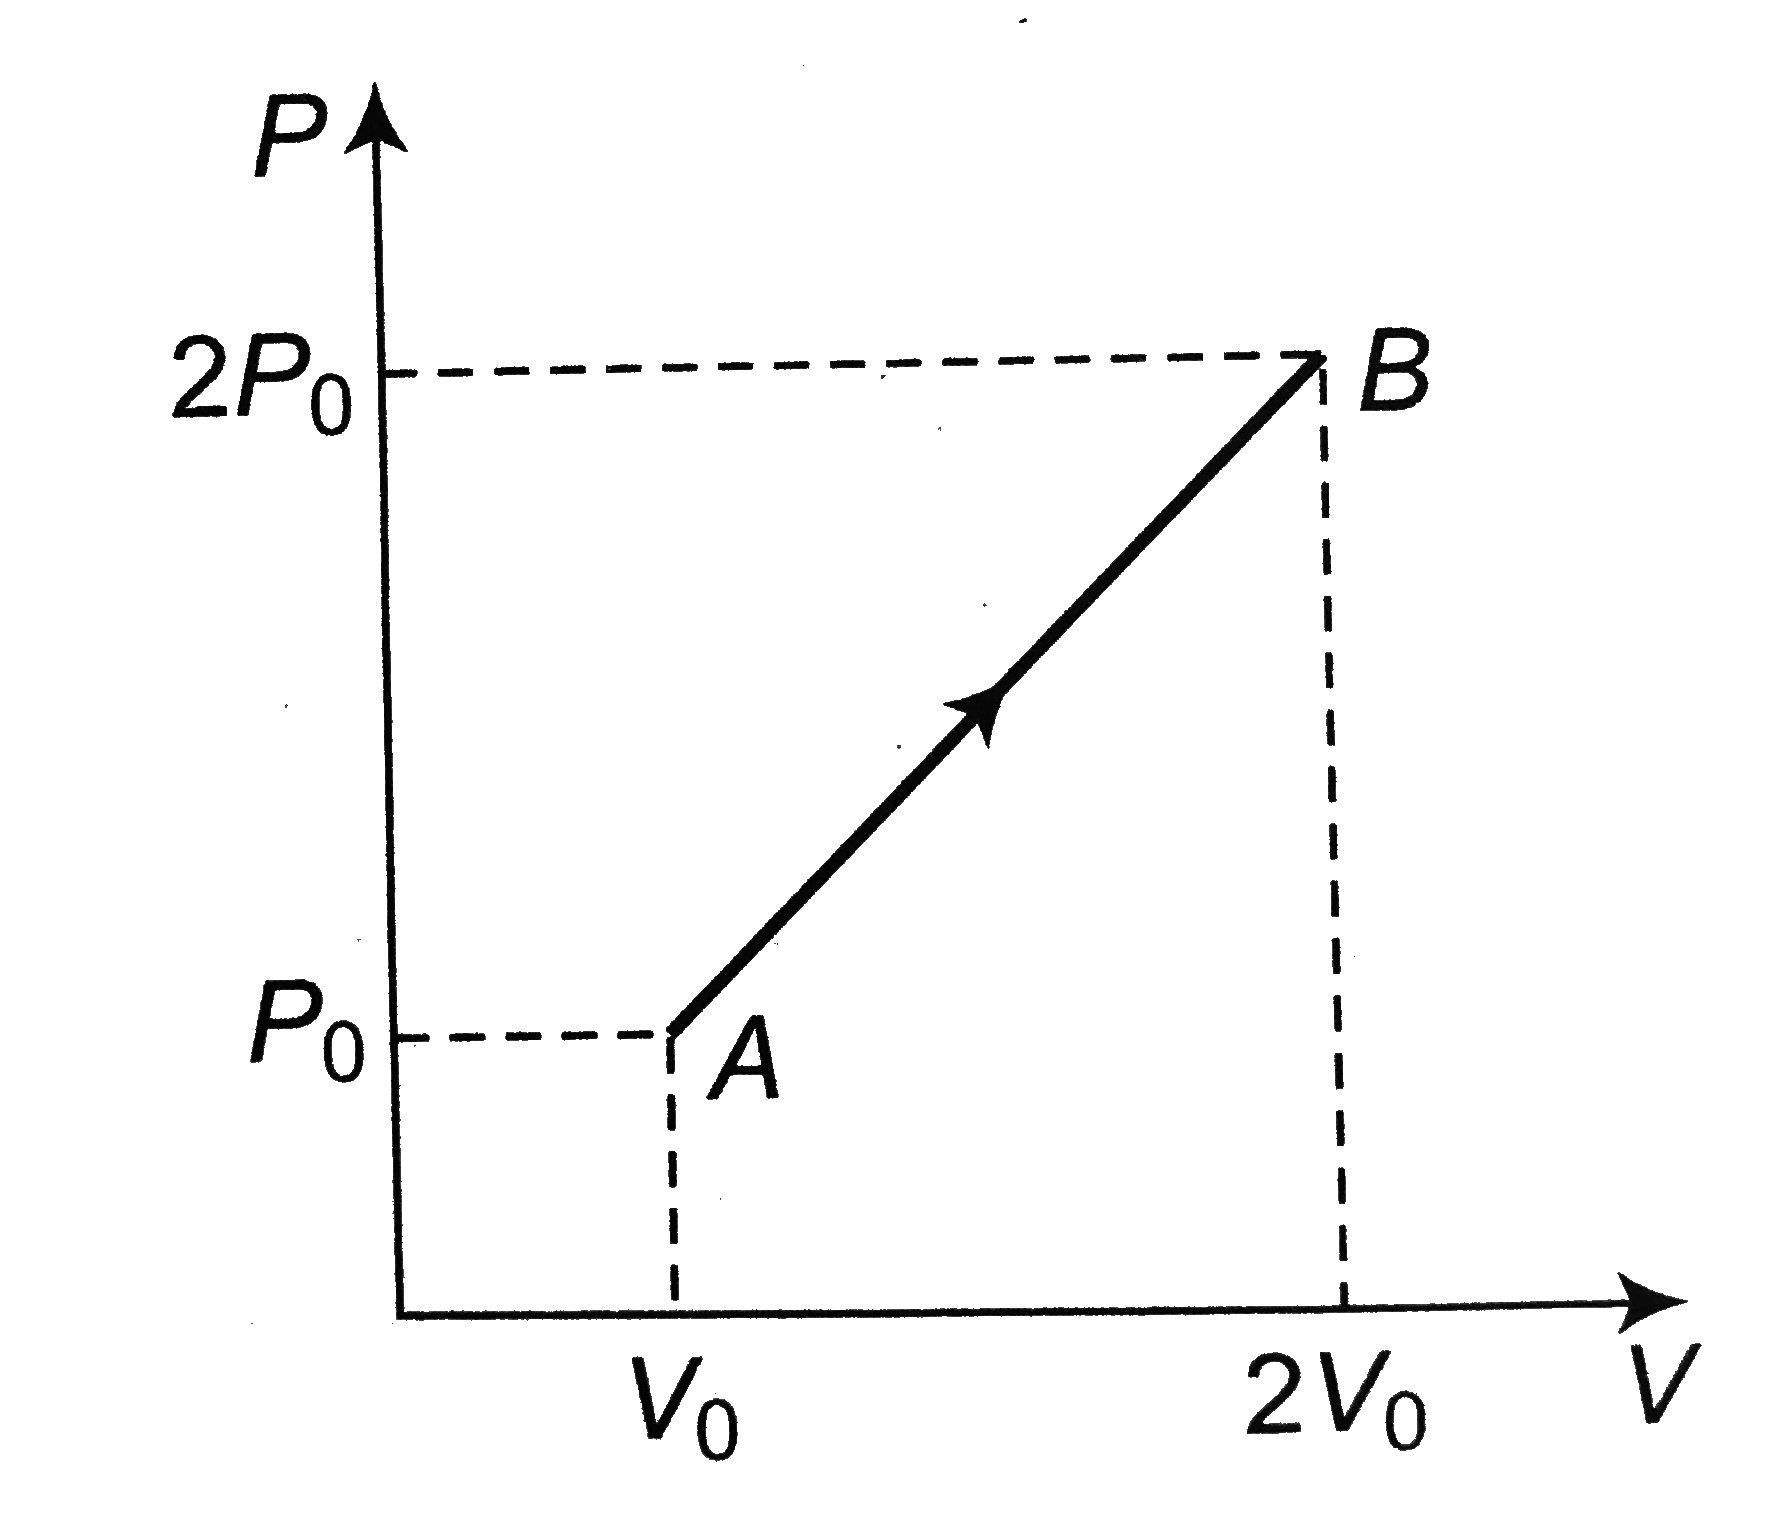
View SolutionThe P−V diagram of 2 gm of helium gas for a certain process A→B is shown in the figure. What is the heat given to the gas during the process A→B?
View SolutionAn ideal gas undergoes a cyclic process abcda which is shown by pressure-density curve,
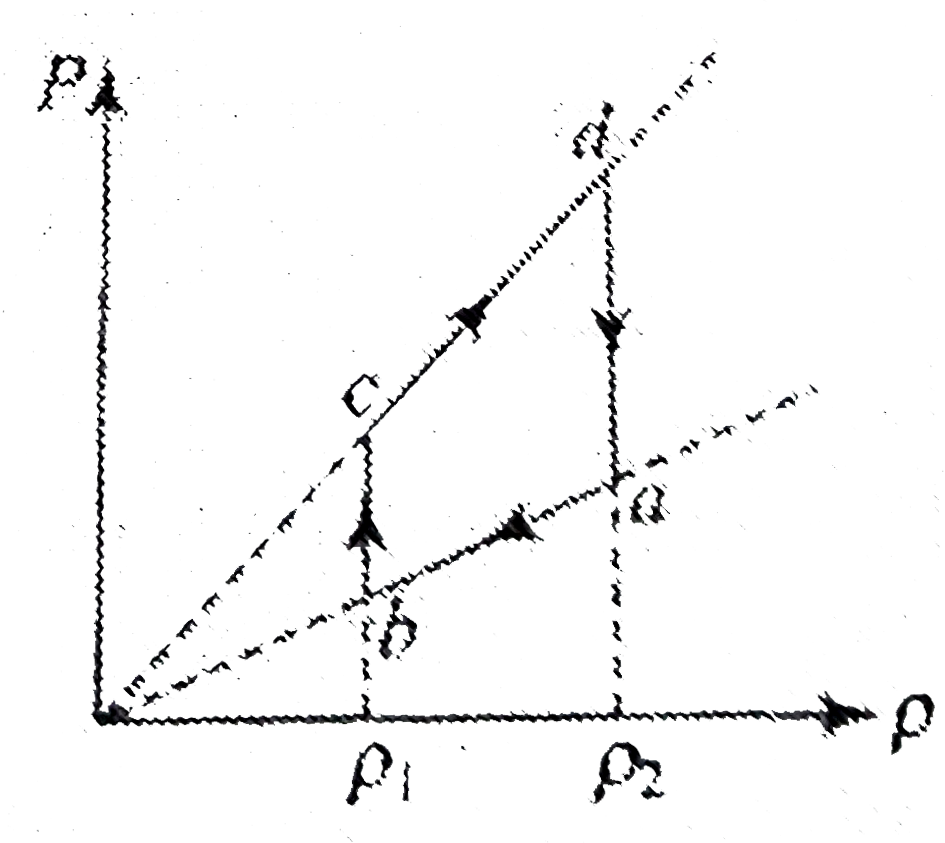
View SolutionAn ideal gas undergoes a cyclic process abcda which is shown by pressure-density curve,

View SolutionWhich one is not correct for a cyclic process as shown in the figure ?
View Solution
