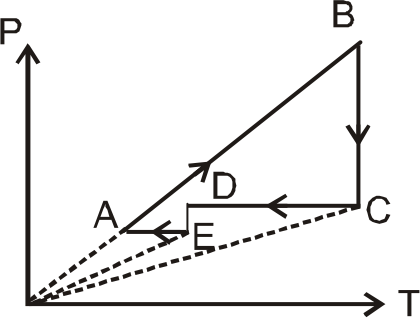
On a pT diagram, a cyclic process is performed as shown. Where is the volume maximum?
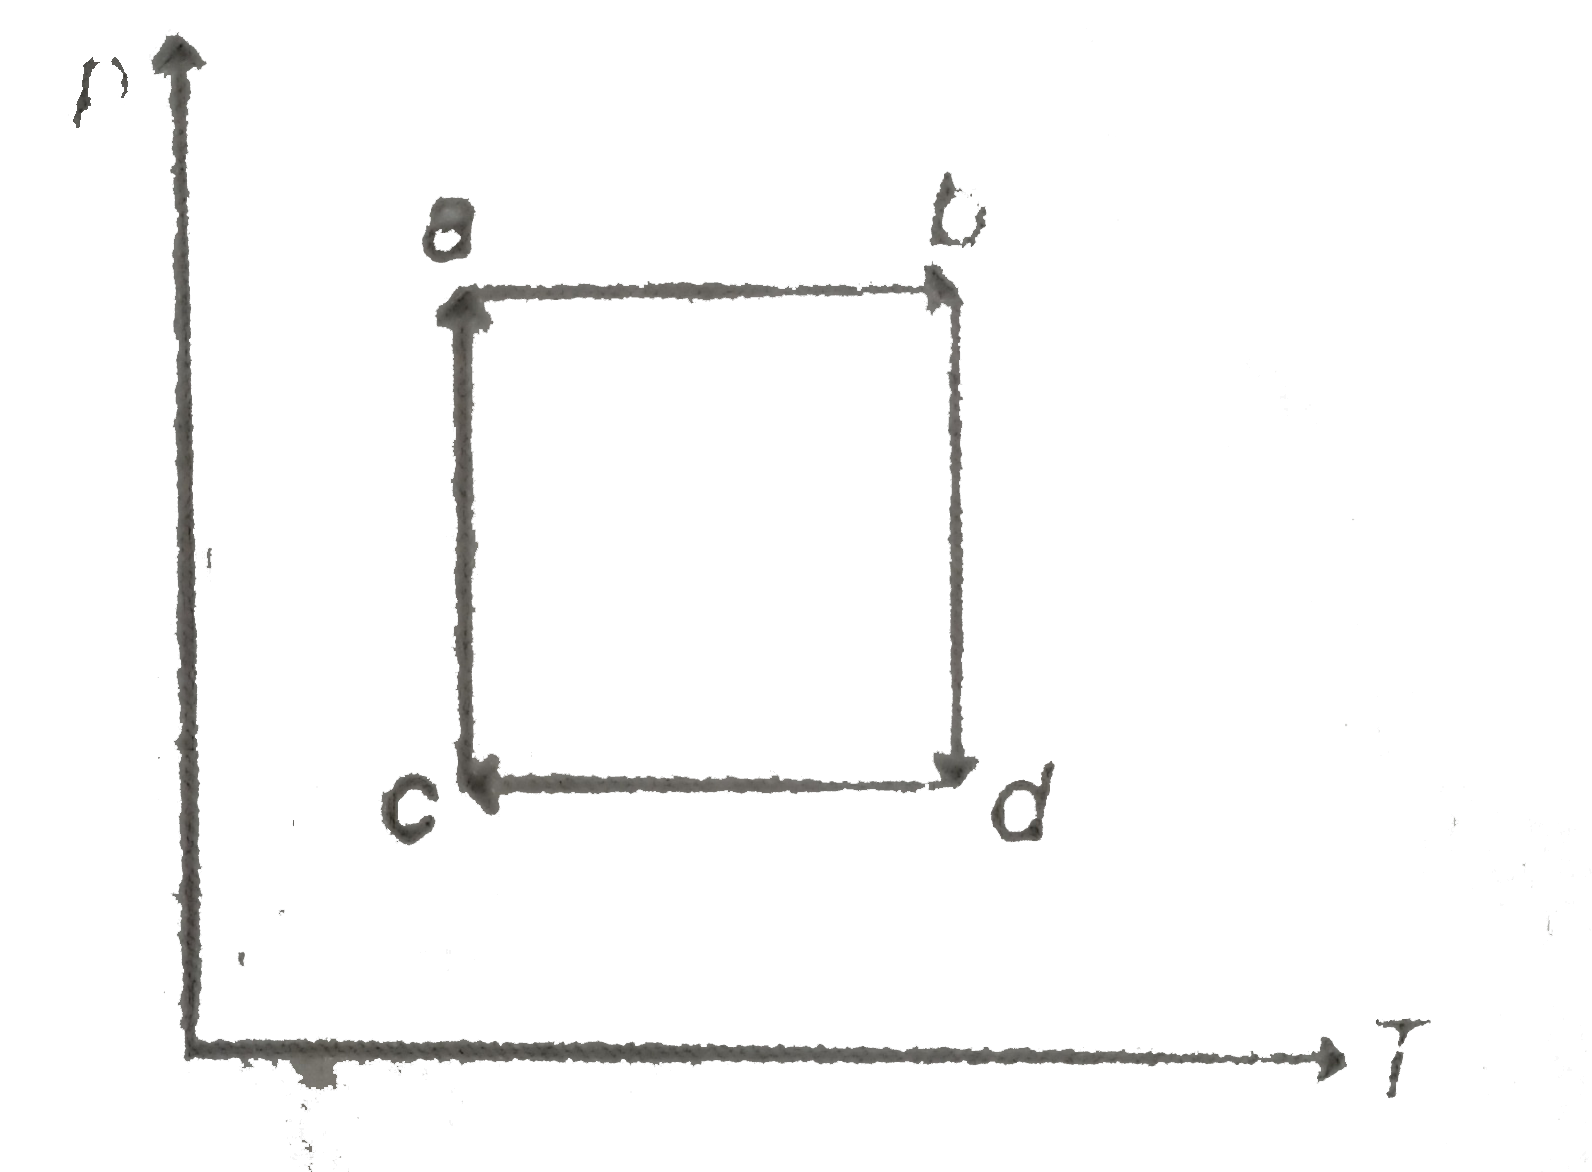
a
b
c
d
The correct Answer is:D
Step by step video & image solution for On a pT diagram, a cyclic process is performed as shown. Where is the volume maximum? by Physics experts to help you in doubts & scoring excellent marks in Class 11 exams.
Updated on:21/07/2023Topper's Solved these Questions
Similar Questions
What is true for a cyclic process
View SolutionWhat is meant by a cyclic process ?
View SolutionDefine the Cyclic process.
View SolutionP−V diagram of a cyclic process ABCA is as shown in Fig. Choose the correct alternative
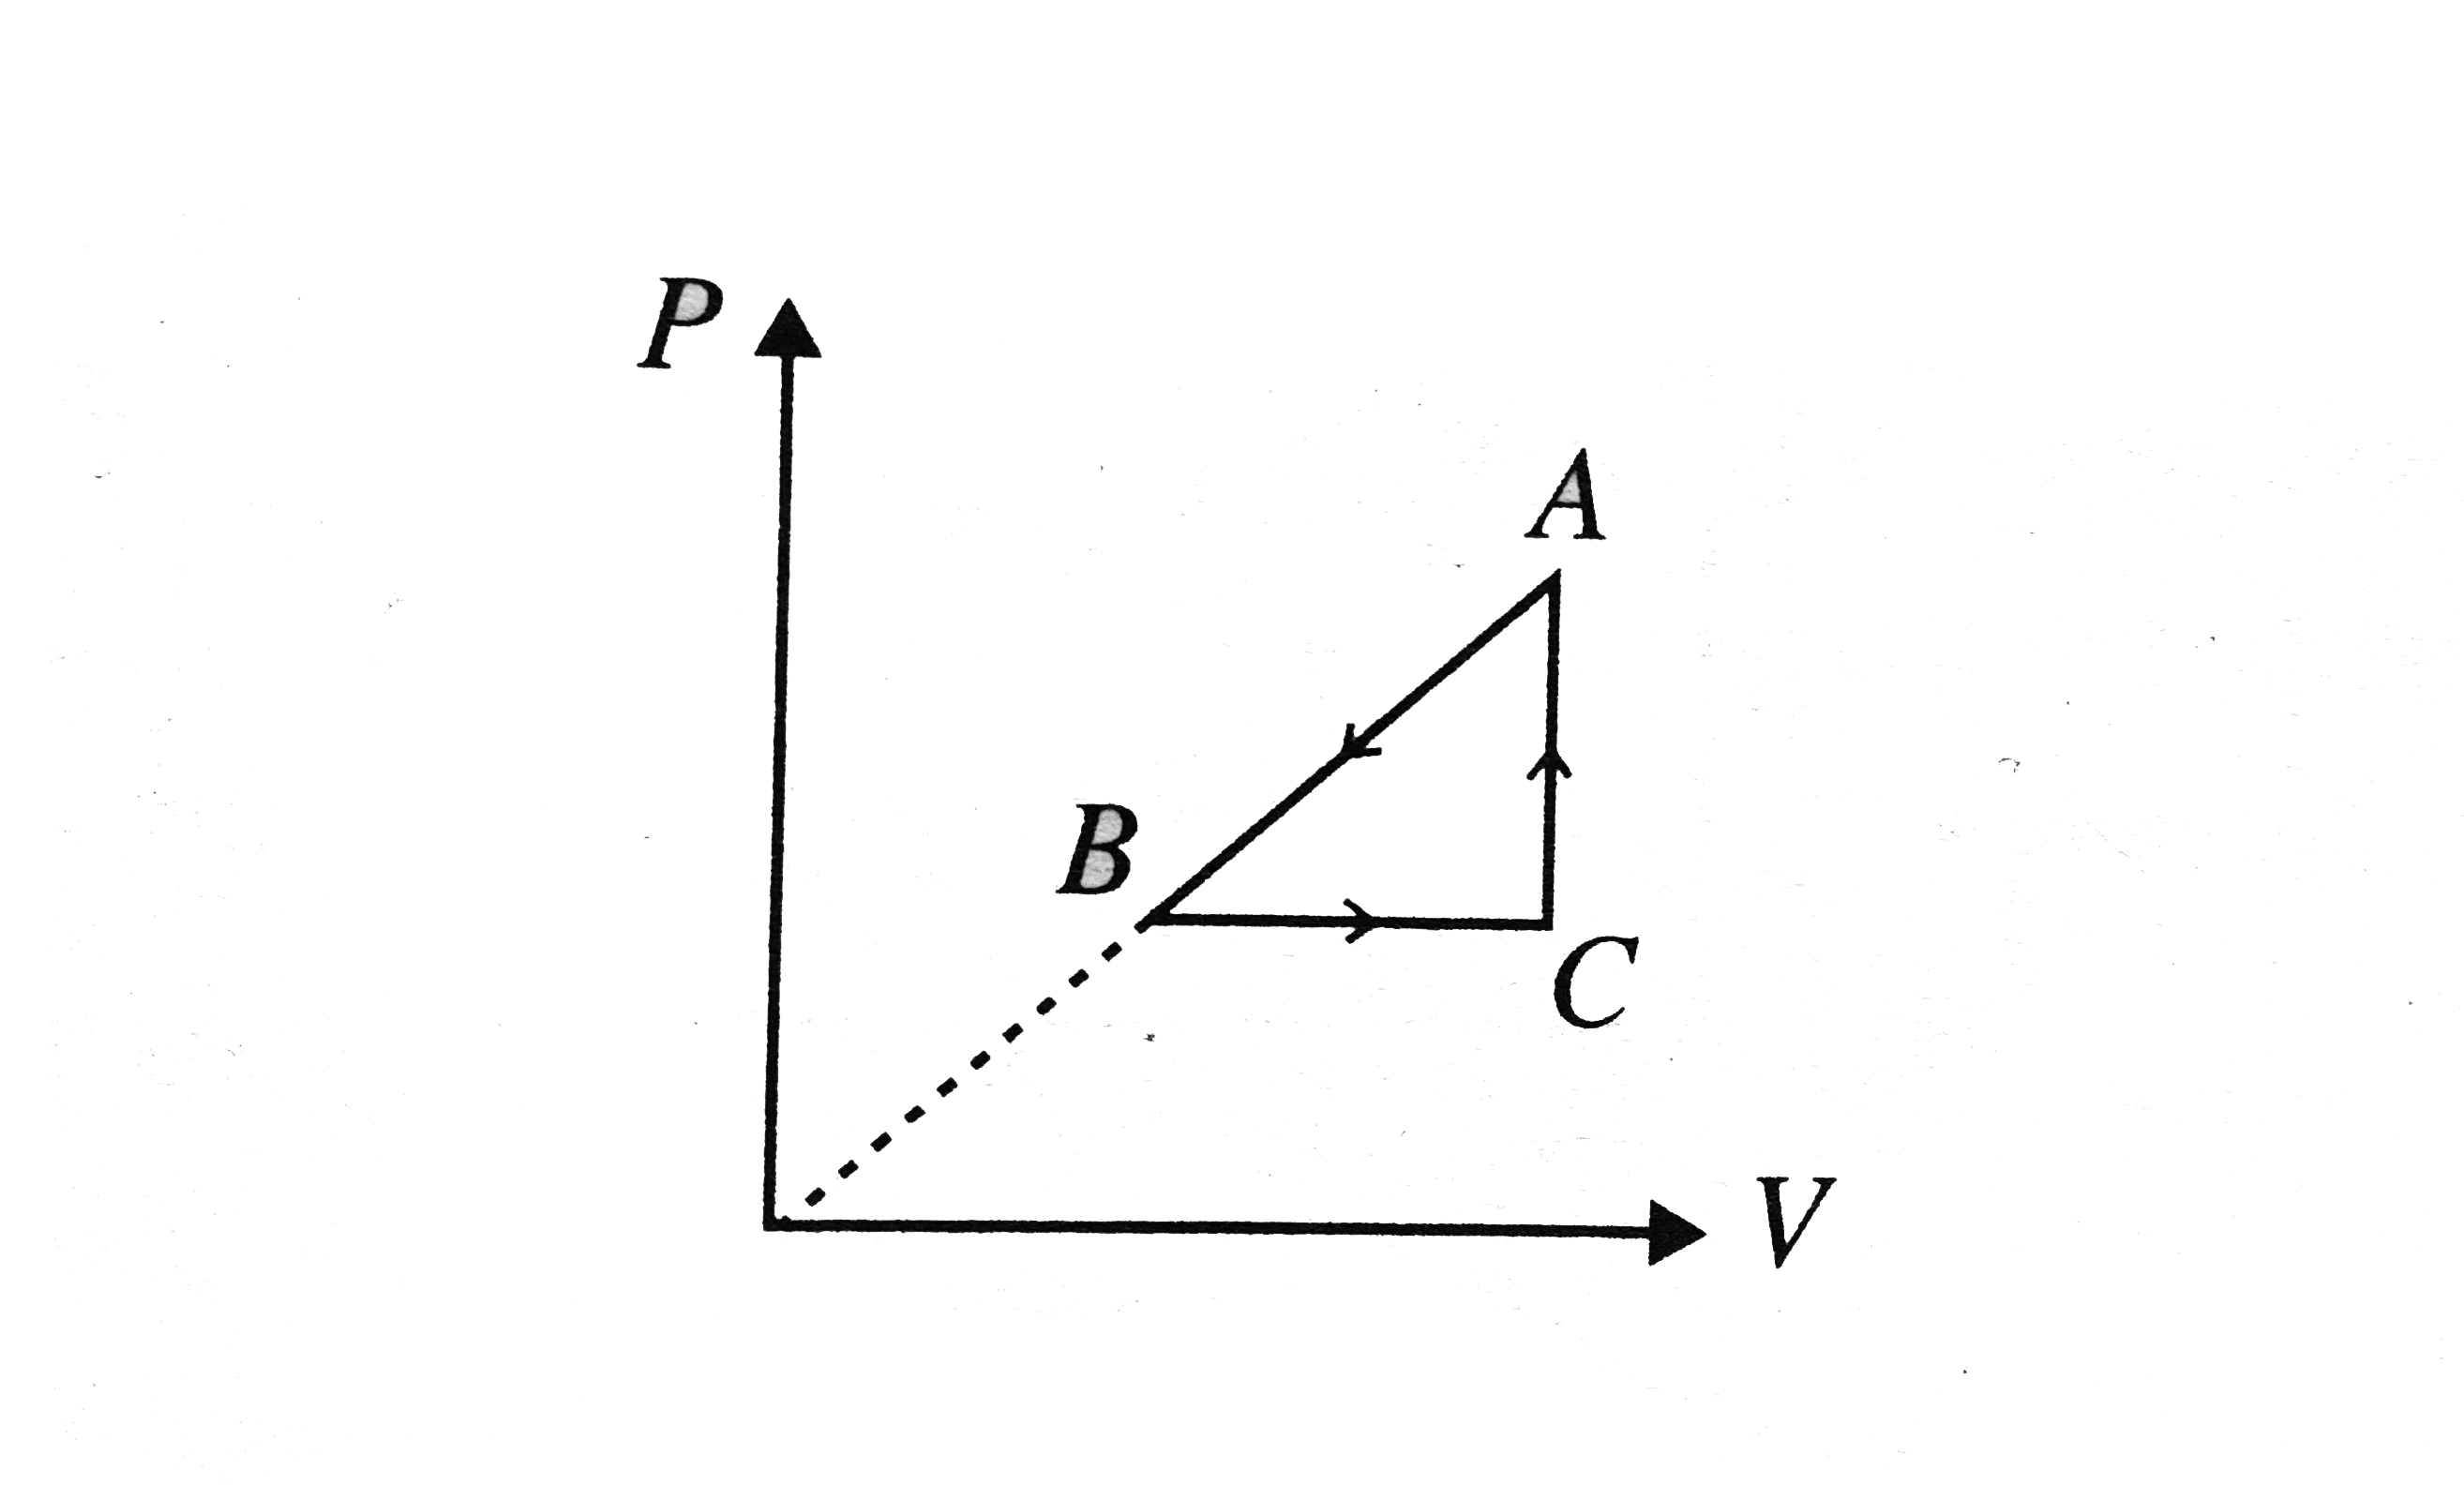
(A)ΔQA→B= negative (B)ΔUB→C= positive (C)ΔUC→A= negative (D)ΔWCAB= negative
View Solution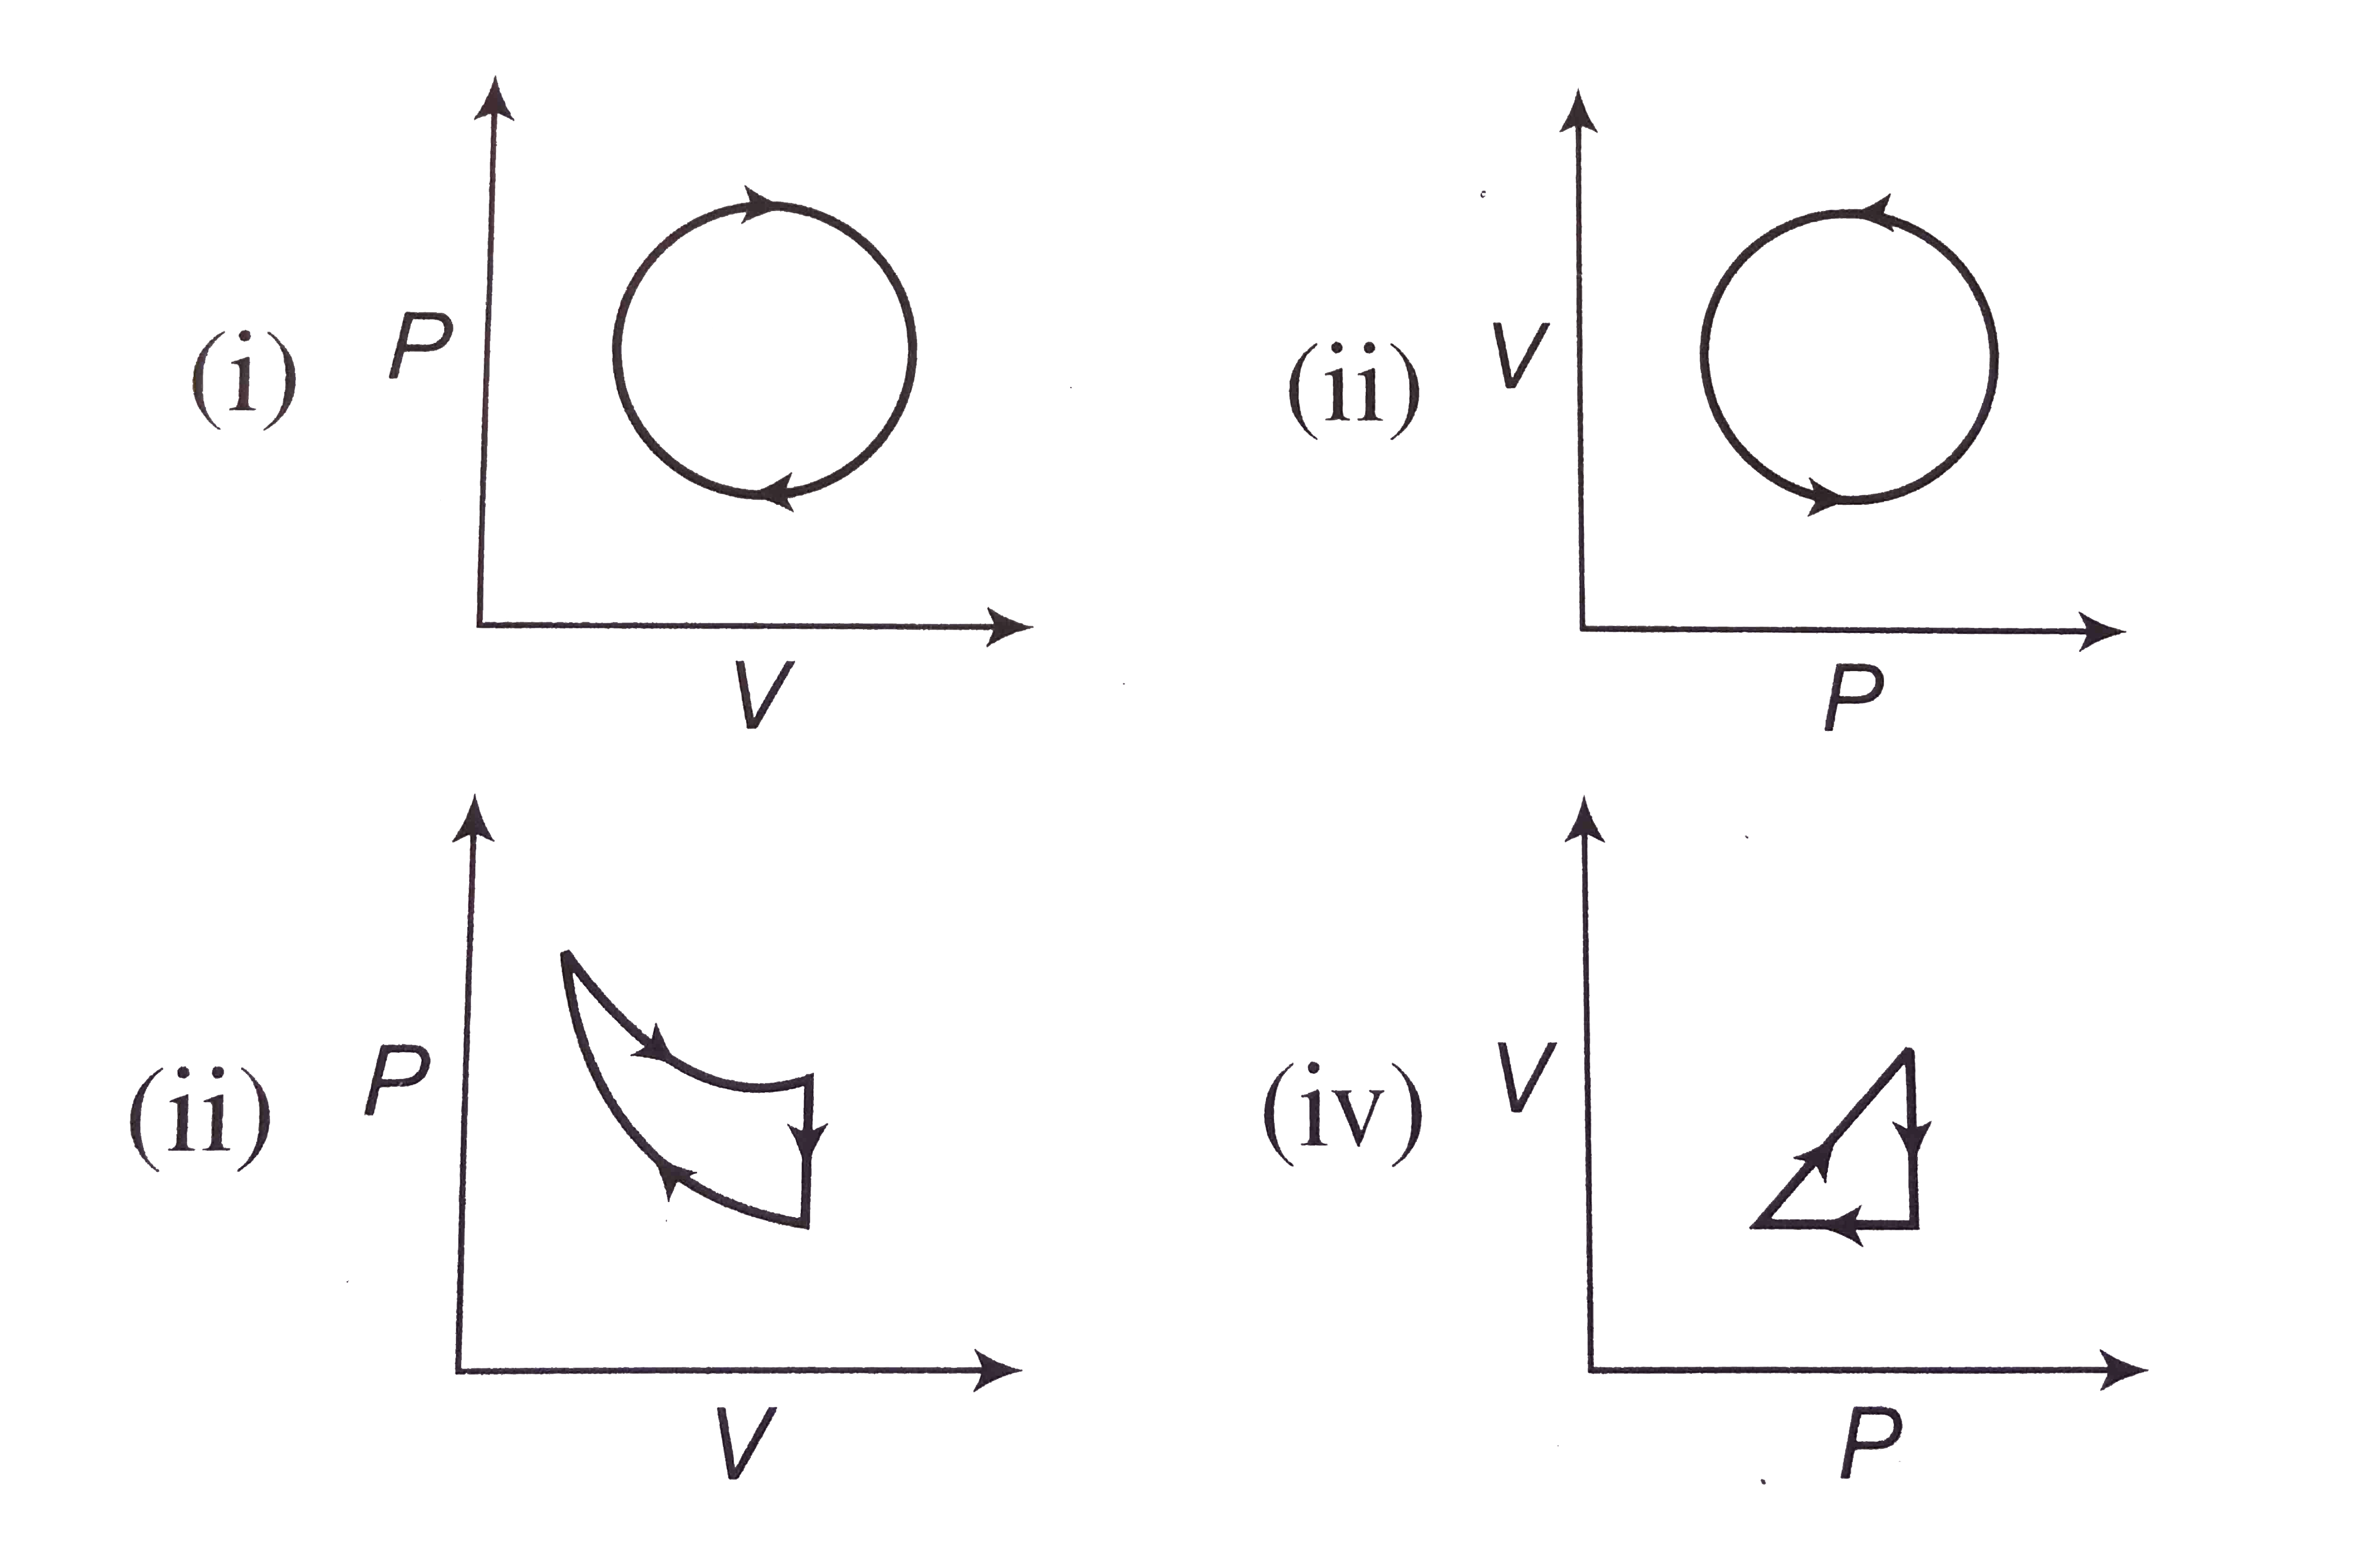
The following are the P−V diagrams for cyclic processes for a gas. In which of these processes is heat absorbed by the gas?
View SolutionP – V graph for a cyclic process is shown in figure . Work done is given by
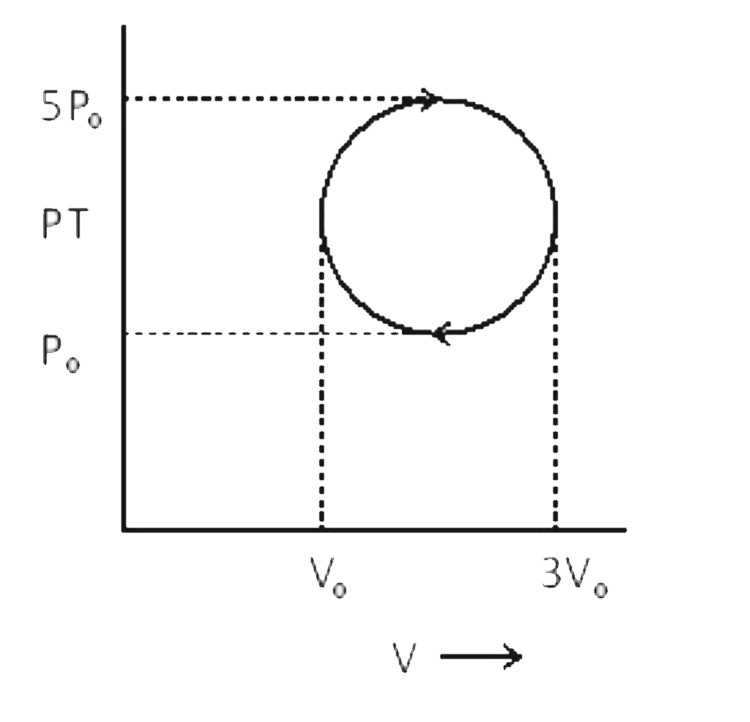
View SolutionThe following are the P−V diagram for cyclic process for a gas. In which of these processes, heat is not obsorbed by the gas?
View Solution2 moles of an ideal monoatomic gas undergoes a cyclic process ABCA as shown in the figure. R is the univers l gas constant. (given ln 2=0.693) Answer the following questions
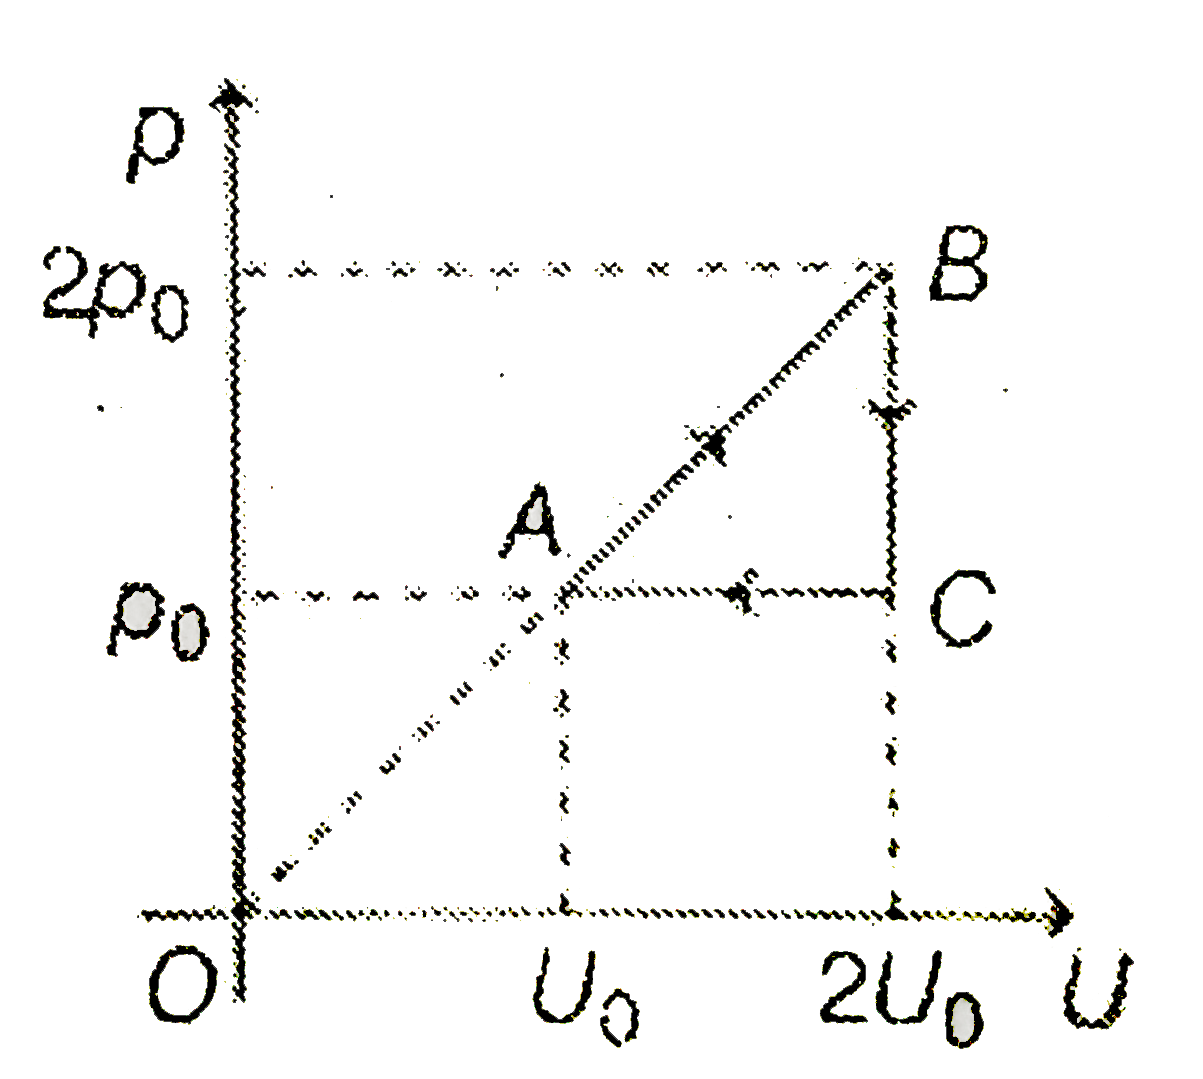
Graph of pressure versus volume of the cyclic process ABCA is
View Solutionp−T curve for a cyclic process is as shown
P−V graph for this process will be:
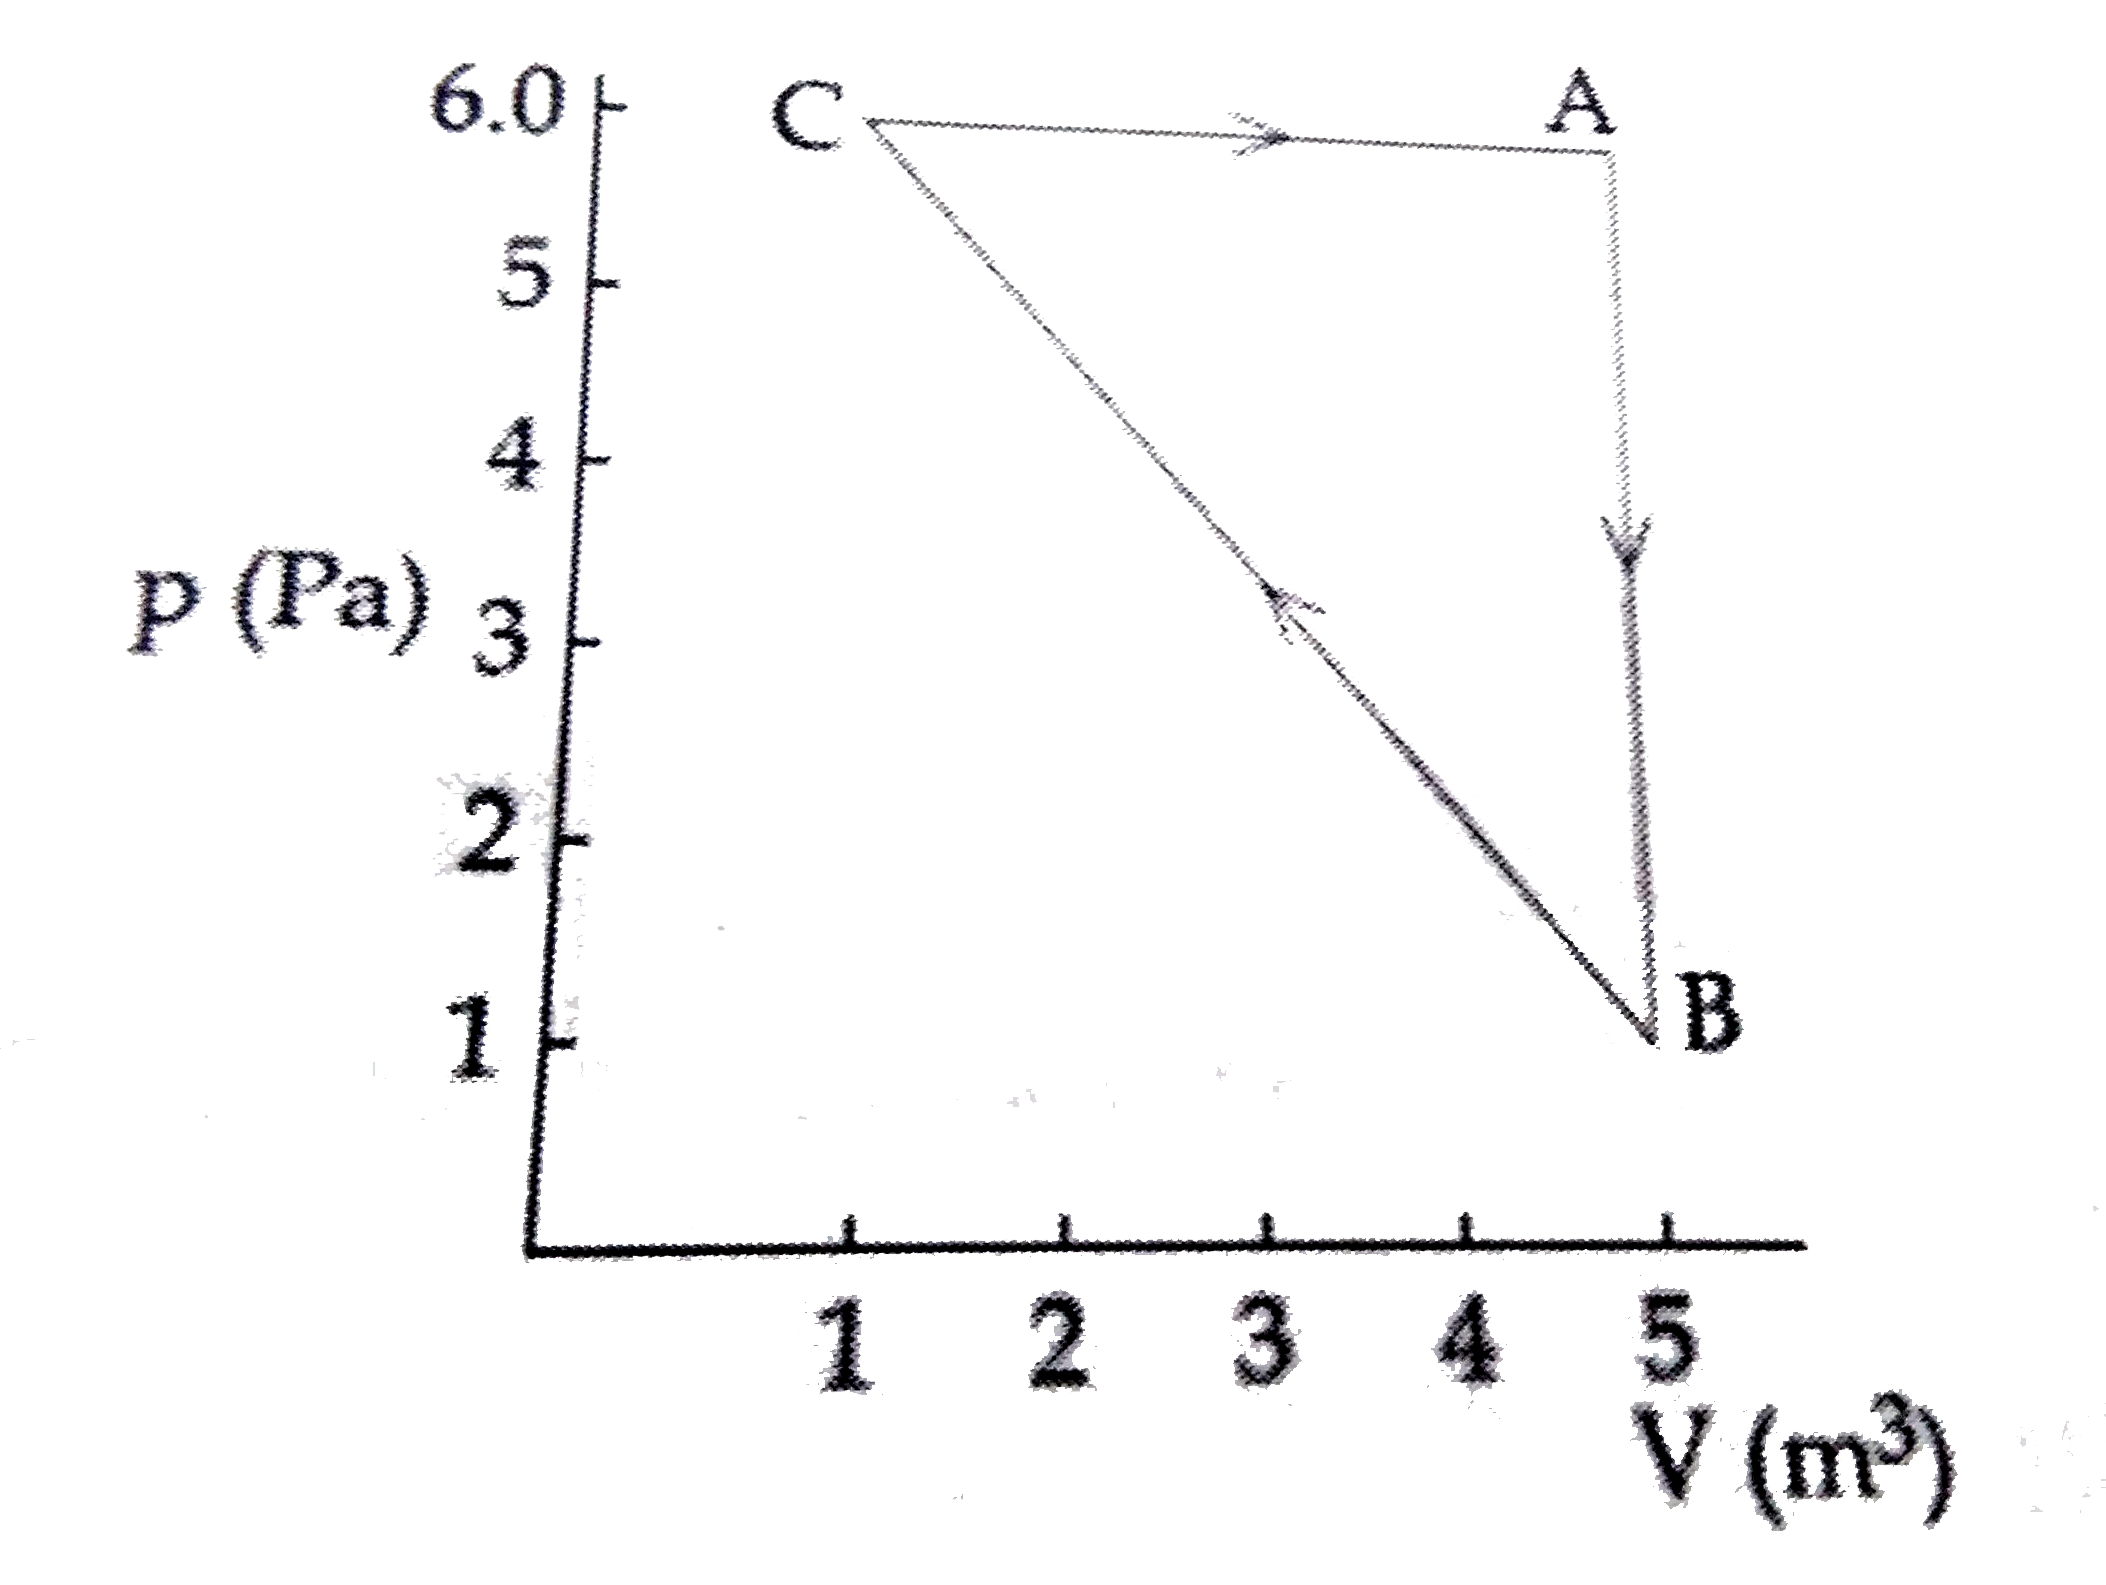
View Solutionfor the given cyclic process CAB as shown for a gas , the work done is :
View Solution
