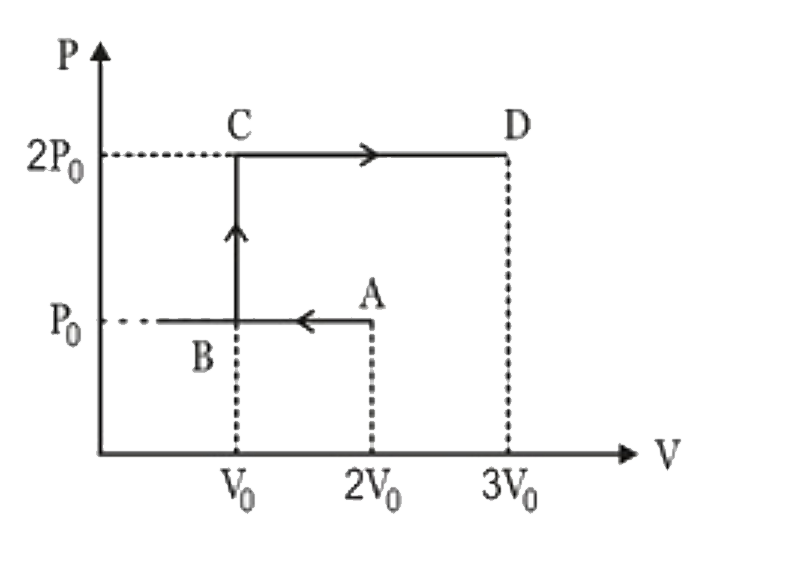
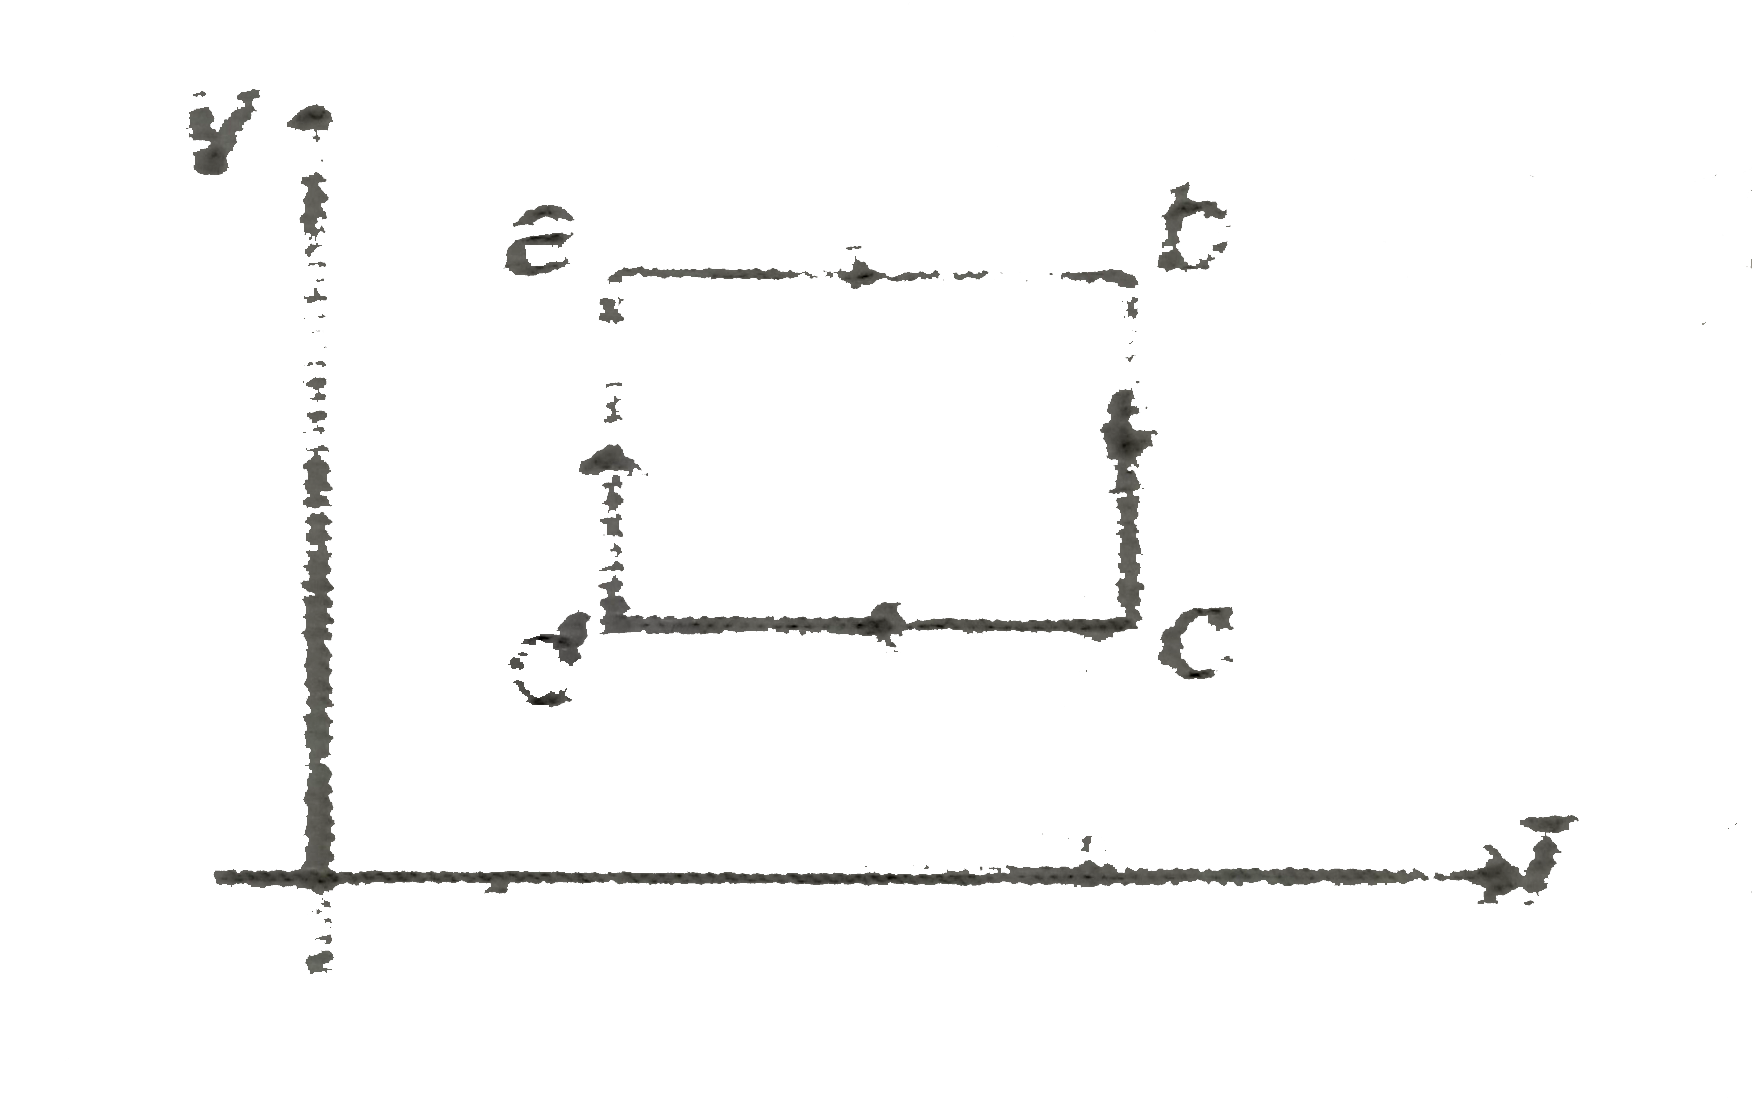
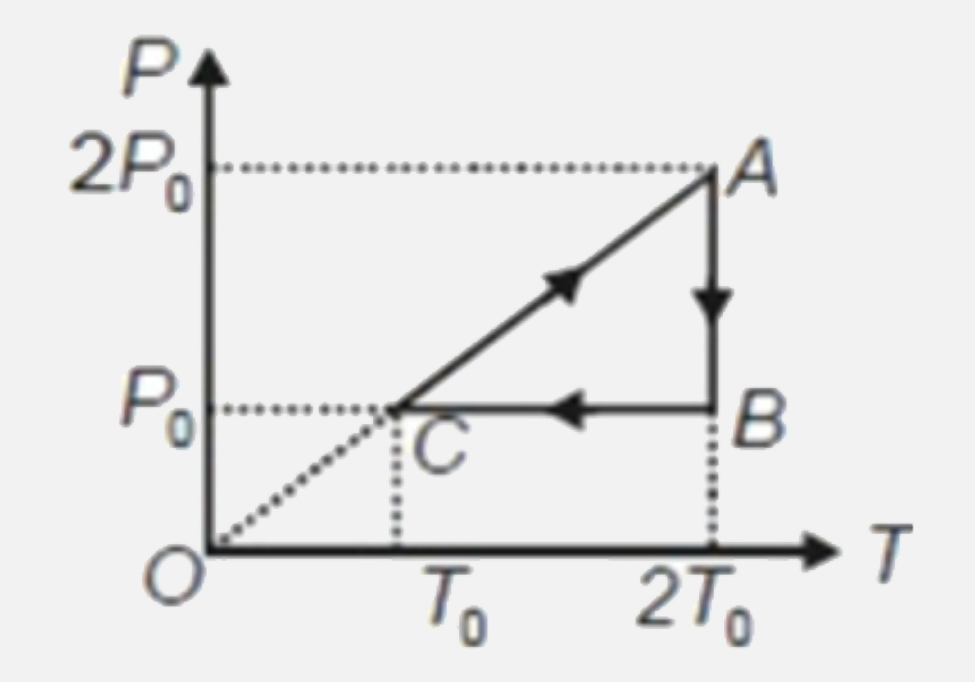
graph of an ideal gas is as shown in figure.
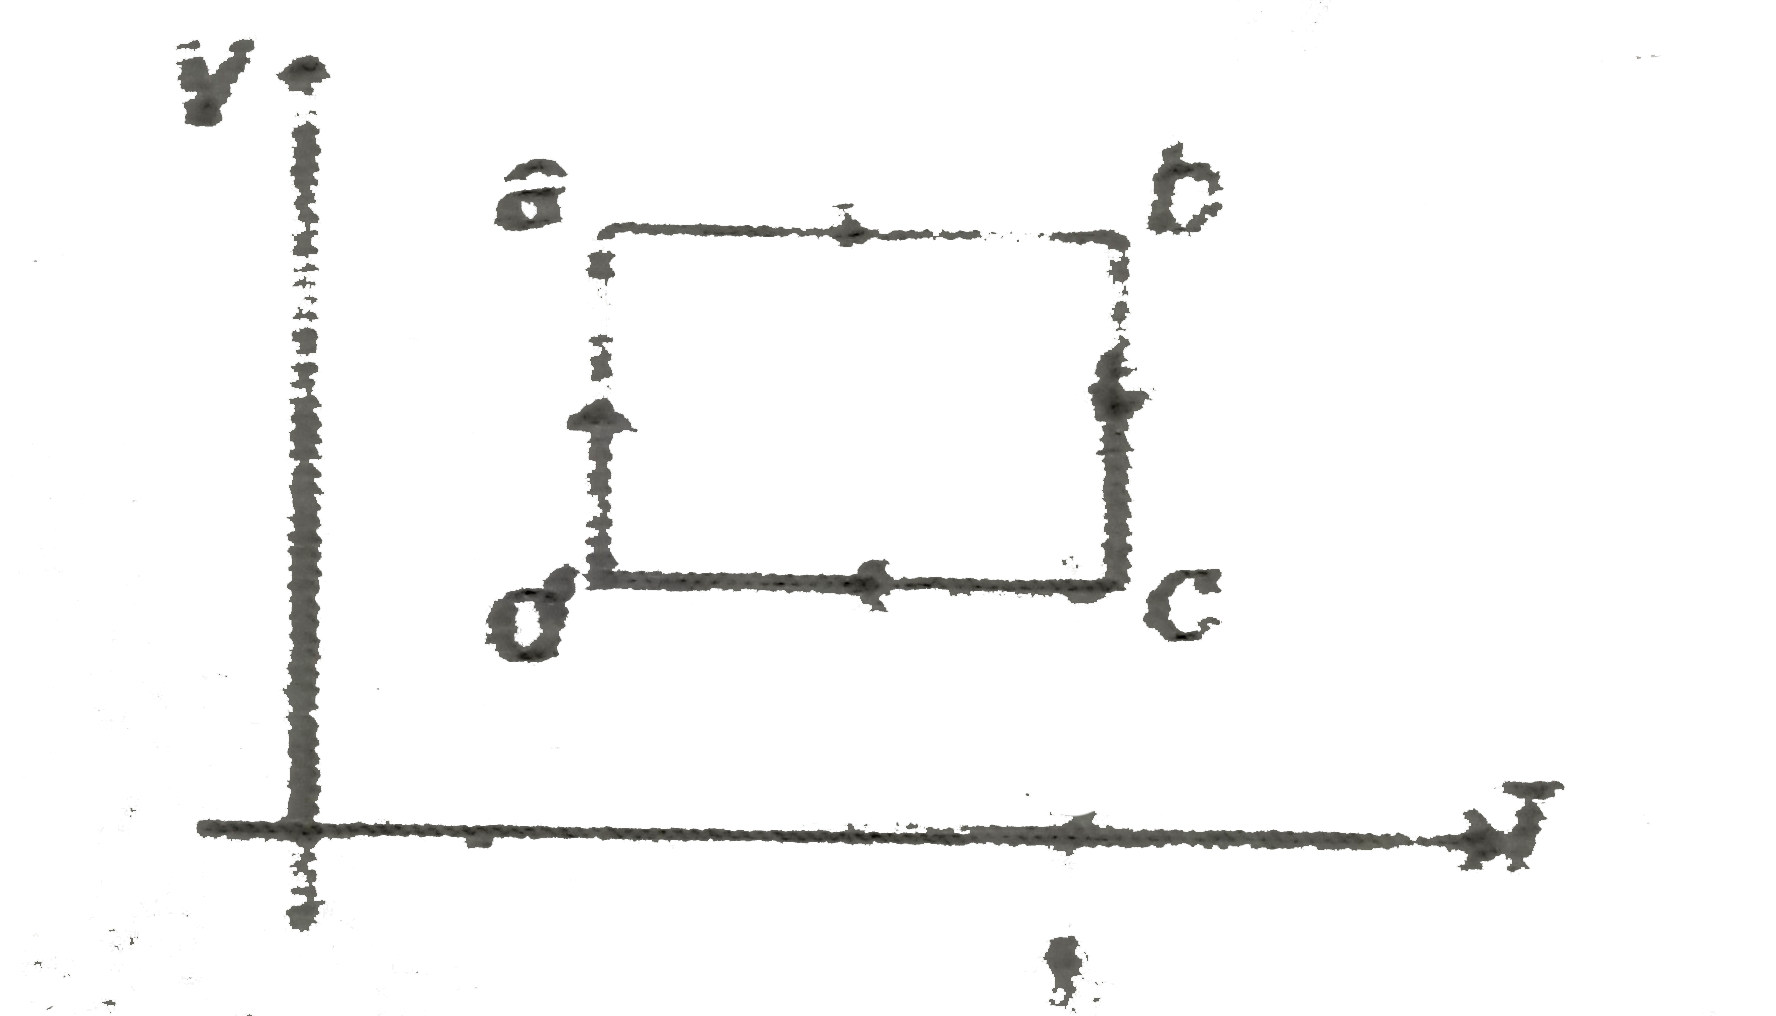
Work done by the gas in complete cyclic process about is
zero
positive
negative
Data is insufficient
The correct Answer is:C
Step by step video & image solution for graph of an ideal gas is as shown in figure. Work done by the gas in complete cyclic process about is by Physics experts to help you in doubts & scoring excellent marks in Class 11 exams.
Updated on:21/07/2023Topper's Solved these Questions
Similar Questions
Knowledge Check
A cyclic process is shown in the figure. Work done during the cyclic process ABCDA is
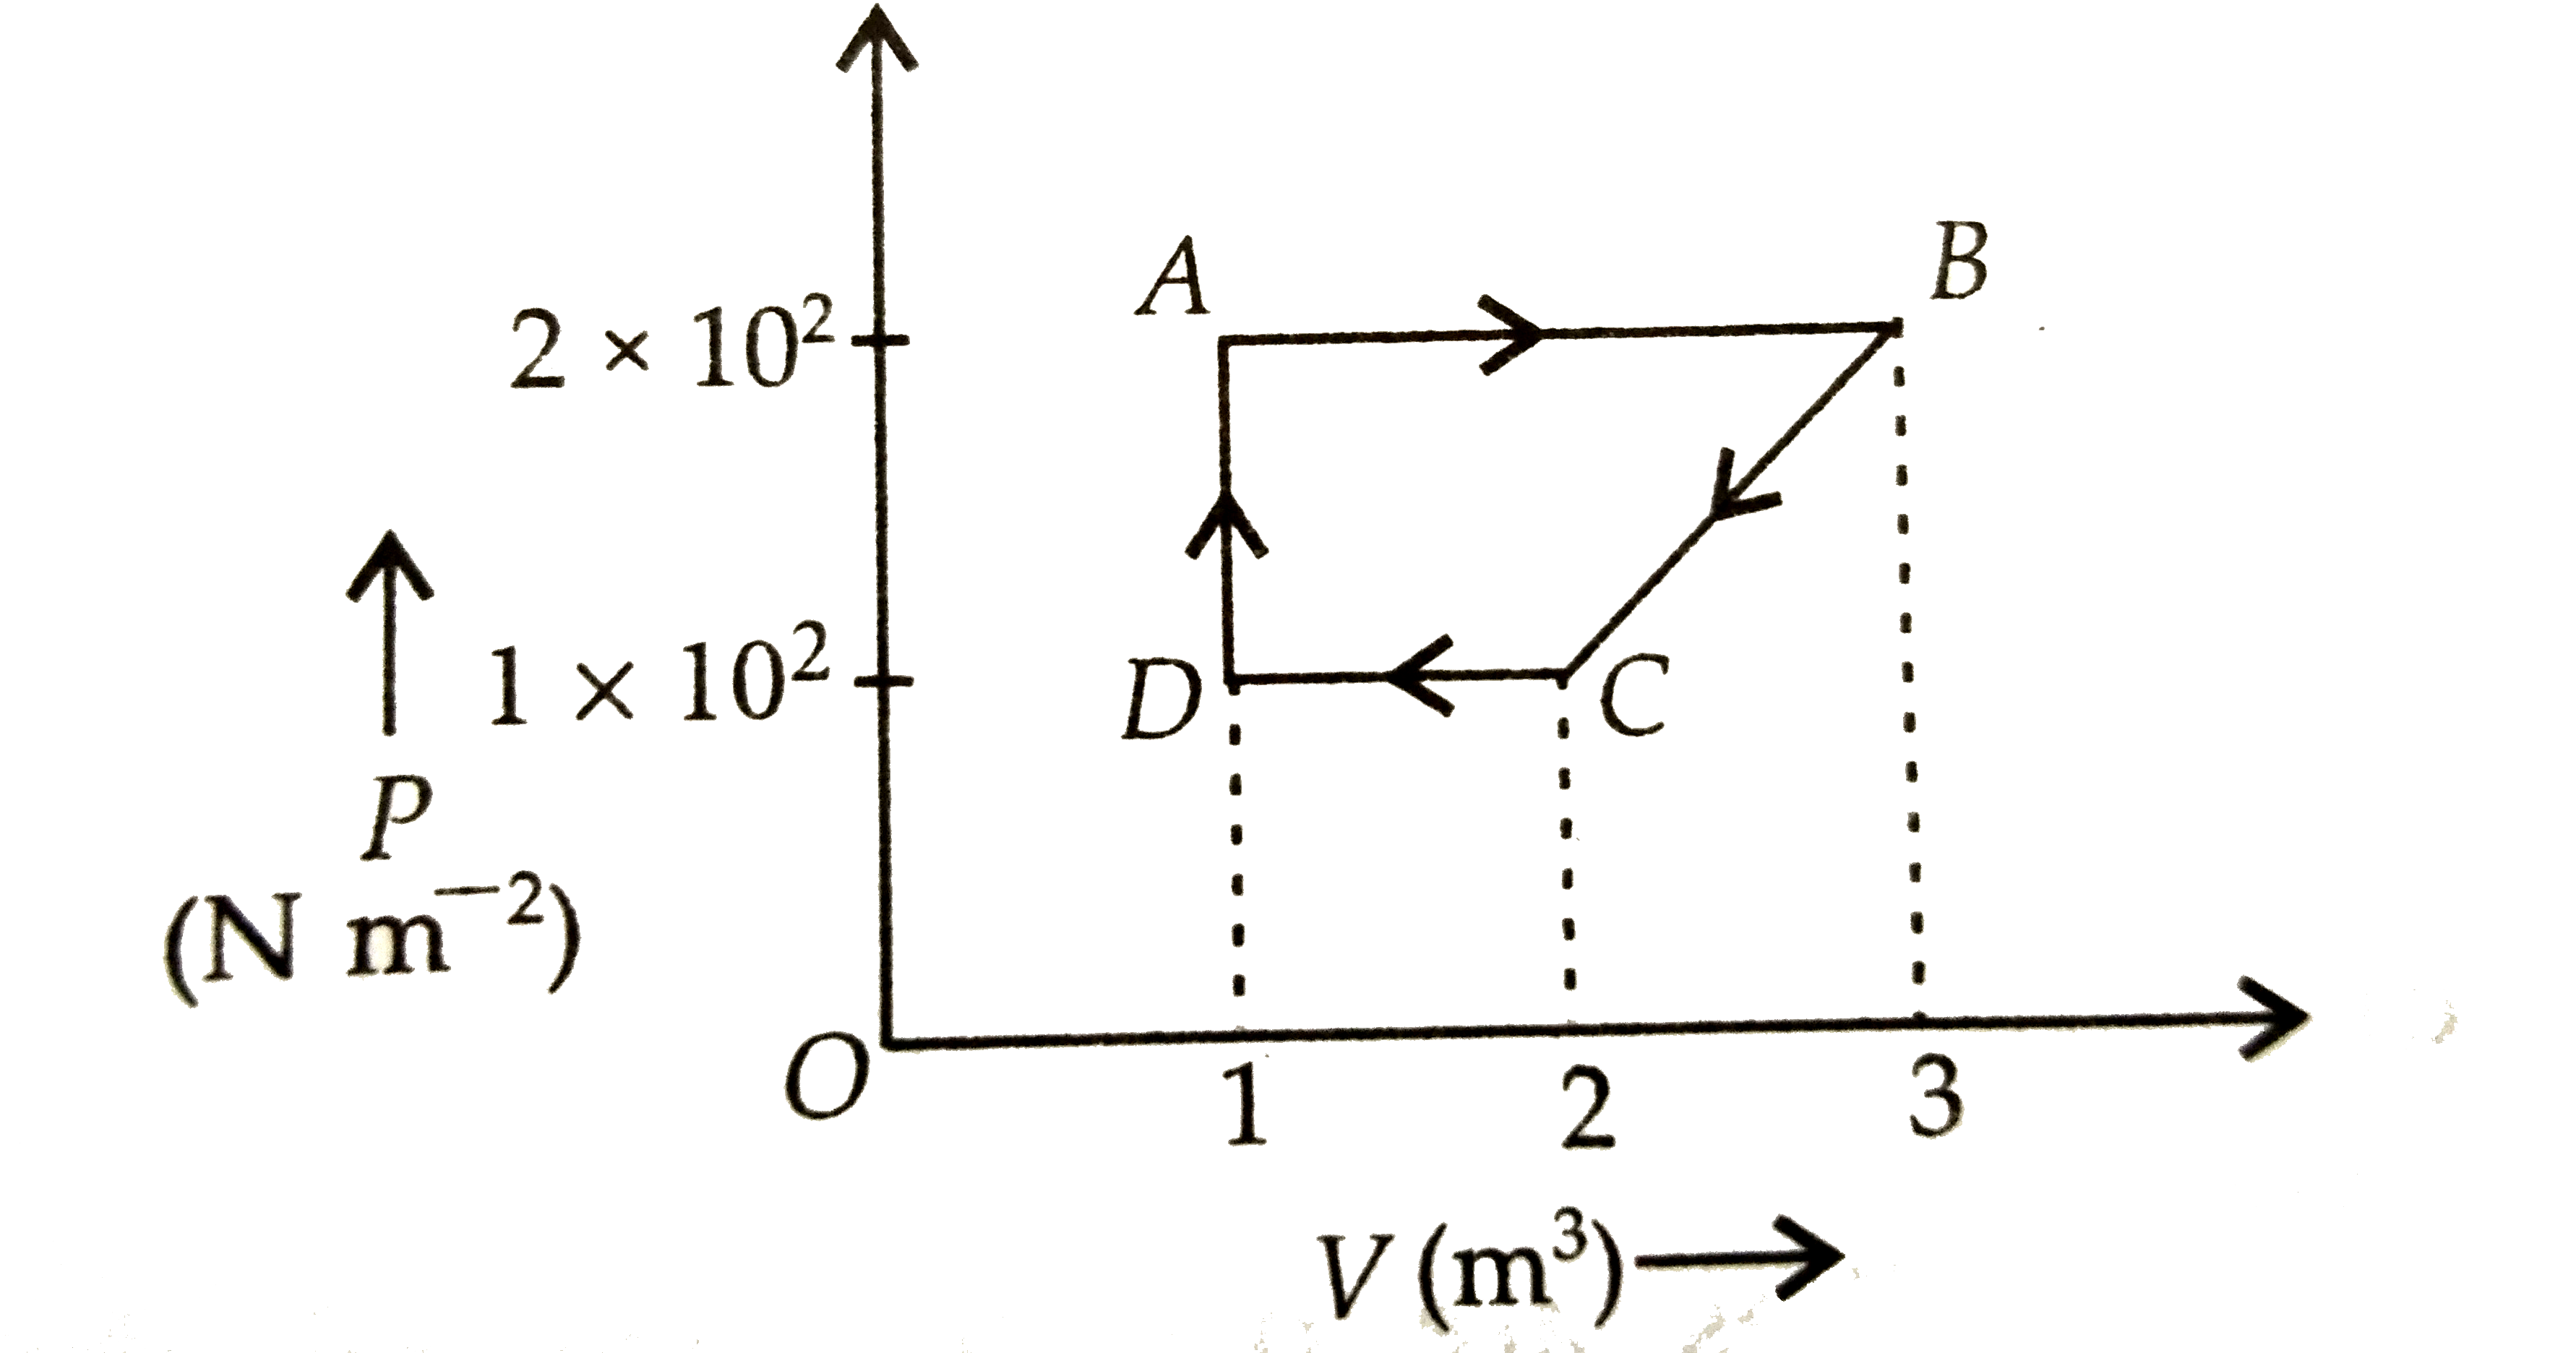 A1600 JB150 JC600 JD900 J
P−V diagram of an ideal gas is as shown in figure. Work done by the gas in process ABCD is
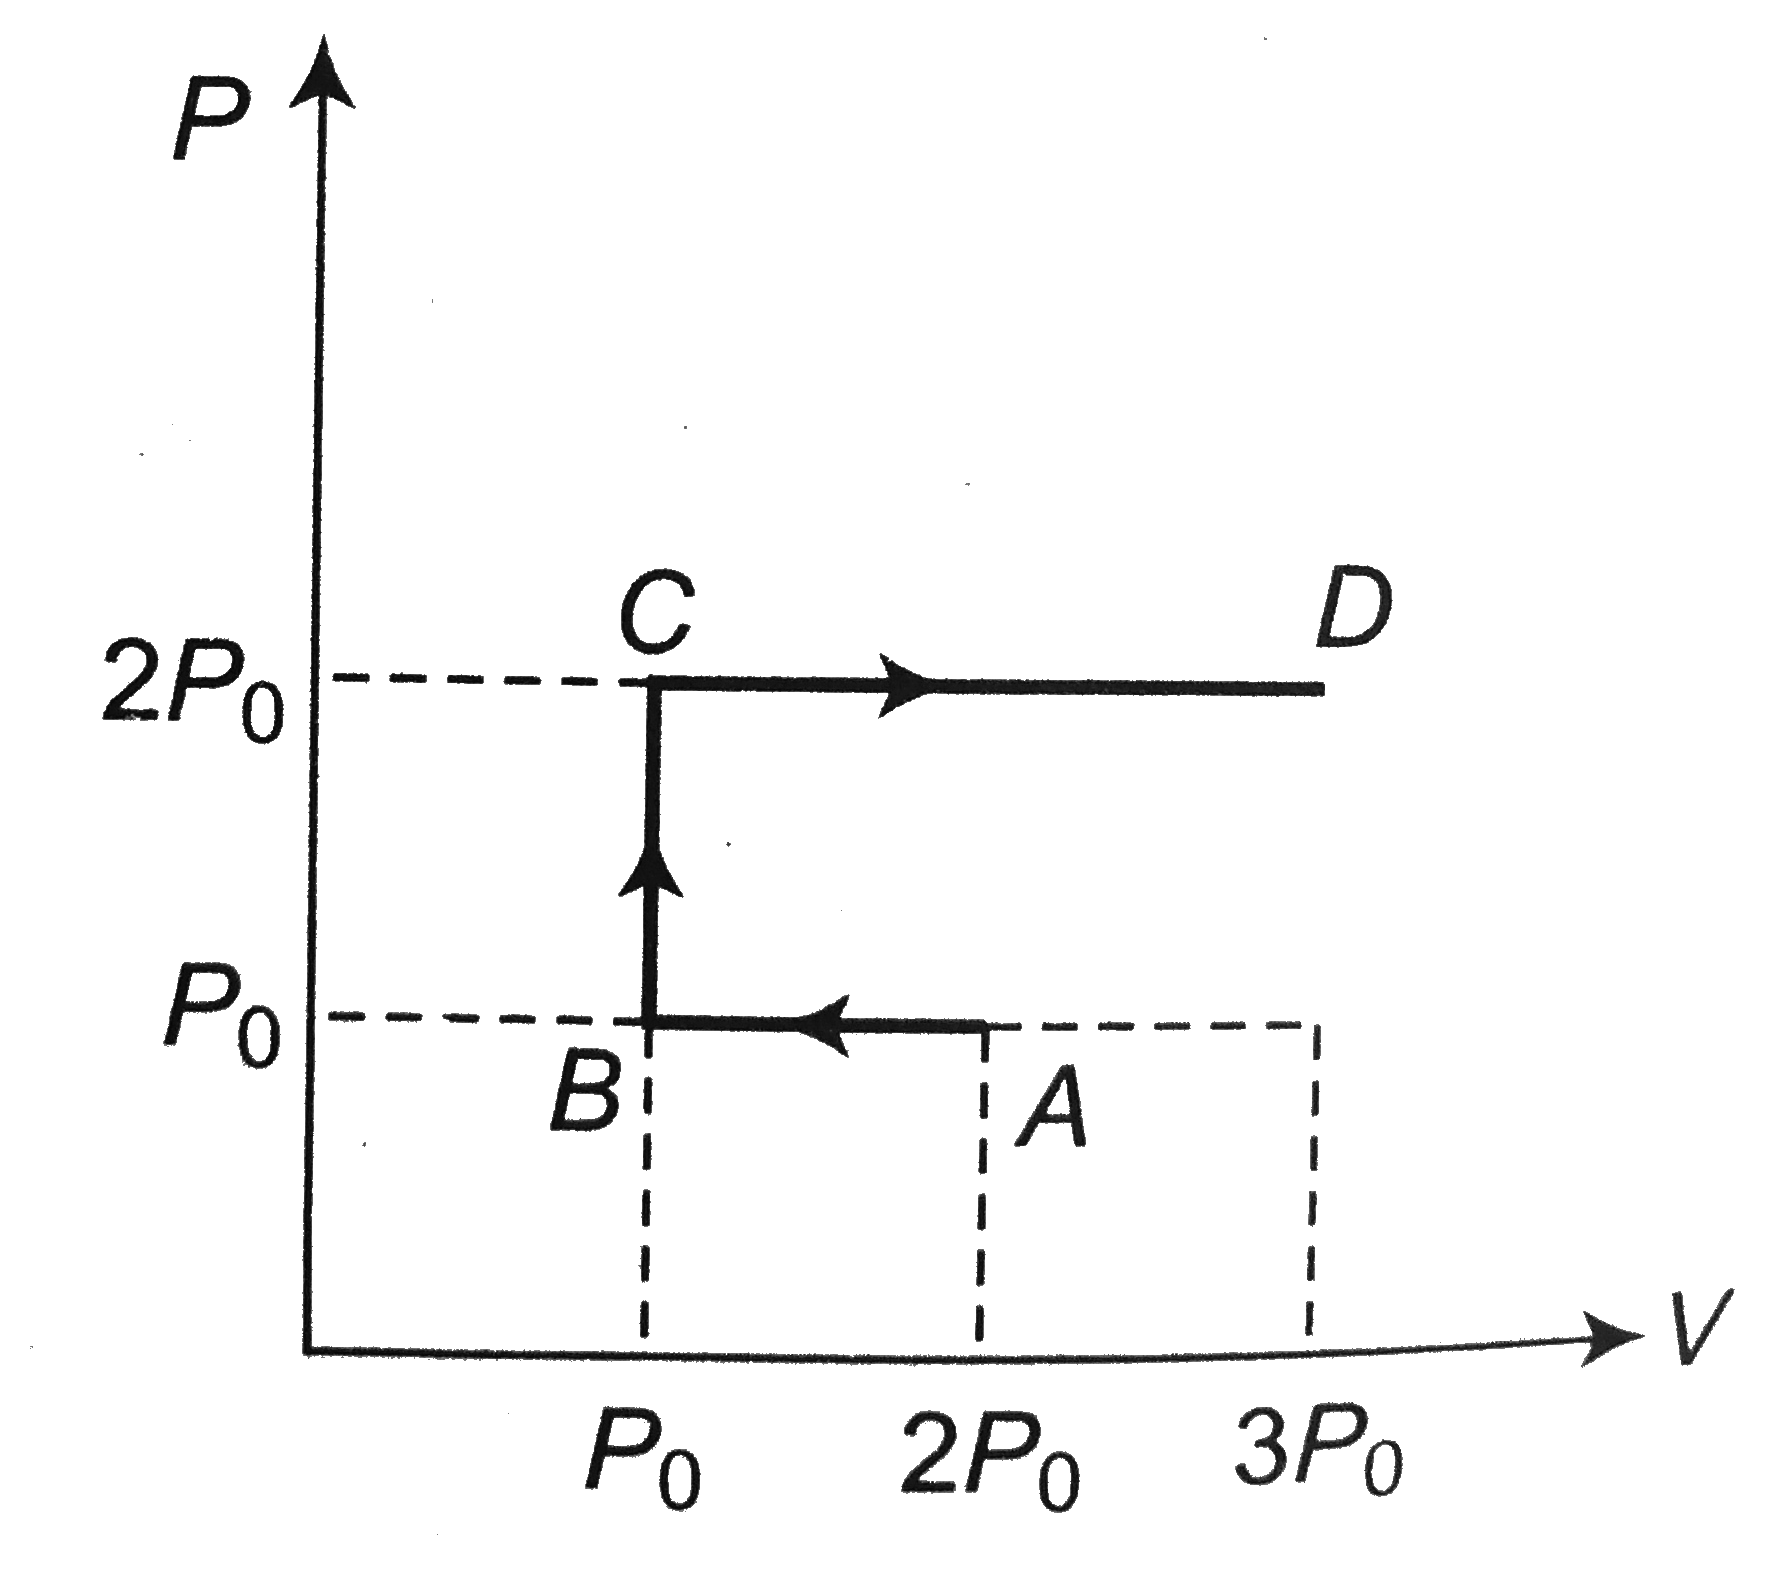
View Solutiongraph of an ideal gas is as shown in figure.
Heat is supplied to the gas in process (s).
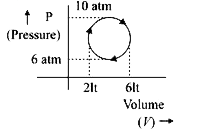
View SolutionAn ideal gas undergoes a cyclic process whose indicator diagram is as shown in the figure. Find the work done by the gas in 1 complete cycle.
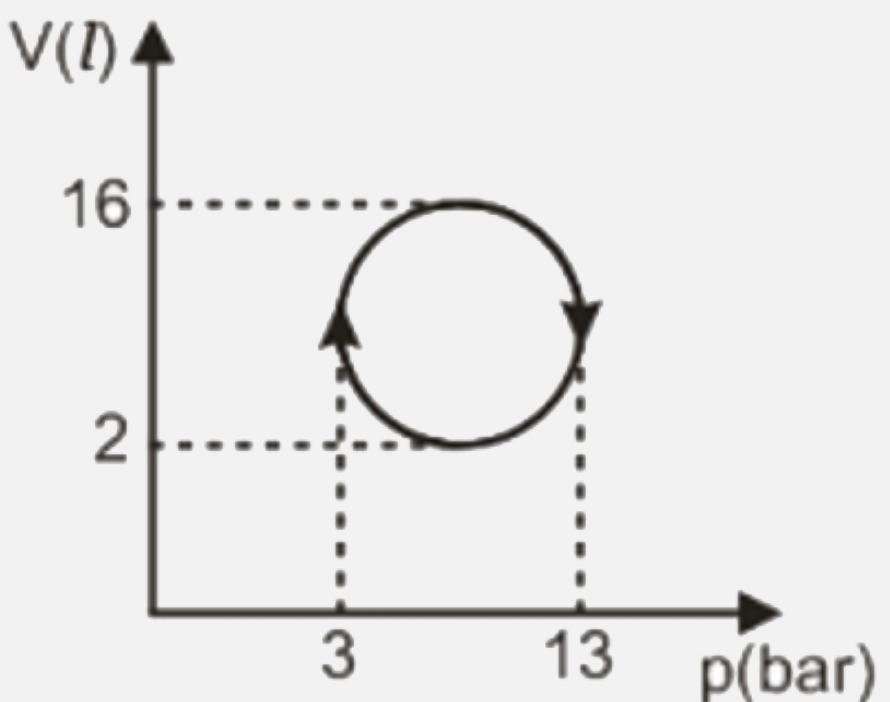
View SolutionWork done (in kJ) by the gas in the following cyclic process is
View SolutionFind work done by the gas in the process shown in figure.
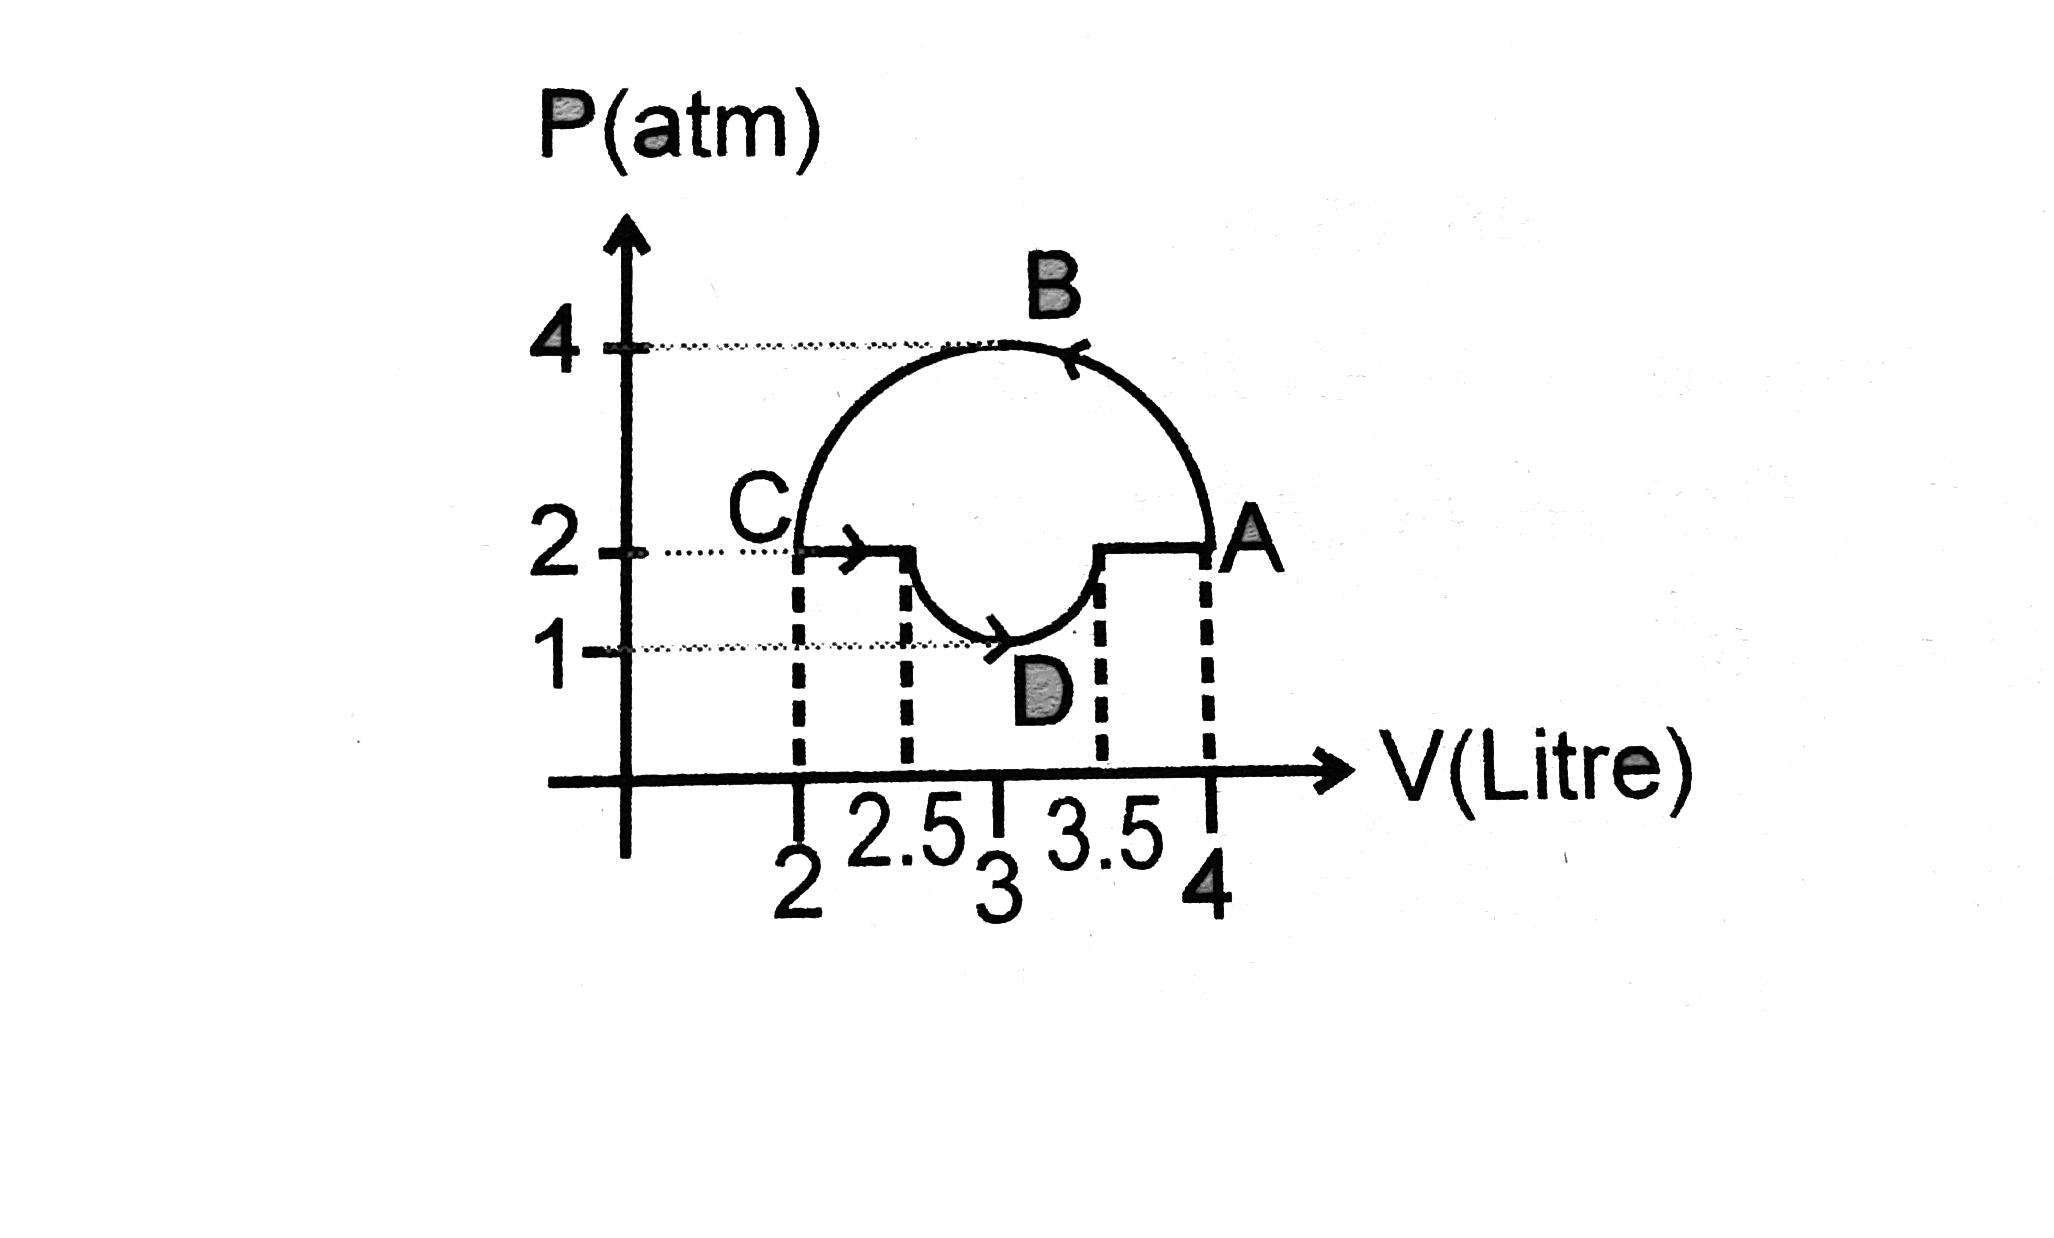
View SolutionFind work done by the gas in the process shown in figure.

View SolutionThree moles of an ideal gas undergo a cyclic process shown in figure. The work done by the gas during the process is ["Take ln (2)" = 0.693]
A. 2.36 RT0
B. 0.5RT0
C. 1.16RT0
D. −0.58RT0
View Solution


