P – V graph of an ideal gas is as shown in the diagram . Work done by the gas in the process ABCD is
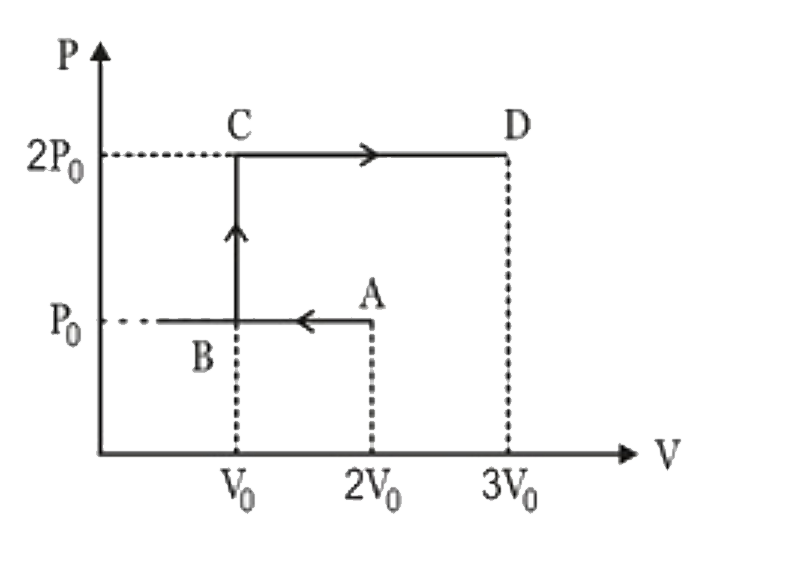
4P0V0
2P0V0
3P0V0
P0V0
The correct Answer is:C
Step by step video & image solution for P – V graph of an ideal gas is as shown in the diagram . Work done by the gas in the process ABCD is by Physics experts to help you in doubts & scoring excellent marks in Class 12 exams.
Updated on:21/07/2023Similar Questions
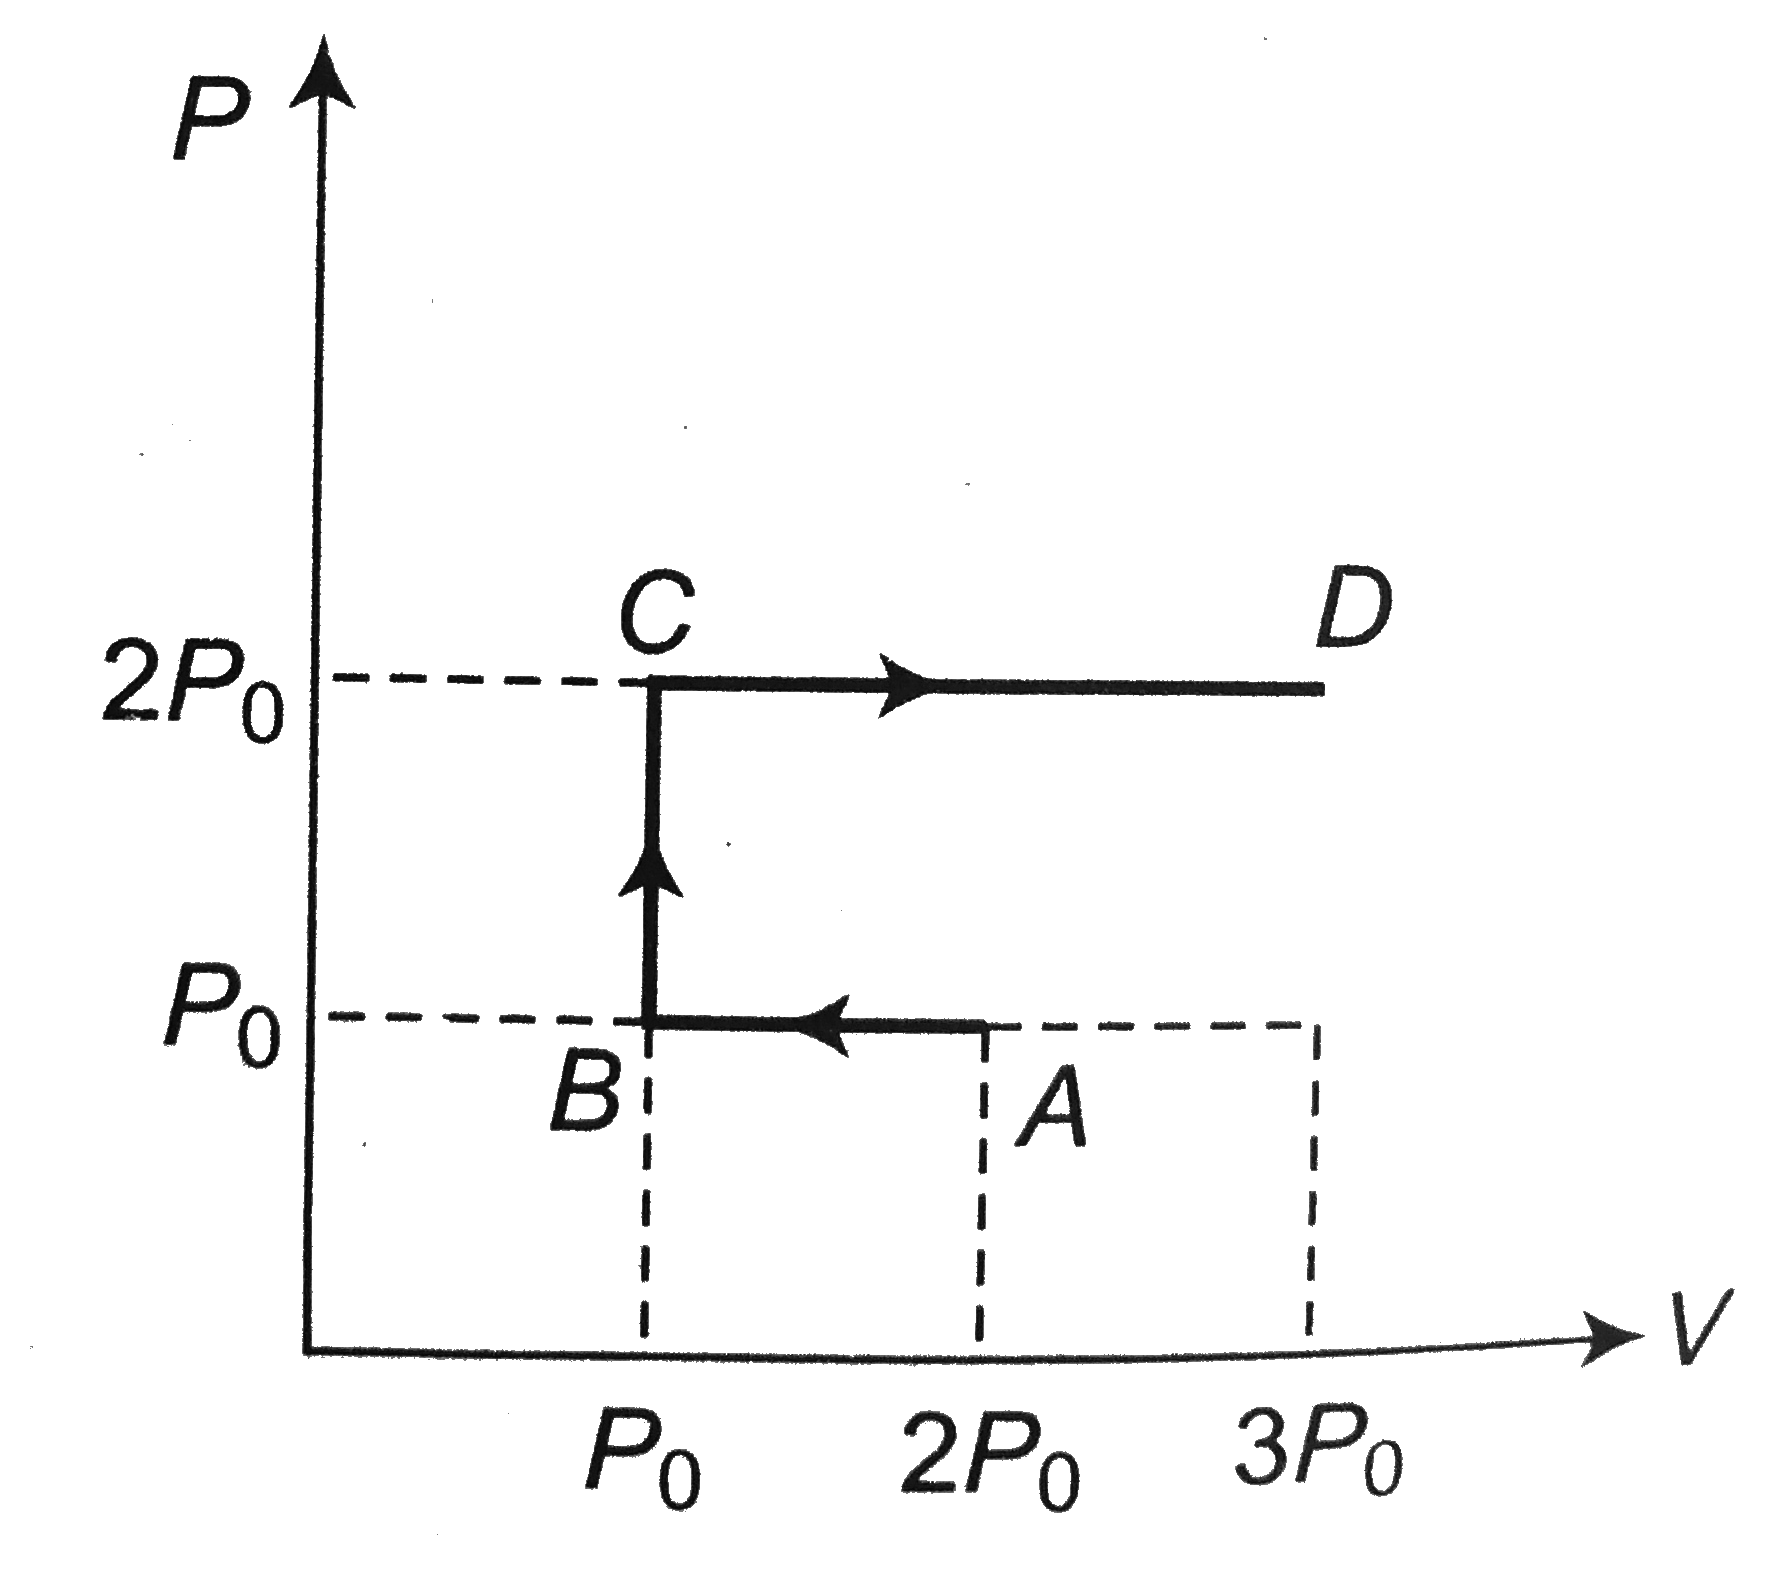
P-V diagram of an ideal gas is as shown in figure. Work done by the gas in the process ABCD is

View SolutionP−V diagram of an ideal gas is as shown in figure. Work done by the gas in process ABCD is
View Solutiongraph of an ideal gas is as shown in figure.
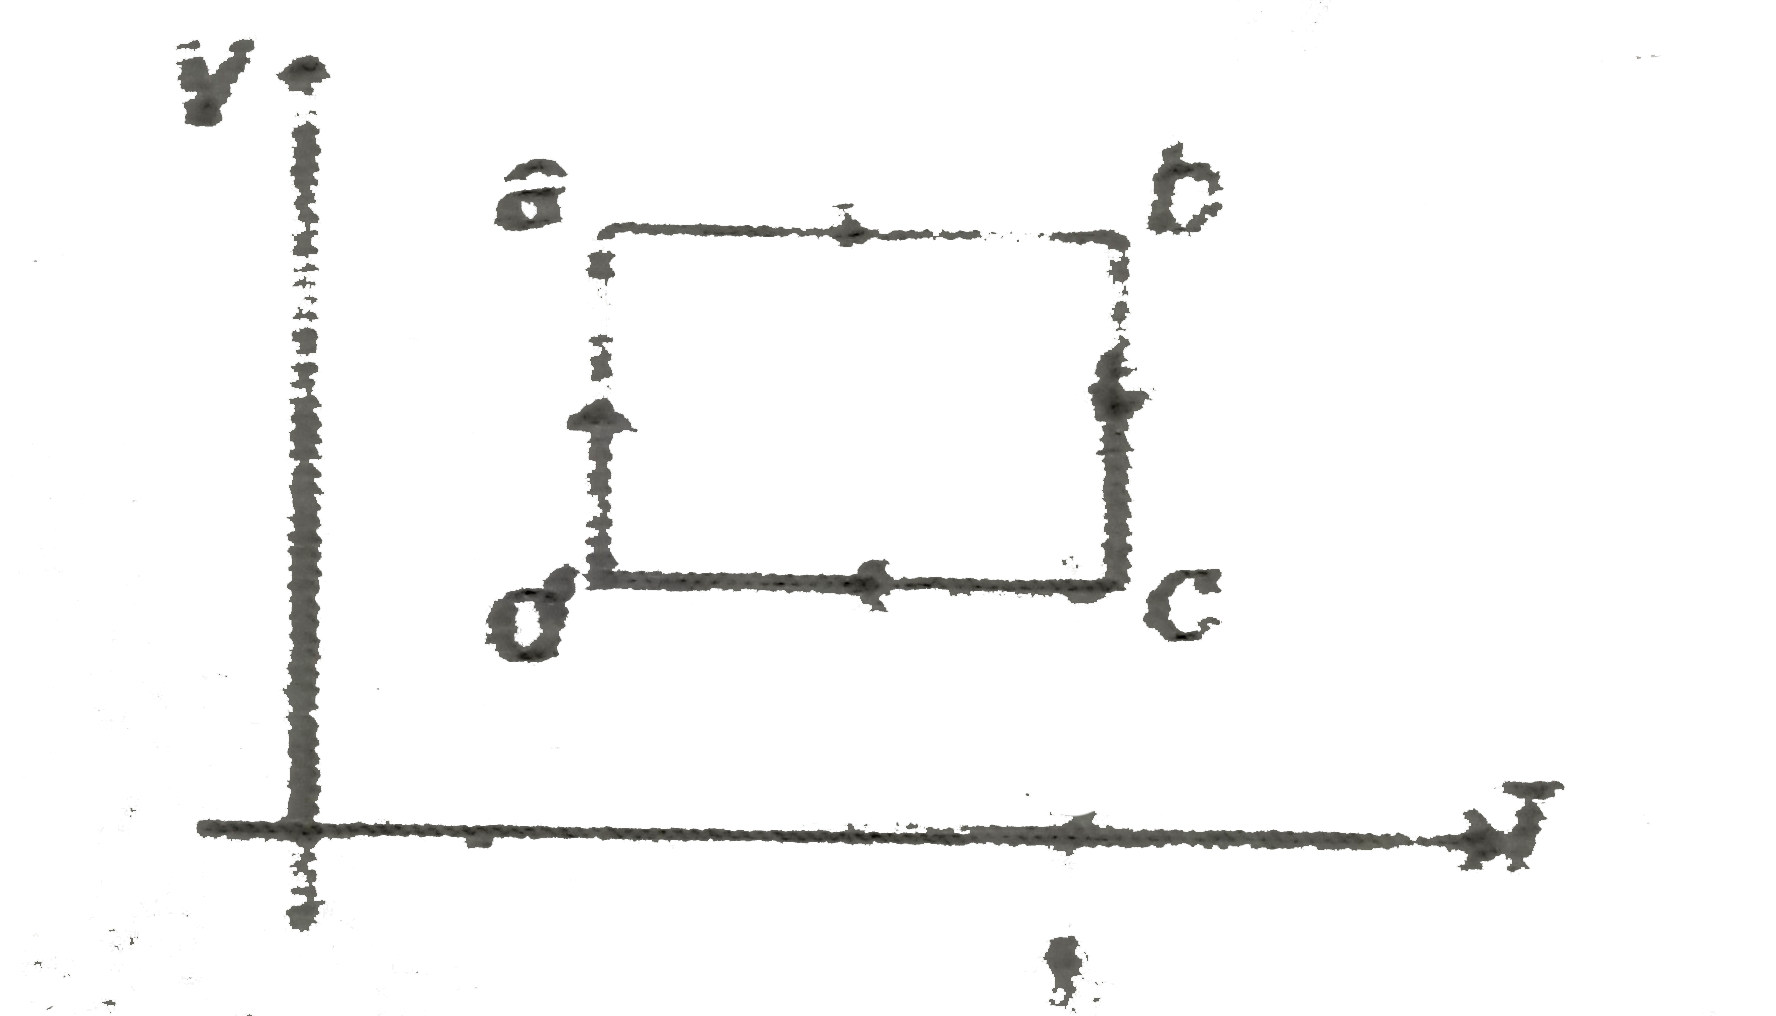
Work done by the gas in complete cyclic process about is
View Solutiongraph of an ideal gas is as shown in figure.
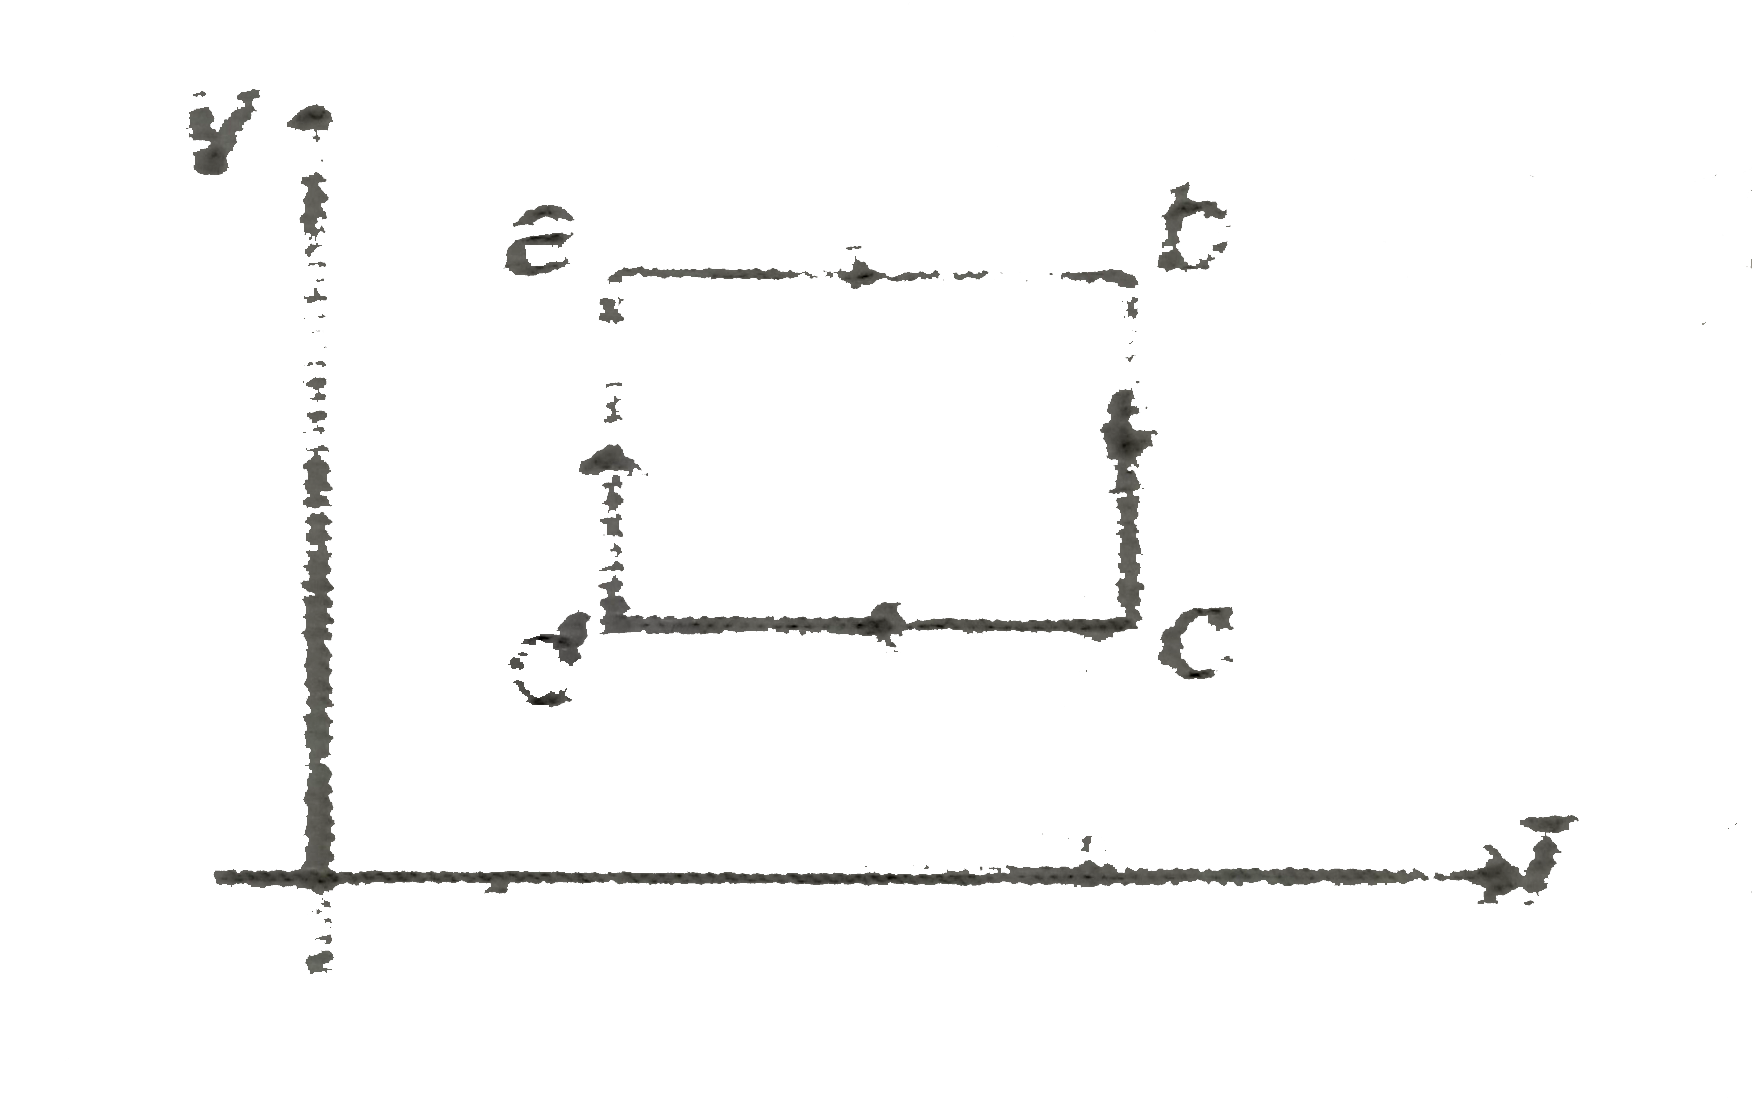
Heat is supplied to the gas in process (s).
View SolutionOne mole of an ideal gas has an interal energy given by U=U0+2PV , where P is the pressure and V the volume of the gas. U0 is a constant. This gas undergoes the quasi− static cyclic process ABCD as shown in the U−V diagram. The work done by the ideal gas in the process AB is
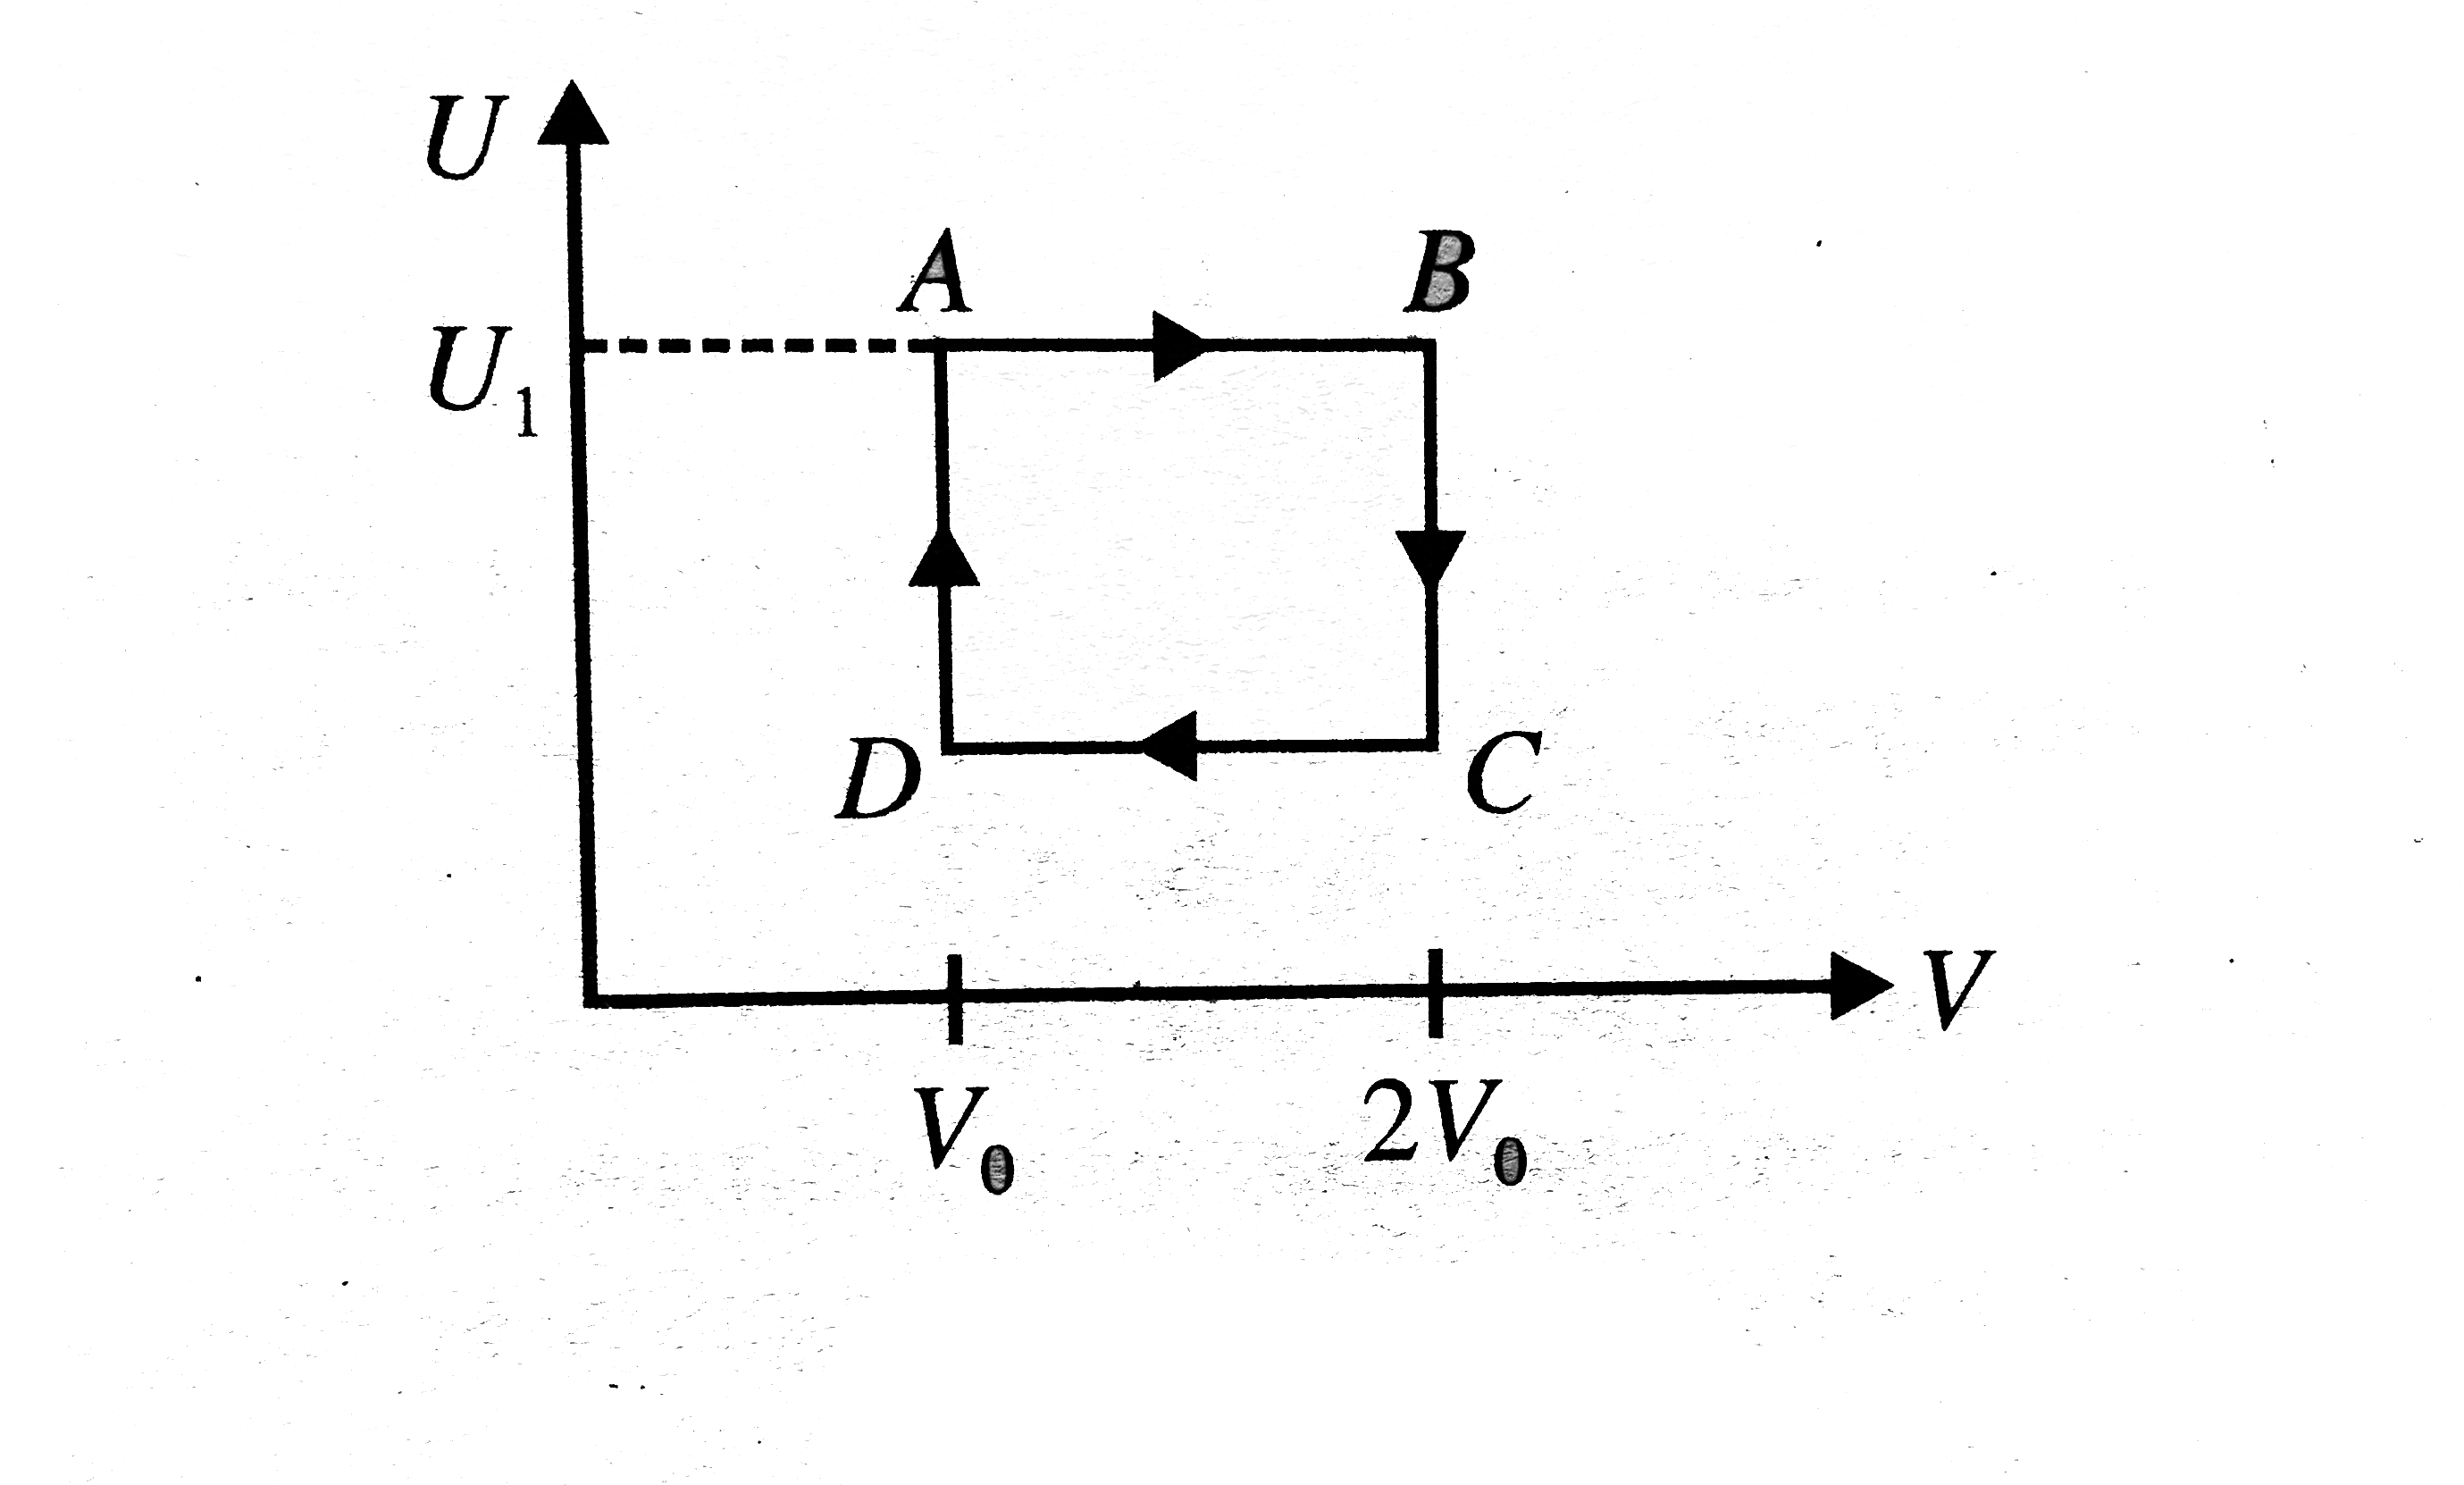
View SolutionFind work done by the gas in the process shown in figure.
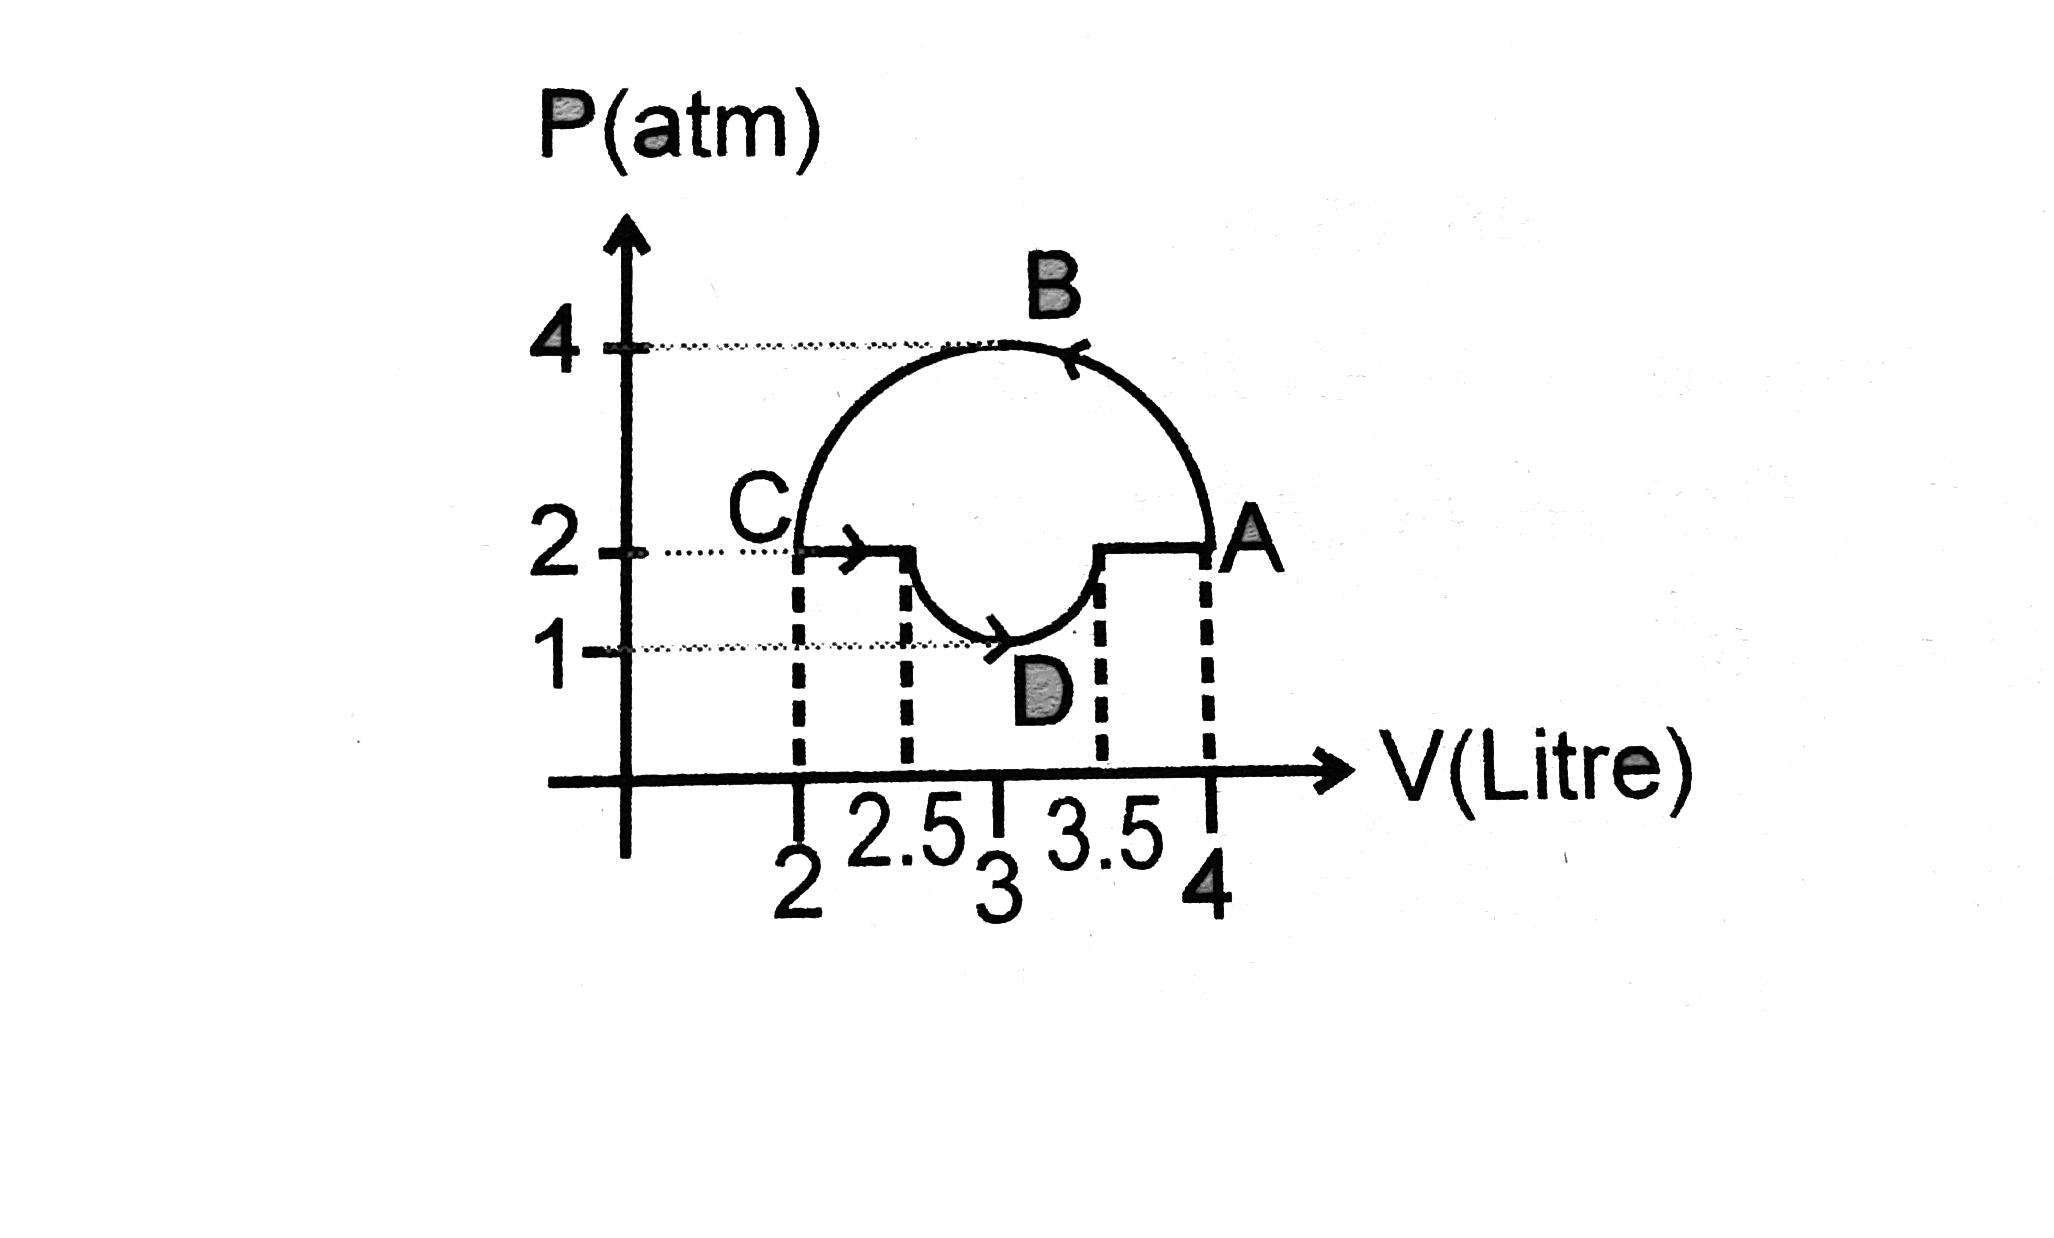
View SolutionFind work done by the gas in the process shown in figure.

View SolutionThe figure shows a P.V graph of the thermodynamic behavious of an ideal gas. Find out form this graph (i) work done by the gas in the process A→B,B→C,C→DandD→A. (ii) work done by the gas in complete cycle A→B→C→D→A.
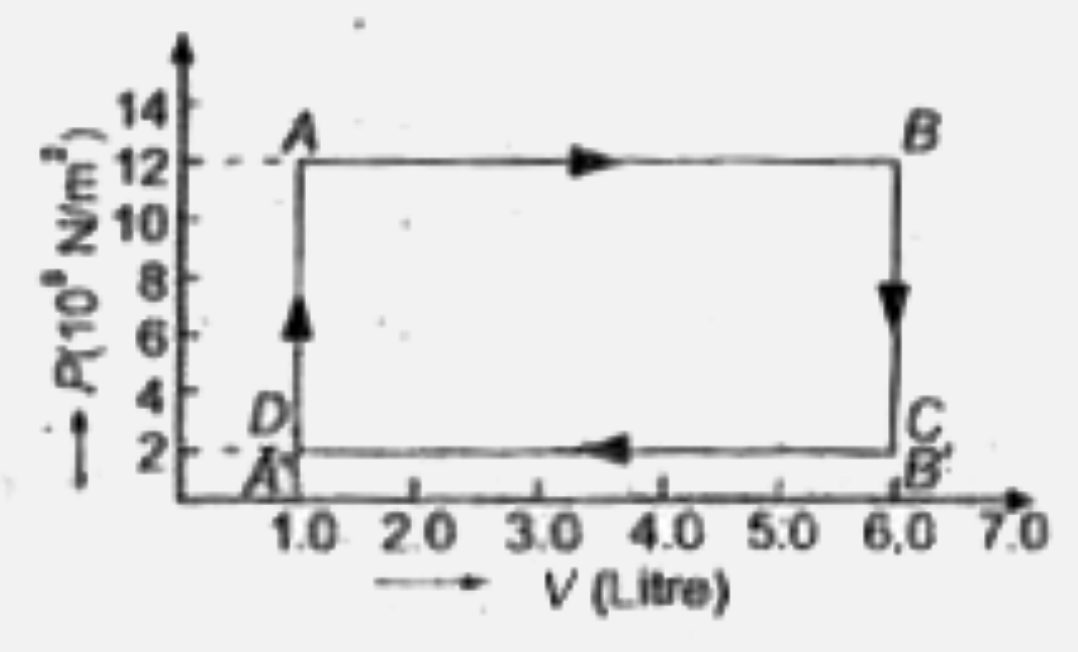
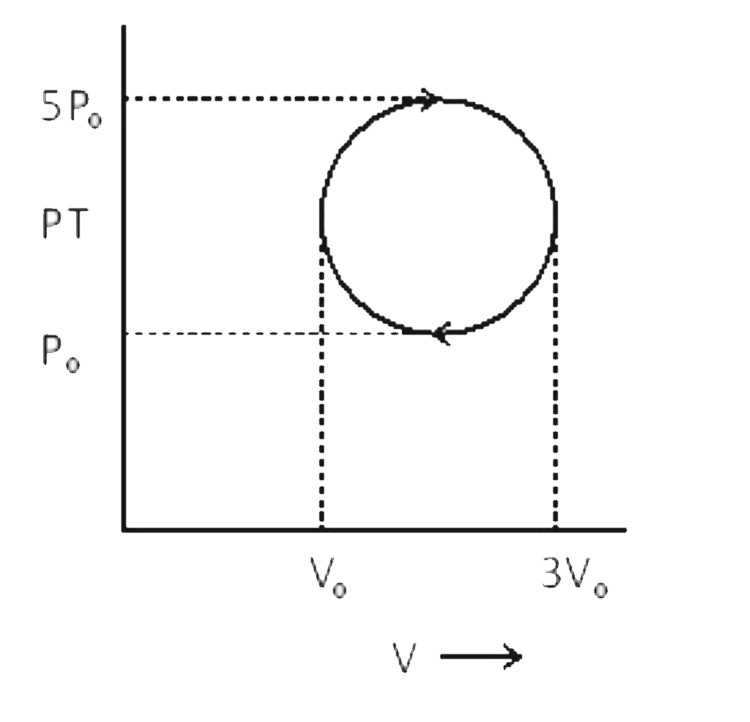
View SolutionP – V graph for a cyclic process is shown in figure . Work done is given by
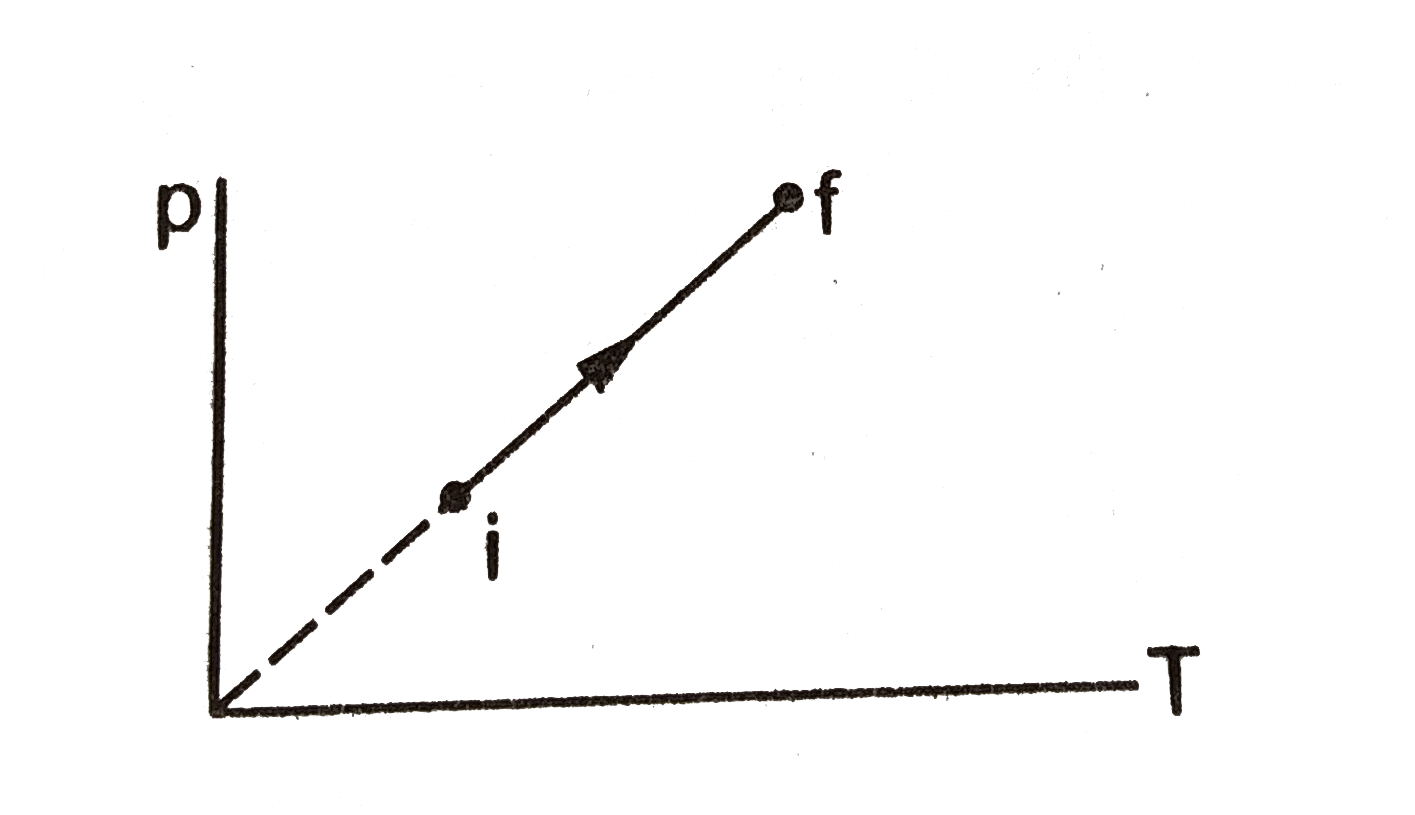
View SolutionAn ideal gas goes from the state i to the state ∫ as shown in .the work done by the gas during the process
View Solution
