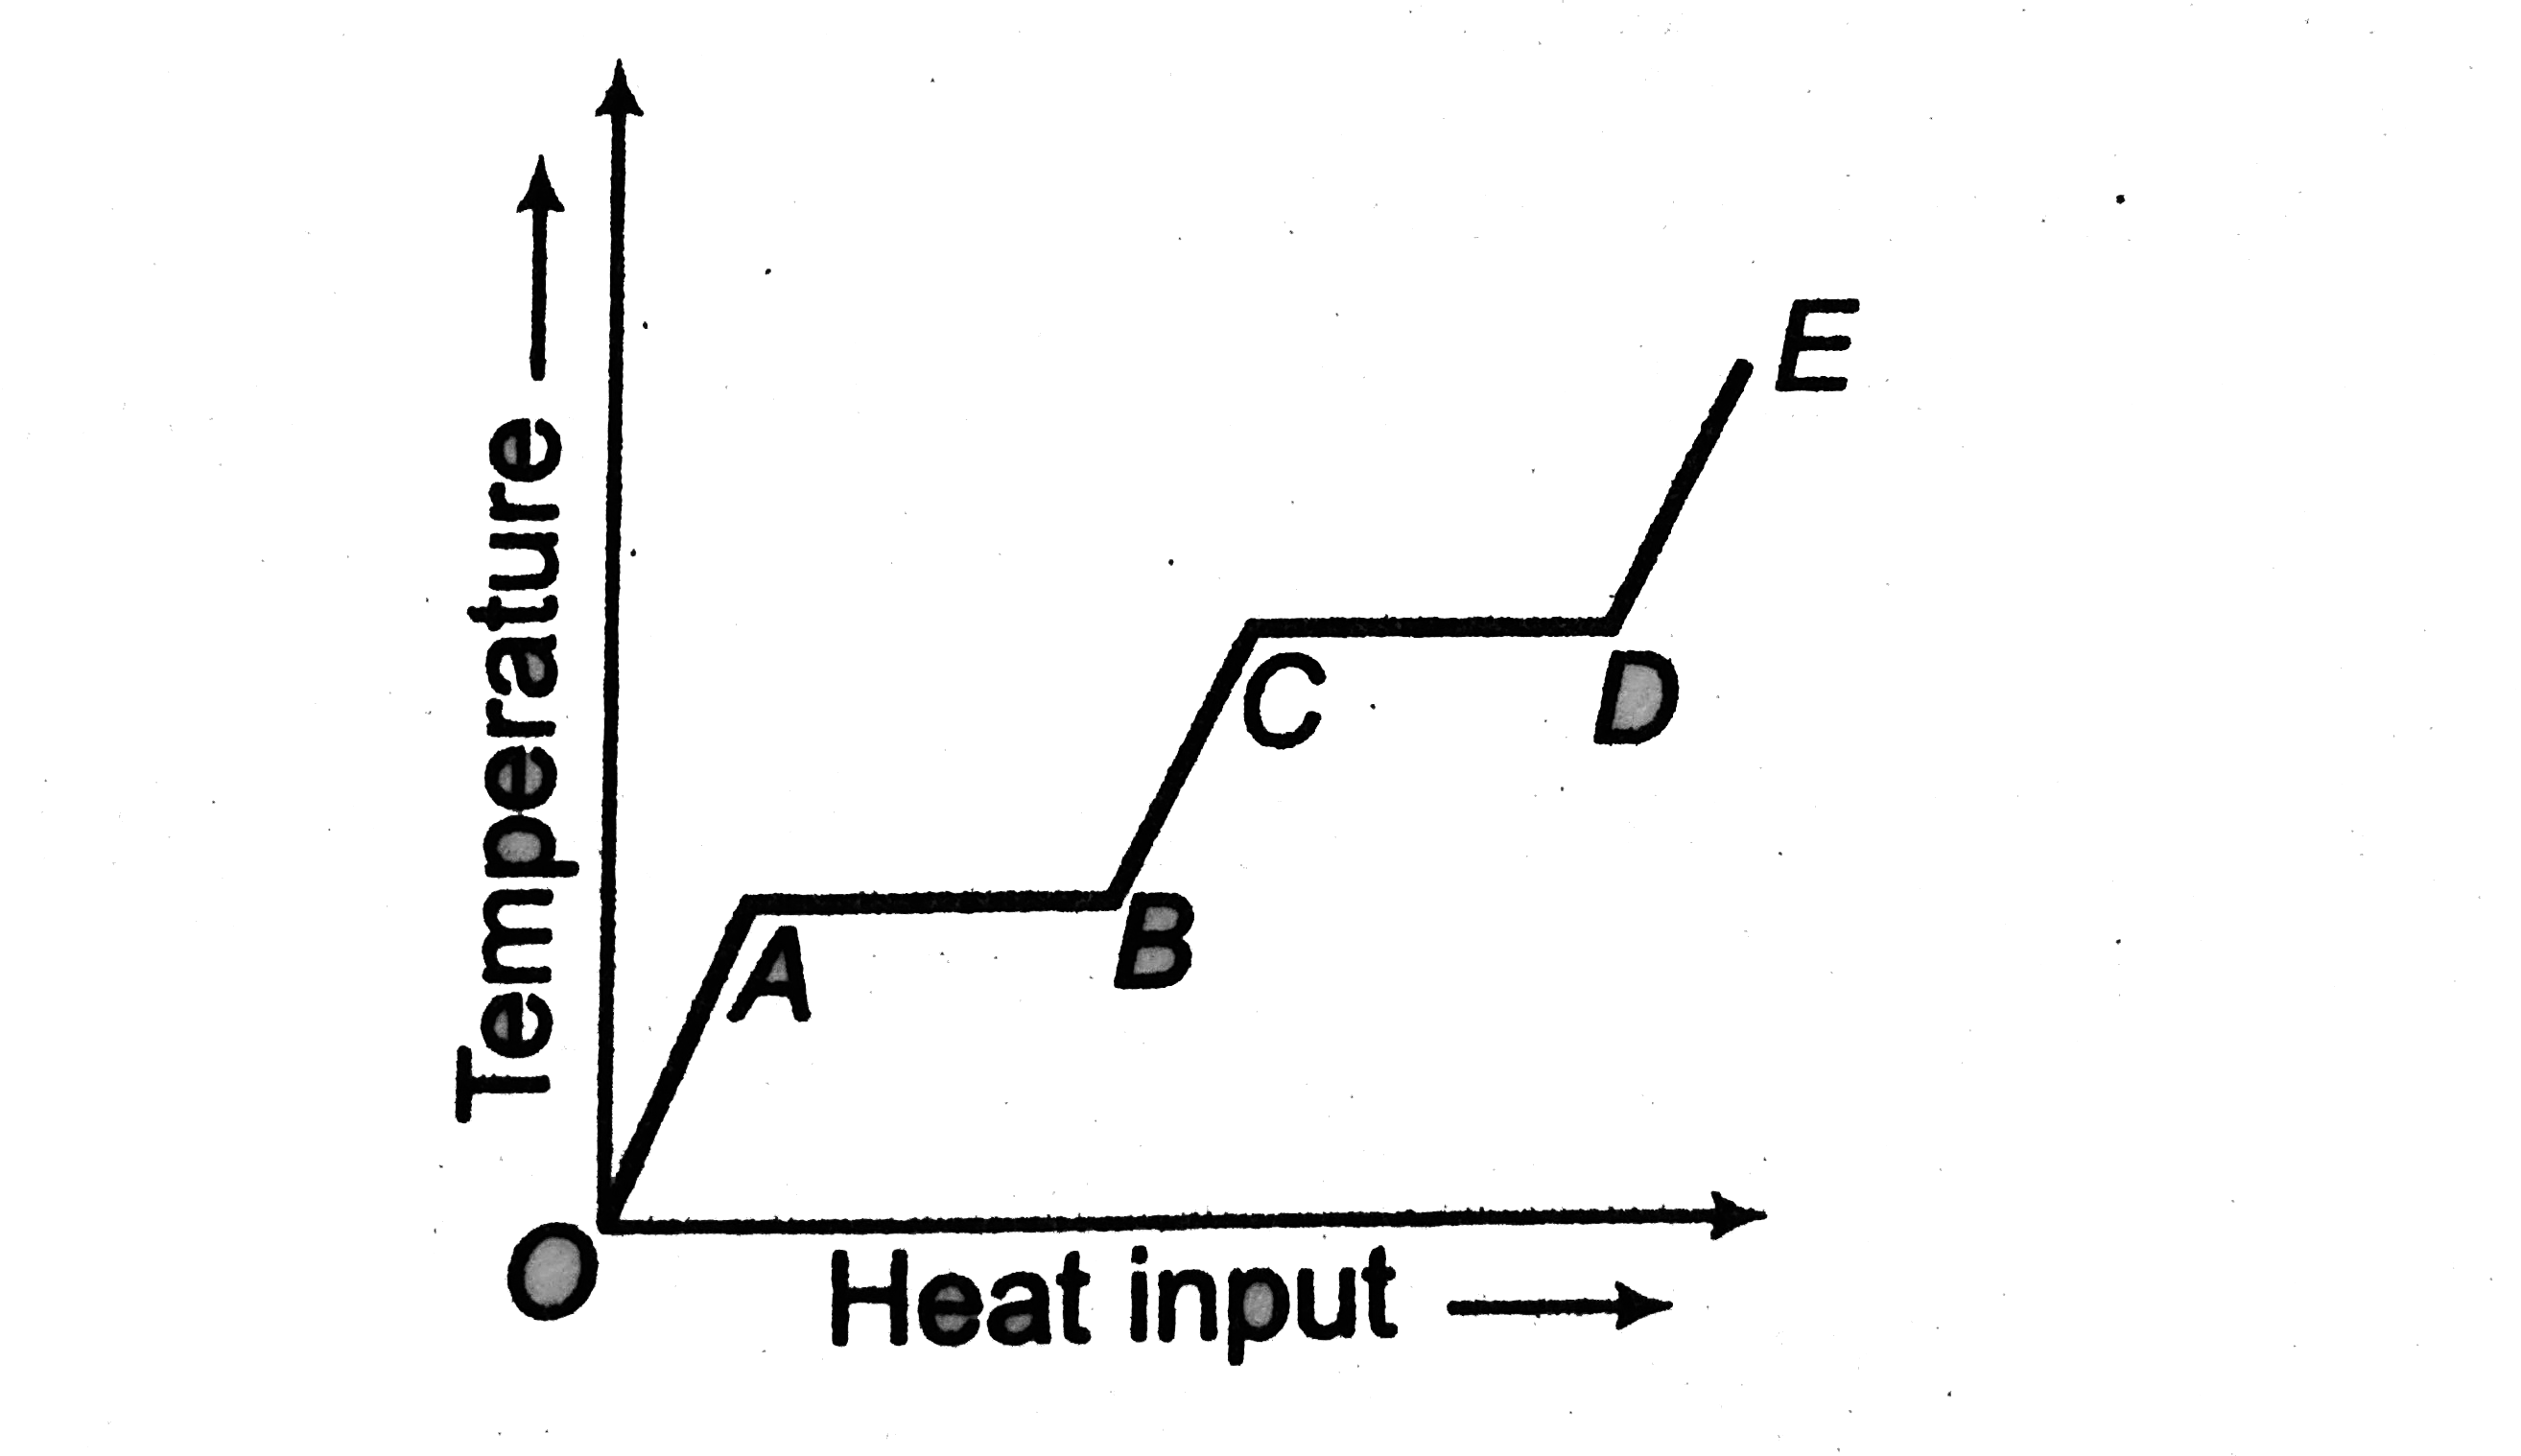
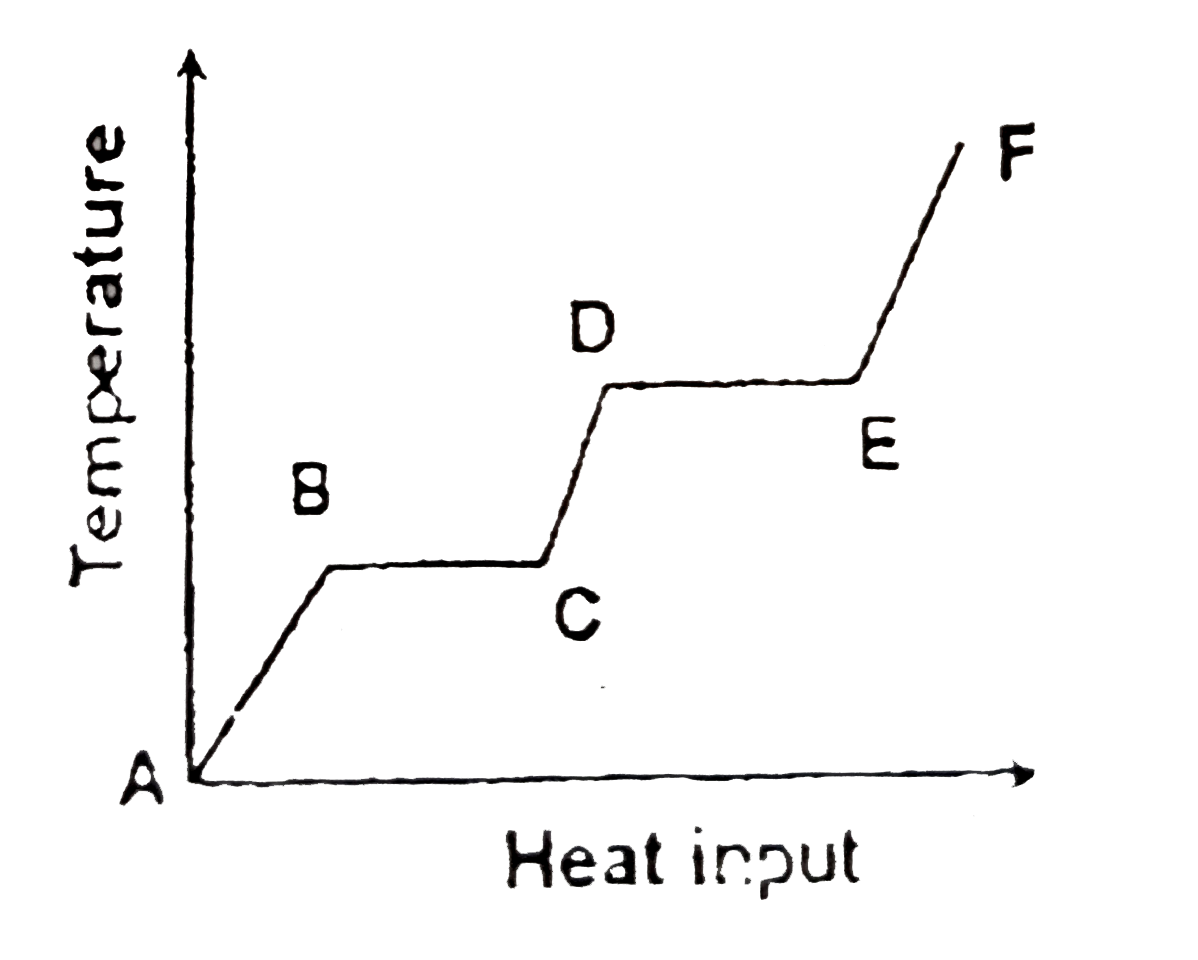
A solid material is supplied heat at a constant rate. The temperature of material is changing with heat input as shown in the figure. What does the slope of DE represent ?
latent heat of liquid
latent heat of vapour
heat capacity of vapour
inverse of heat capacity of vapour
The correct Answer is:D
ΔQ=mcΔT
Slope of inclined line ΔQΔT=1mc = 1/(Thermal capacity)
Topper's Solved these Questions
- CALORIMETRY AND HEAT TRANSFERBOOK - DC PANDEY ENGLISHCHAPTER - CALORIMETRY AND HEAT TRANSFEREXERCISE - Check points 16.3
20 Videos
- CALORIMETRY AND HEAT TRANSFERBOOK - DC PANDEY ENGLISHCHAPTER - CALORIMETRY AND HEAT TRANSFEREXERCISE - Check points 16.4
29 Videos
- CALORIMETRY AND HEAT TRANSFERBOOK - DC PANDEY ENGLISHCHAPTER - CALORIMETRY AND HEAT TRANSFEREXERCISE - Check point 16.1
10 Videos
- CALORIMETRY & HEAT TRANSFERBOOK - DC PANDEY ENGLISHCHAPTER - CALORIMETRY & HEAT TRANSFEREXERCISE - Level 2 Subjective
14 Videos
- CENTRE OF MASSBOOK - DC PANDEY ENGLISHCHAPTER - CENTRE OF MASSEXERCISE - Medical entrances gallery
27 Videos
Similar Questions
A solid material is supplied with heat at a constant rate. The temperature of the material is changing with the heat input as shown in the graph in figure. Study the graph carefully and answer the following questions:
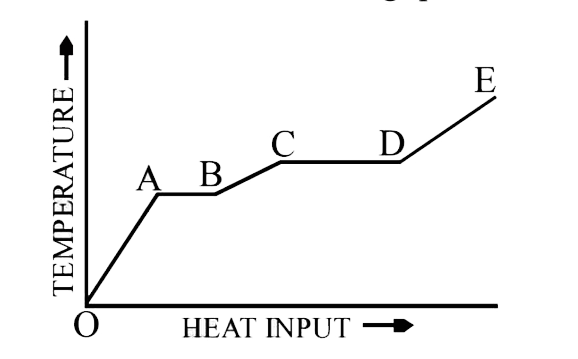
(i) What do the horizontal regions AB and CD represent?
(ii) If CD is equal to 2AB, what do you infer?
(iii) What does the slope of DE represents?
(iv) The slope of OA>the slope of BC. What does this indicate?
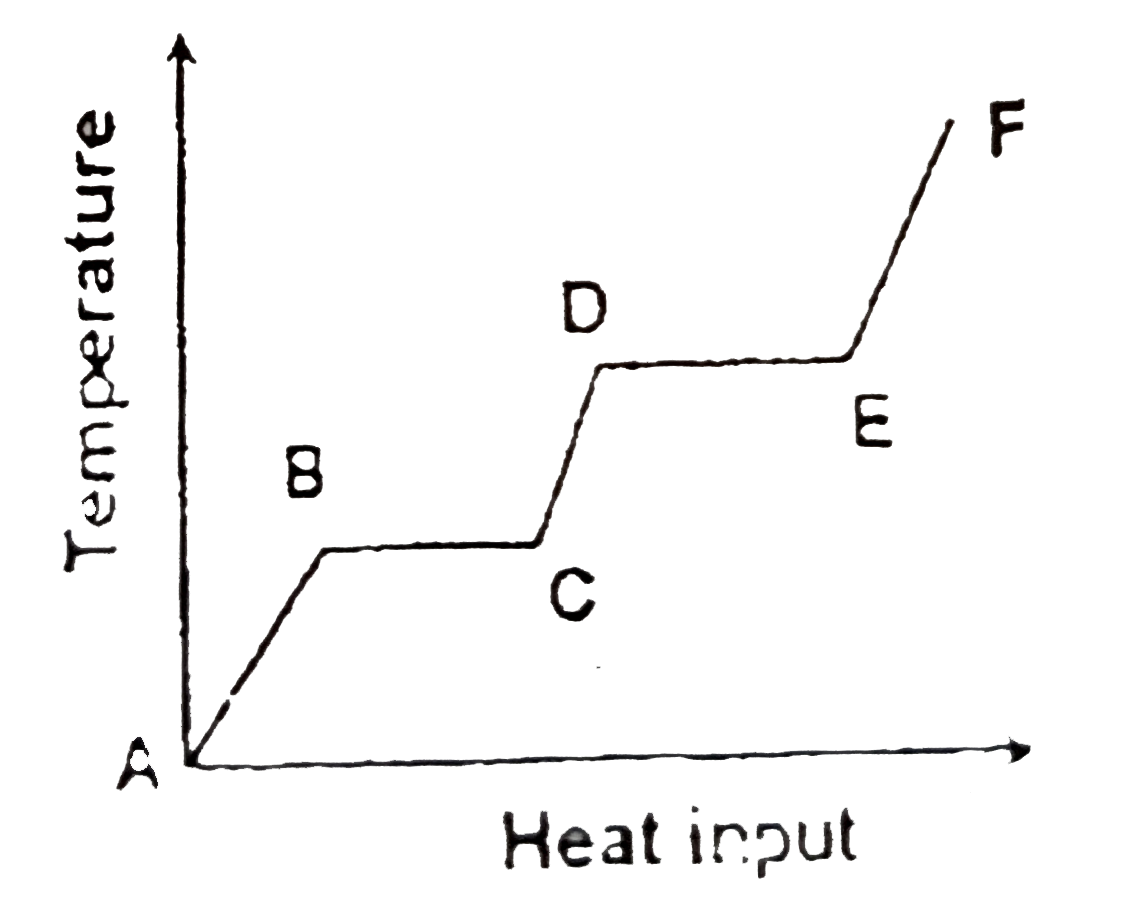
View SolutionWhen we raise the temperature of a body, the molecules and atoms move with greater kinetic enery. Assume that "the temperature" is the manifestation of only the kinetic energy is atomic and subatomic levels and no mass change (excess//defect) occurs due to heating. Now a solid material is supplied with heat at a constant rate. The temperature of the material is changing with the heat input as shown in the graph. BC and DE are parallel to the Heat-input axis
In BC and DE
View SolutionWhen we raise the temperature of a body, the molecules and atoms move with greater kinetic enery. Assume that "the temperature" is the manifestation of only the kinetic energy is atomic and subatomic levels and no mass change (excess//defect) occurs due to heating. Now a solid material is supplied with heat at a constant rate. The temperature of the material is changing with the heat input as shown in the graph. BC and DE are parallel to the Heat-input axis
In AB, CD and EF, the energy of the system increases. Here "energy" refers to
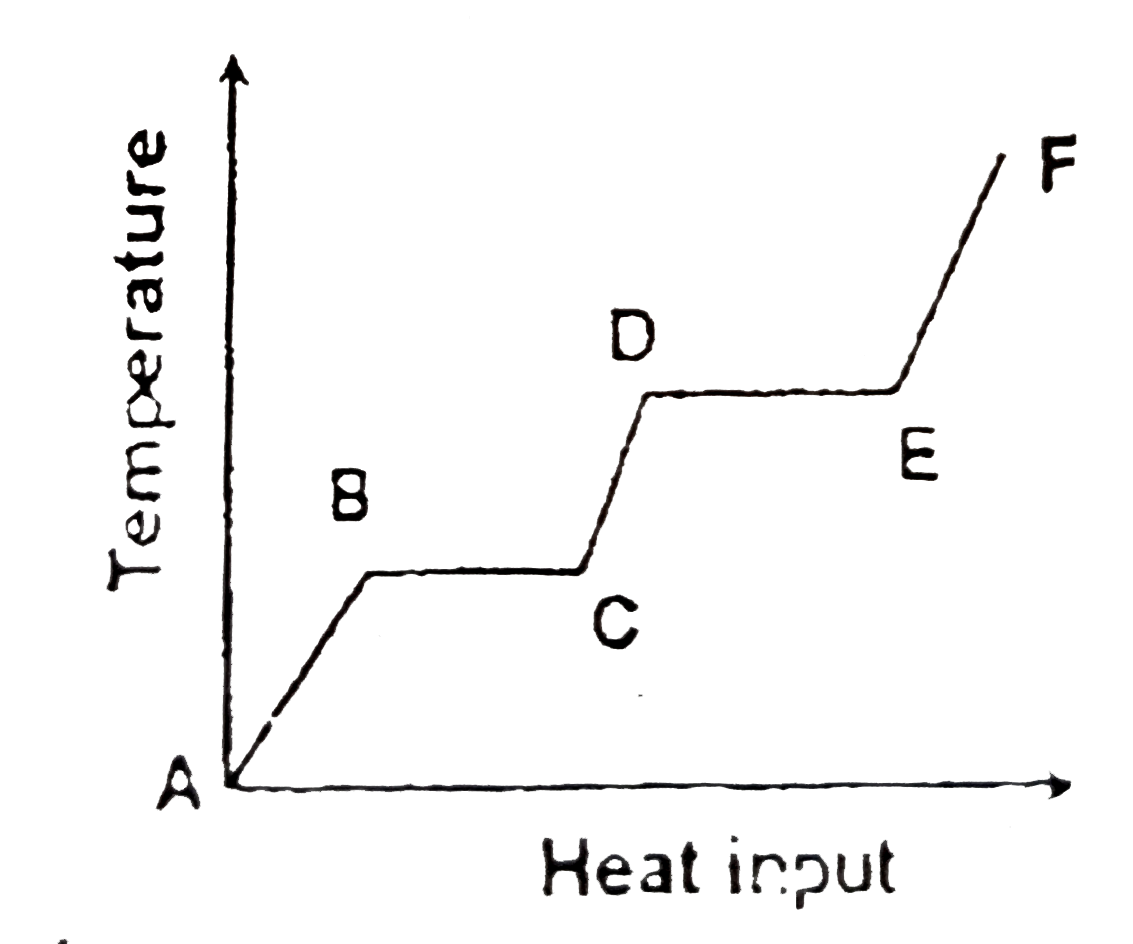
View SolutionWhen we raise the temperature of a body, the molecules and atoms move with greater kinetic enery. Assume that "the temperature" is the manifestation of only the kinetic energy is atomic and subatomic levels and no mass change (excess//defect) occurs due to heating. Now a solid material is supplied with heat at a constant rate. The temperature of the material is changing with the heat input as shown in the graph. BC and DE are parallel to the Heat-input axis
In which of the following phase the assumption made in the above comprehension is most precise ?
View Solution
A solid material is supplied with heat at a constant rate. The temperature of the material is changing with heat input as shown
(i) AB: change of state from solid to liquid.
CD: change of state from liquid to vapour
(ii) When CD=2AB, i.e., latent heat of vapourization is twice the latent heat of fusion of the substance.
(iii) The reciprocal of slope of DE represents the heat capacity of vapour state of substance .
(iv) If slope of OA>slope of BC, i.e., specific heat of liquid state is greater than specific heat that of solid state.
View SolutionAt what temperature does a body strip radiating heat ?
View SolutionIf heat a supplied to a solid, its temperature
View SolutionA piece of ice is heated at a constant rate. The variation in temperature with time of heating is shown in the graph in Fig. 11.6.
(i) What is represented by the part AB ?
(ii) What does the part CD represent ?
(iii) What conclusion do you draw regarding the nature of ice from the graph ?
View Solution_E01_007_Q01.png)
The load versus elongation graph for four wires of the same material and same length is shown in the figure. The hinnest wire is represented by the line
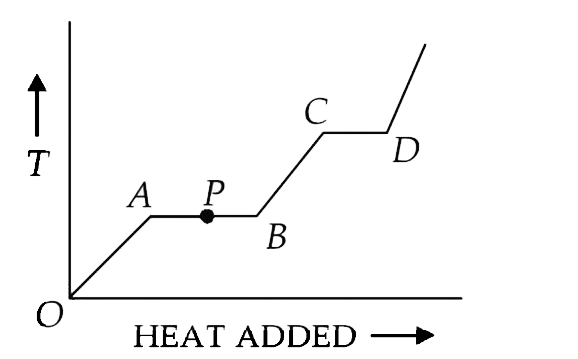
View SolutionThe variation of temperature of a material as heat is given to it at a constant rate is shown in the figure. The material is in solid state at the point O. The state of the material at the point P is…..
View Solution
