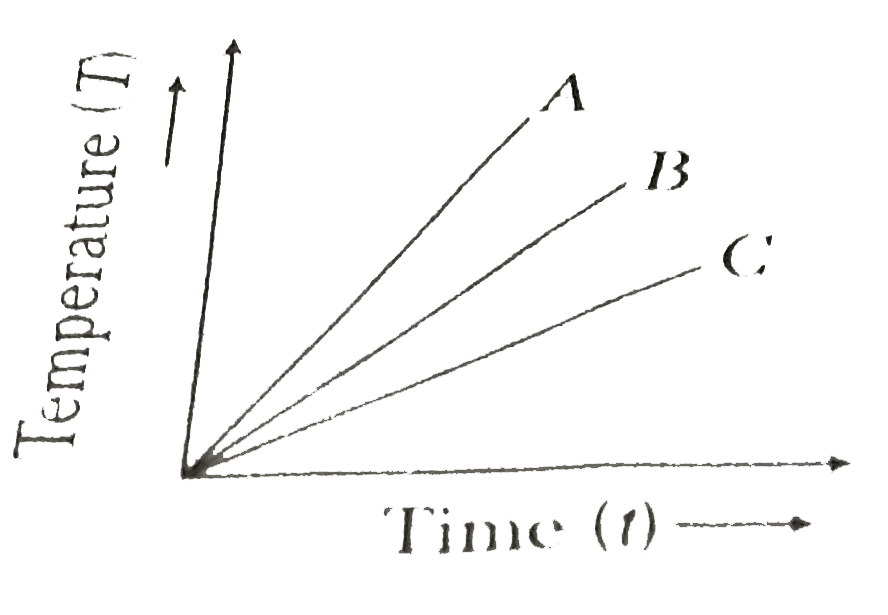
The temperatures versus time graph is shown in figure. Which of the substance A,B and C has the lowest heat capacity if heat is supplied to all of them at equal rates.
A
B
C
All the above
The correct Answer is:A
Slope α (1)/(Heat capacity)
Topper's Solved these Questions
- CALORIMETRY AND HEAT TRANSFERBOOK - DC PANDEY ENGLISHCHAPTER - CALORIMETRY AND HEAT TRANSFEREXERCISE - Check points 16.3
20 Videos
- CALORIMETRY AND HEAT TRANSFERBOOK - DC PANDEY ENGLISHCHAPTER - CALORIMETRY AND HEAT TRANSFEREXERCISE - Check points 16.4
29 Videos
- CALORIMETRY AND HEAT TRANSFERBOOK - DC PANDEY ENGLISHCHAPTER - CALORIMETRY AND HEAT TRANSFEREXERCISE - Check point 16.1
10 Videos
- CALORIMETRY & HEAT TRANSFERBOOK - DC PANDEY ENGLISHCHAPTER - CALORIMETRY & HEAT TRANSFEREXERCISE - Level 2 Subjective
14 Videos
- CENTRE OF MASSBOOK - DC PANDEY ENGLISHCHAPTER - CENTRE OF MASSEXERCISE - Medical entrances gallery
27 Videos
Similar Questions
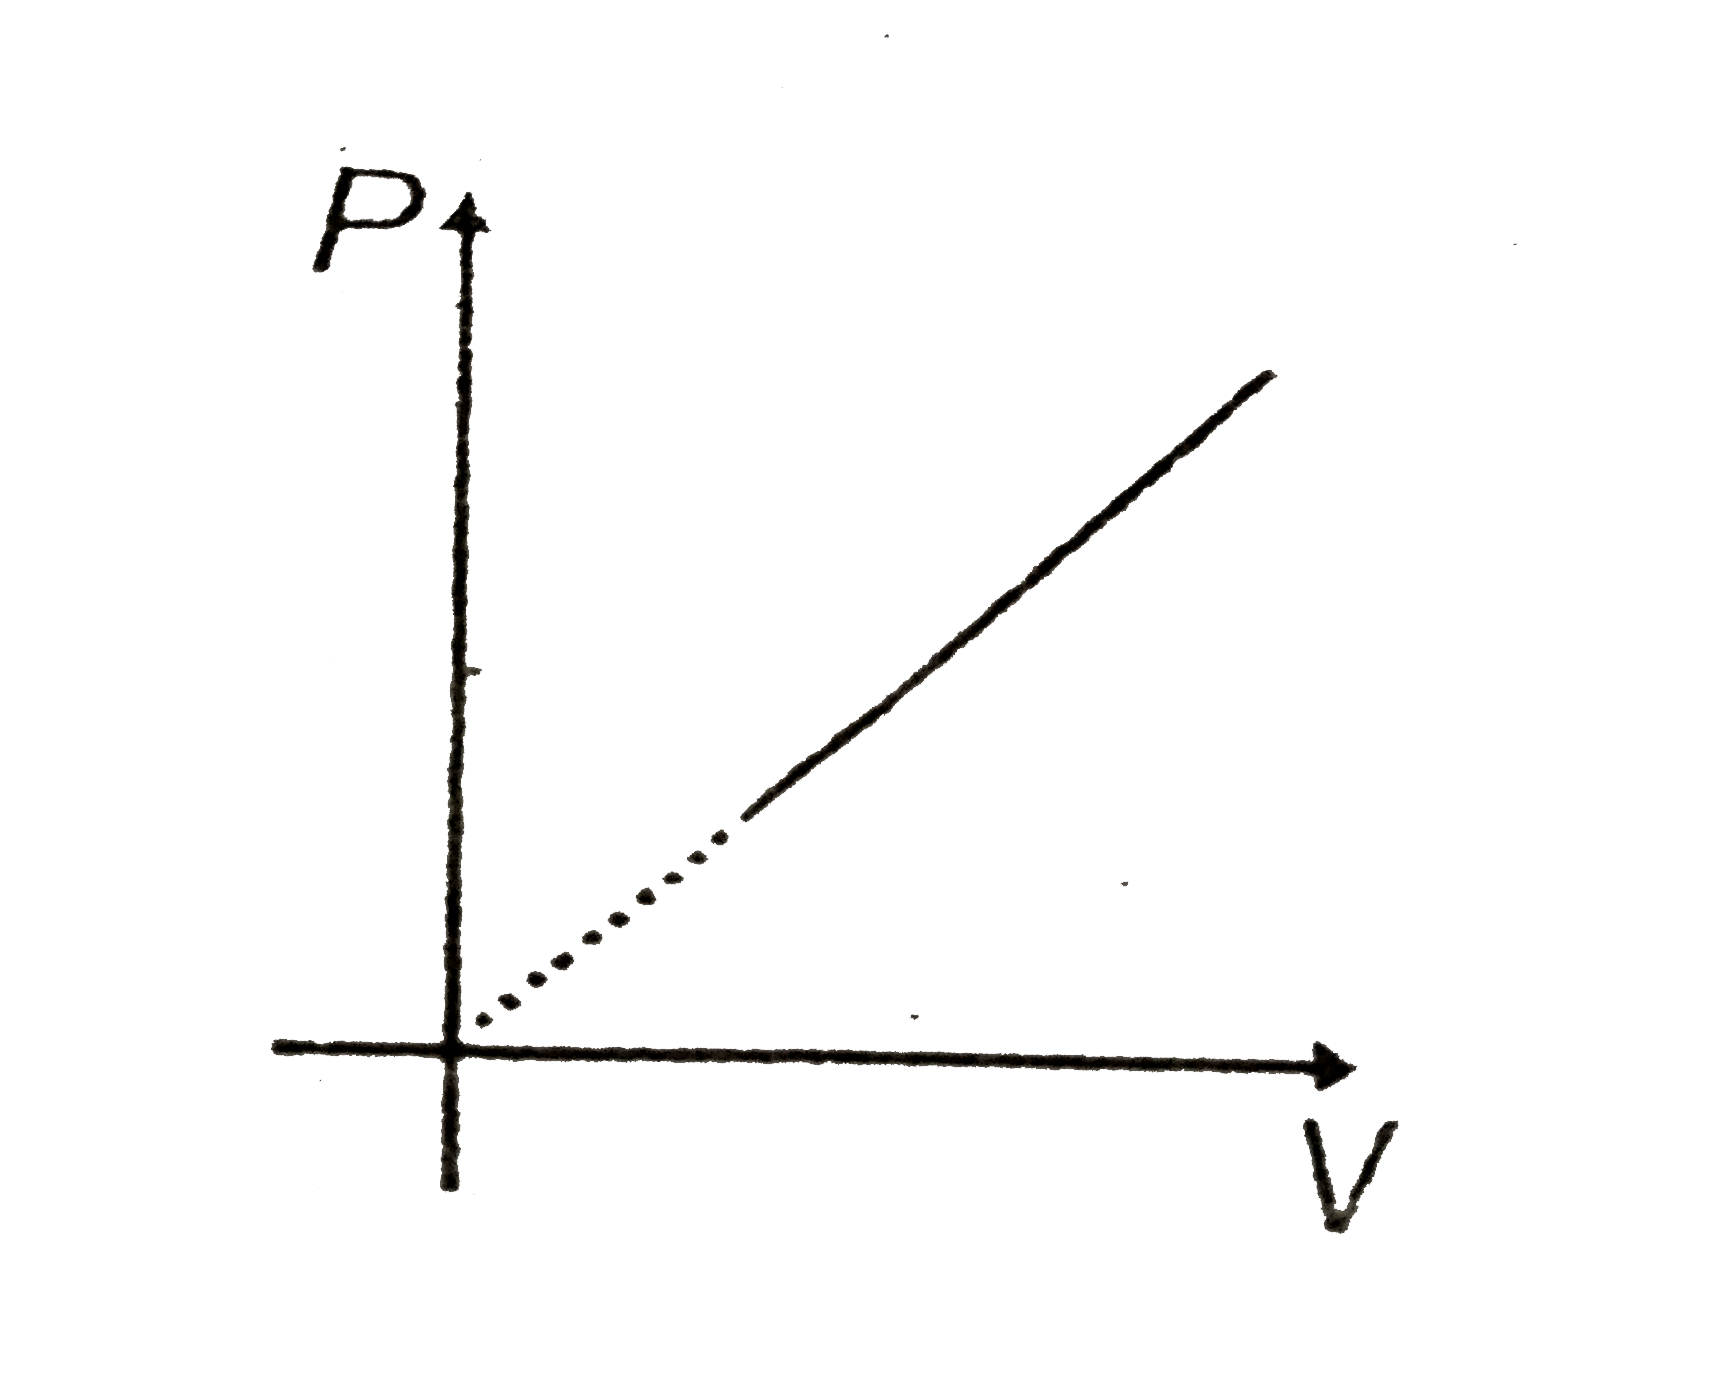
The variation of pressure versus volume is shown in the figure. The gas is diatomic and the molar specific heat capacity for the process is found to xR. Find the value of x.
 .
.
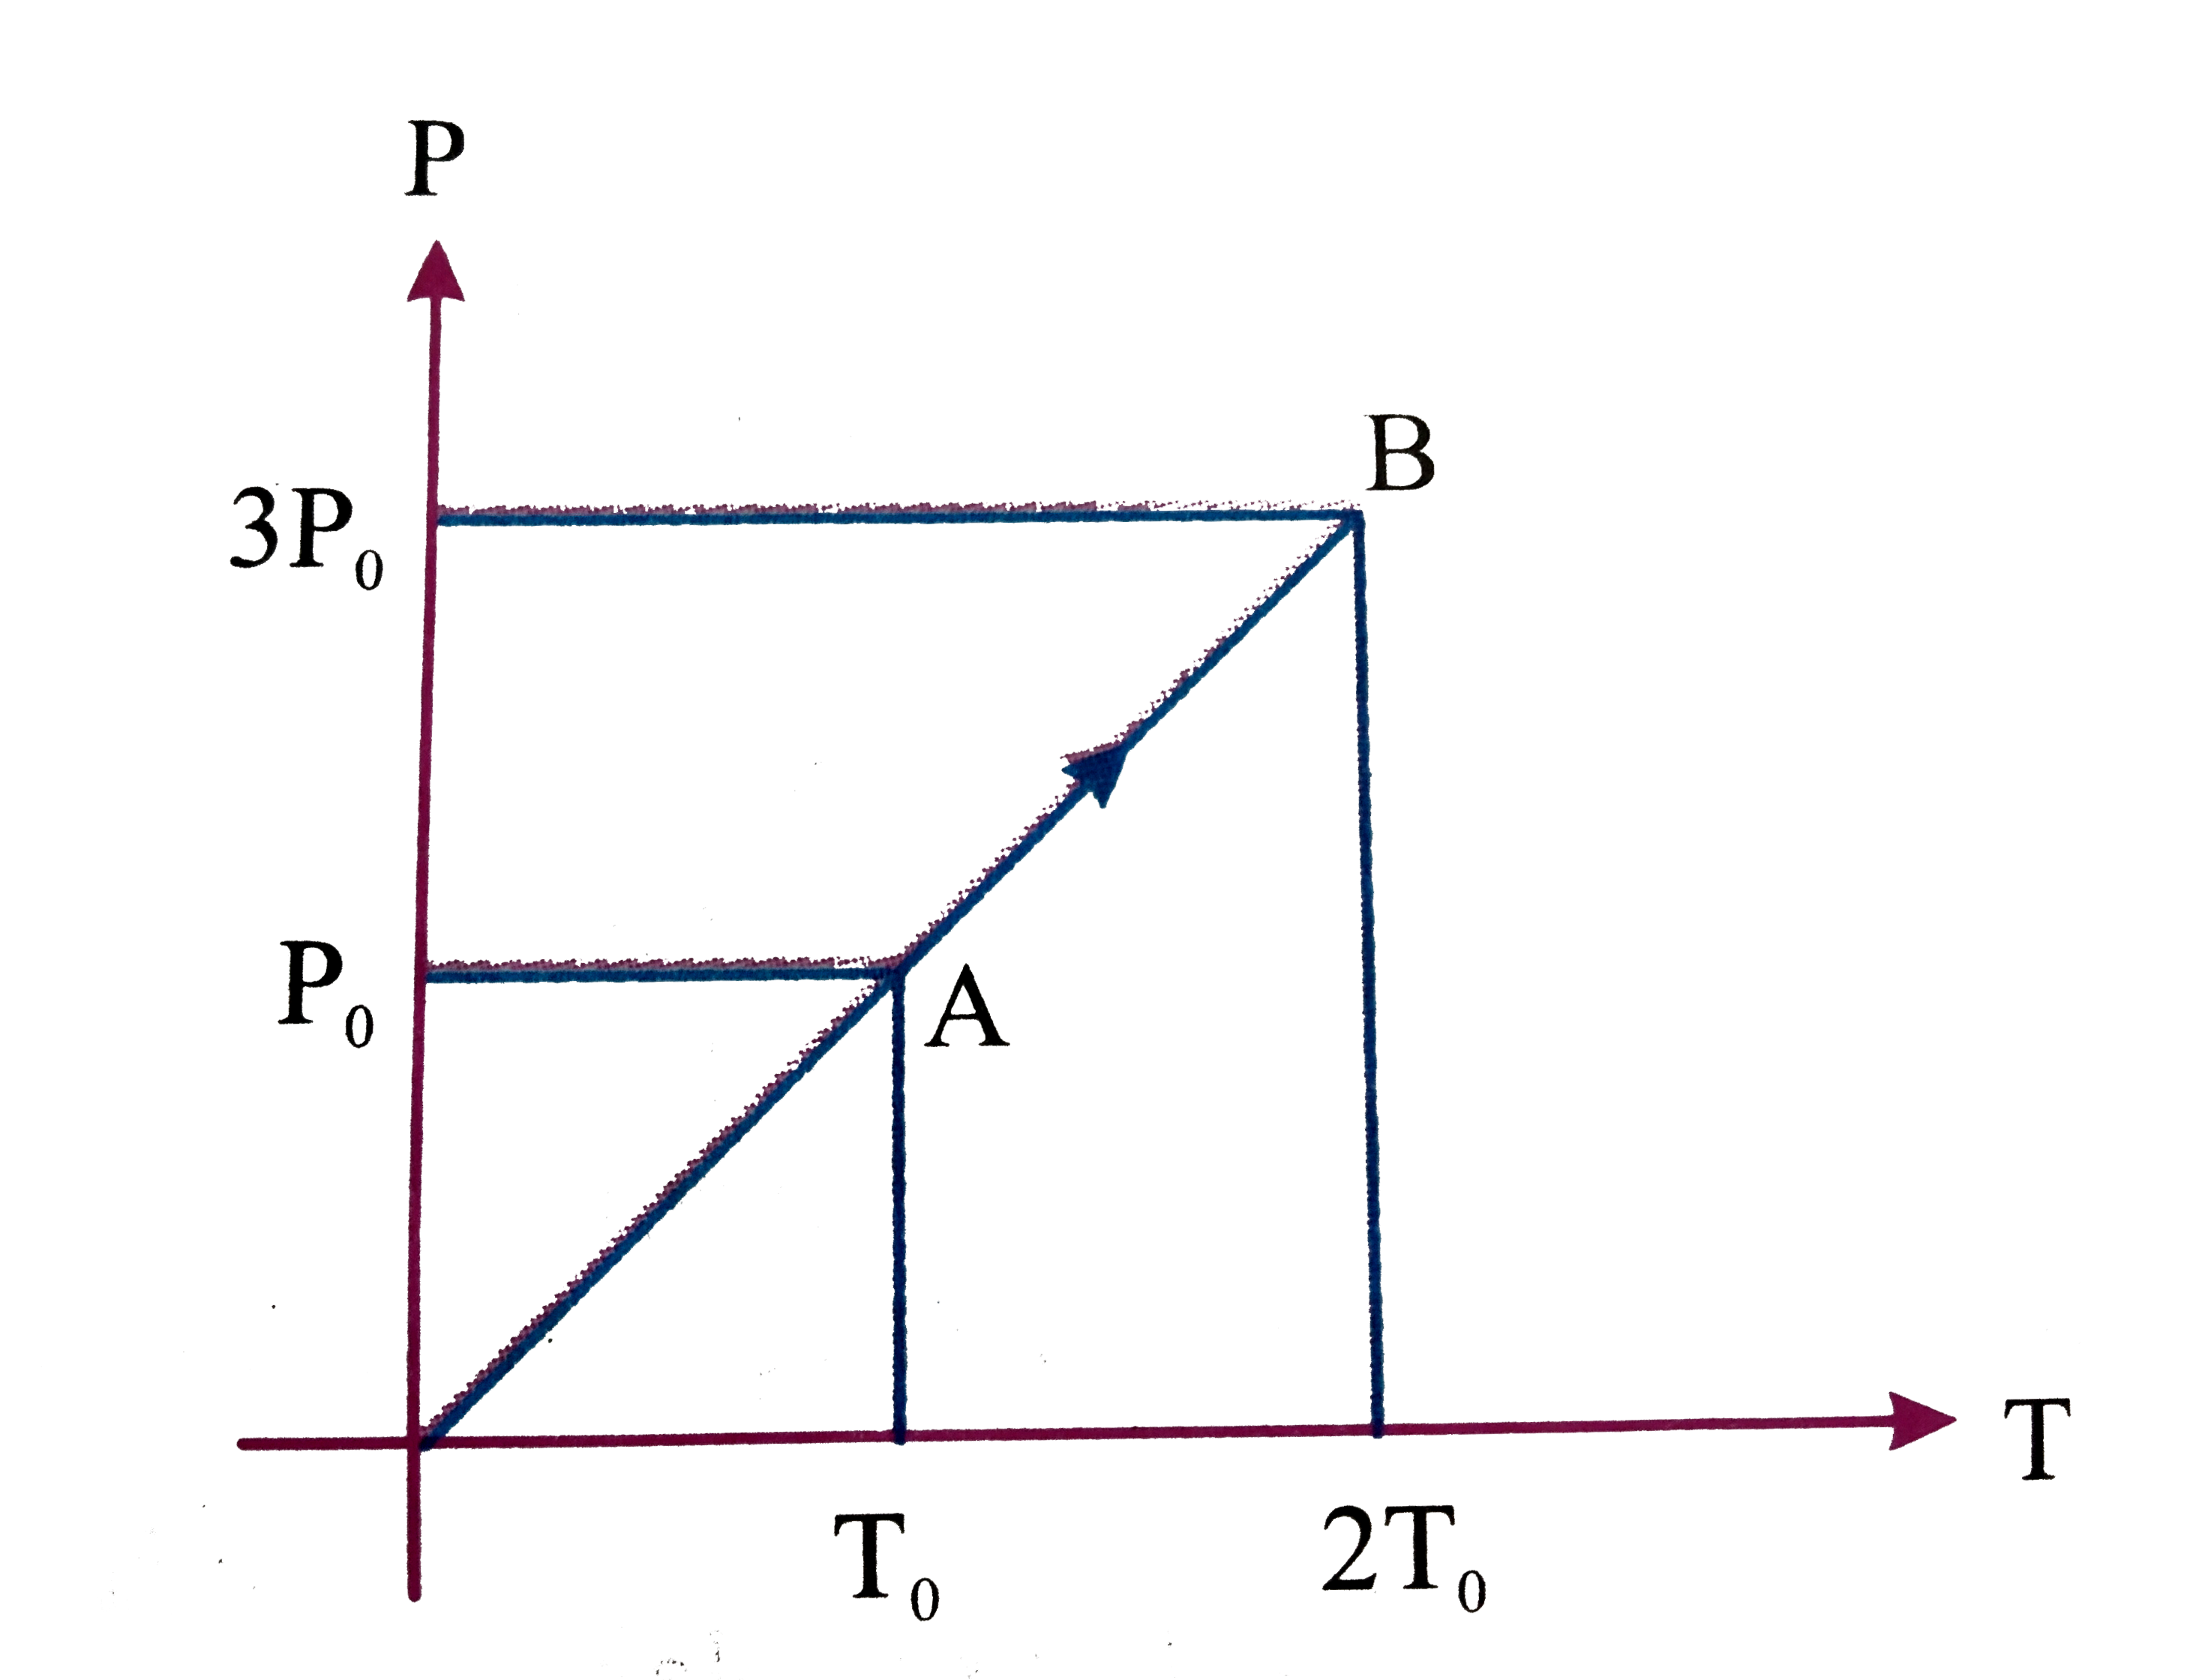
View SolutionPressure versus temperature graph of an ideal gas is shown in figure. Density of the gas at point A is ρ0. Density at B will be
View Solution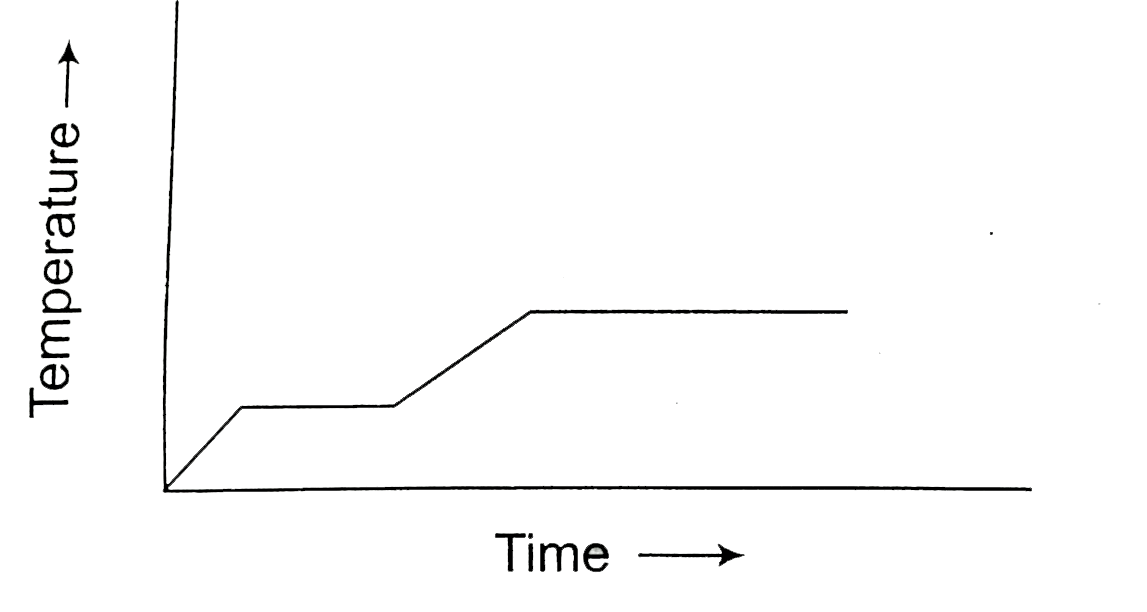
Heat is supplied to a certain homogeneous sample of matter, at a uniform rate. Its temperature is plotted against time, as shown Which of the following conclusions can be drawn?
(i) Its specific heat capacity is greater in the solid state than the liquid state.
(ii) Its specific heat capacity is greater in the liquid state than in the solid state.
(iii) Its latent heat of vaporization is greater than its latent heat of fusion.
(iv) Its latent heat of vaporization is smaller than its latent heat of fusion
View SolutionA substance is in the solid from at 0∘C. The amount of heat added to this substance and its temperature is plotted in the graph . The specific heat capacity of the solid substance is 0.5cal/g∘C.
_E01_235_Q01.png)
Specific heat capacity in the liquid state is -
View SolutionA substance is in the solid from at 0∘C. The amount of heat added to this substance and its temperature is plotted in the graph . The specific heat capacity of the solid substance is 0.5cal/g∘C.
_E01_234_Q01.png)
Latest heat capacity in melting process is -
View Solutiongraph of an ideal gas is as shown in figure.

Heat is supplied to the gas in process (s).
View SolutionThe temperature of a hot liquid in a container of negligible heat capacity falls at the rate of 3K/min due to heat emission to the surroundings, just before it begins to solidify. The temperature then remains constant for 30min, by the time the liquid has all solidfied. Find the ratio of specific heat capacity of liquid to specific latent heat of fusion.
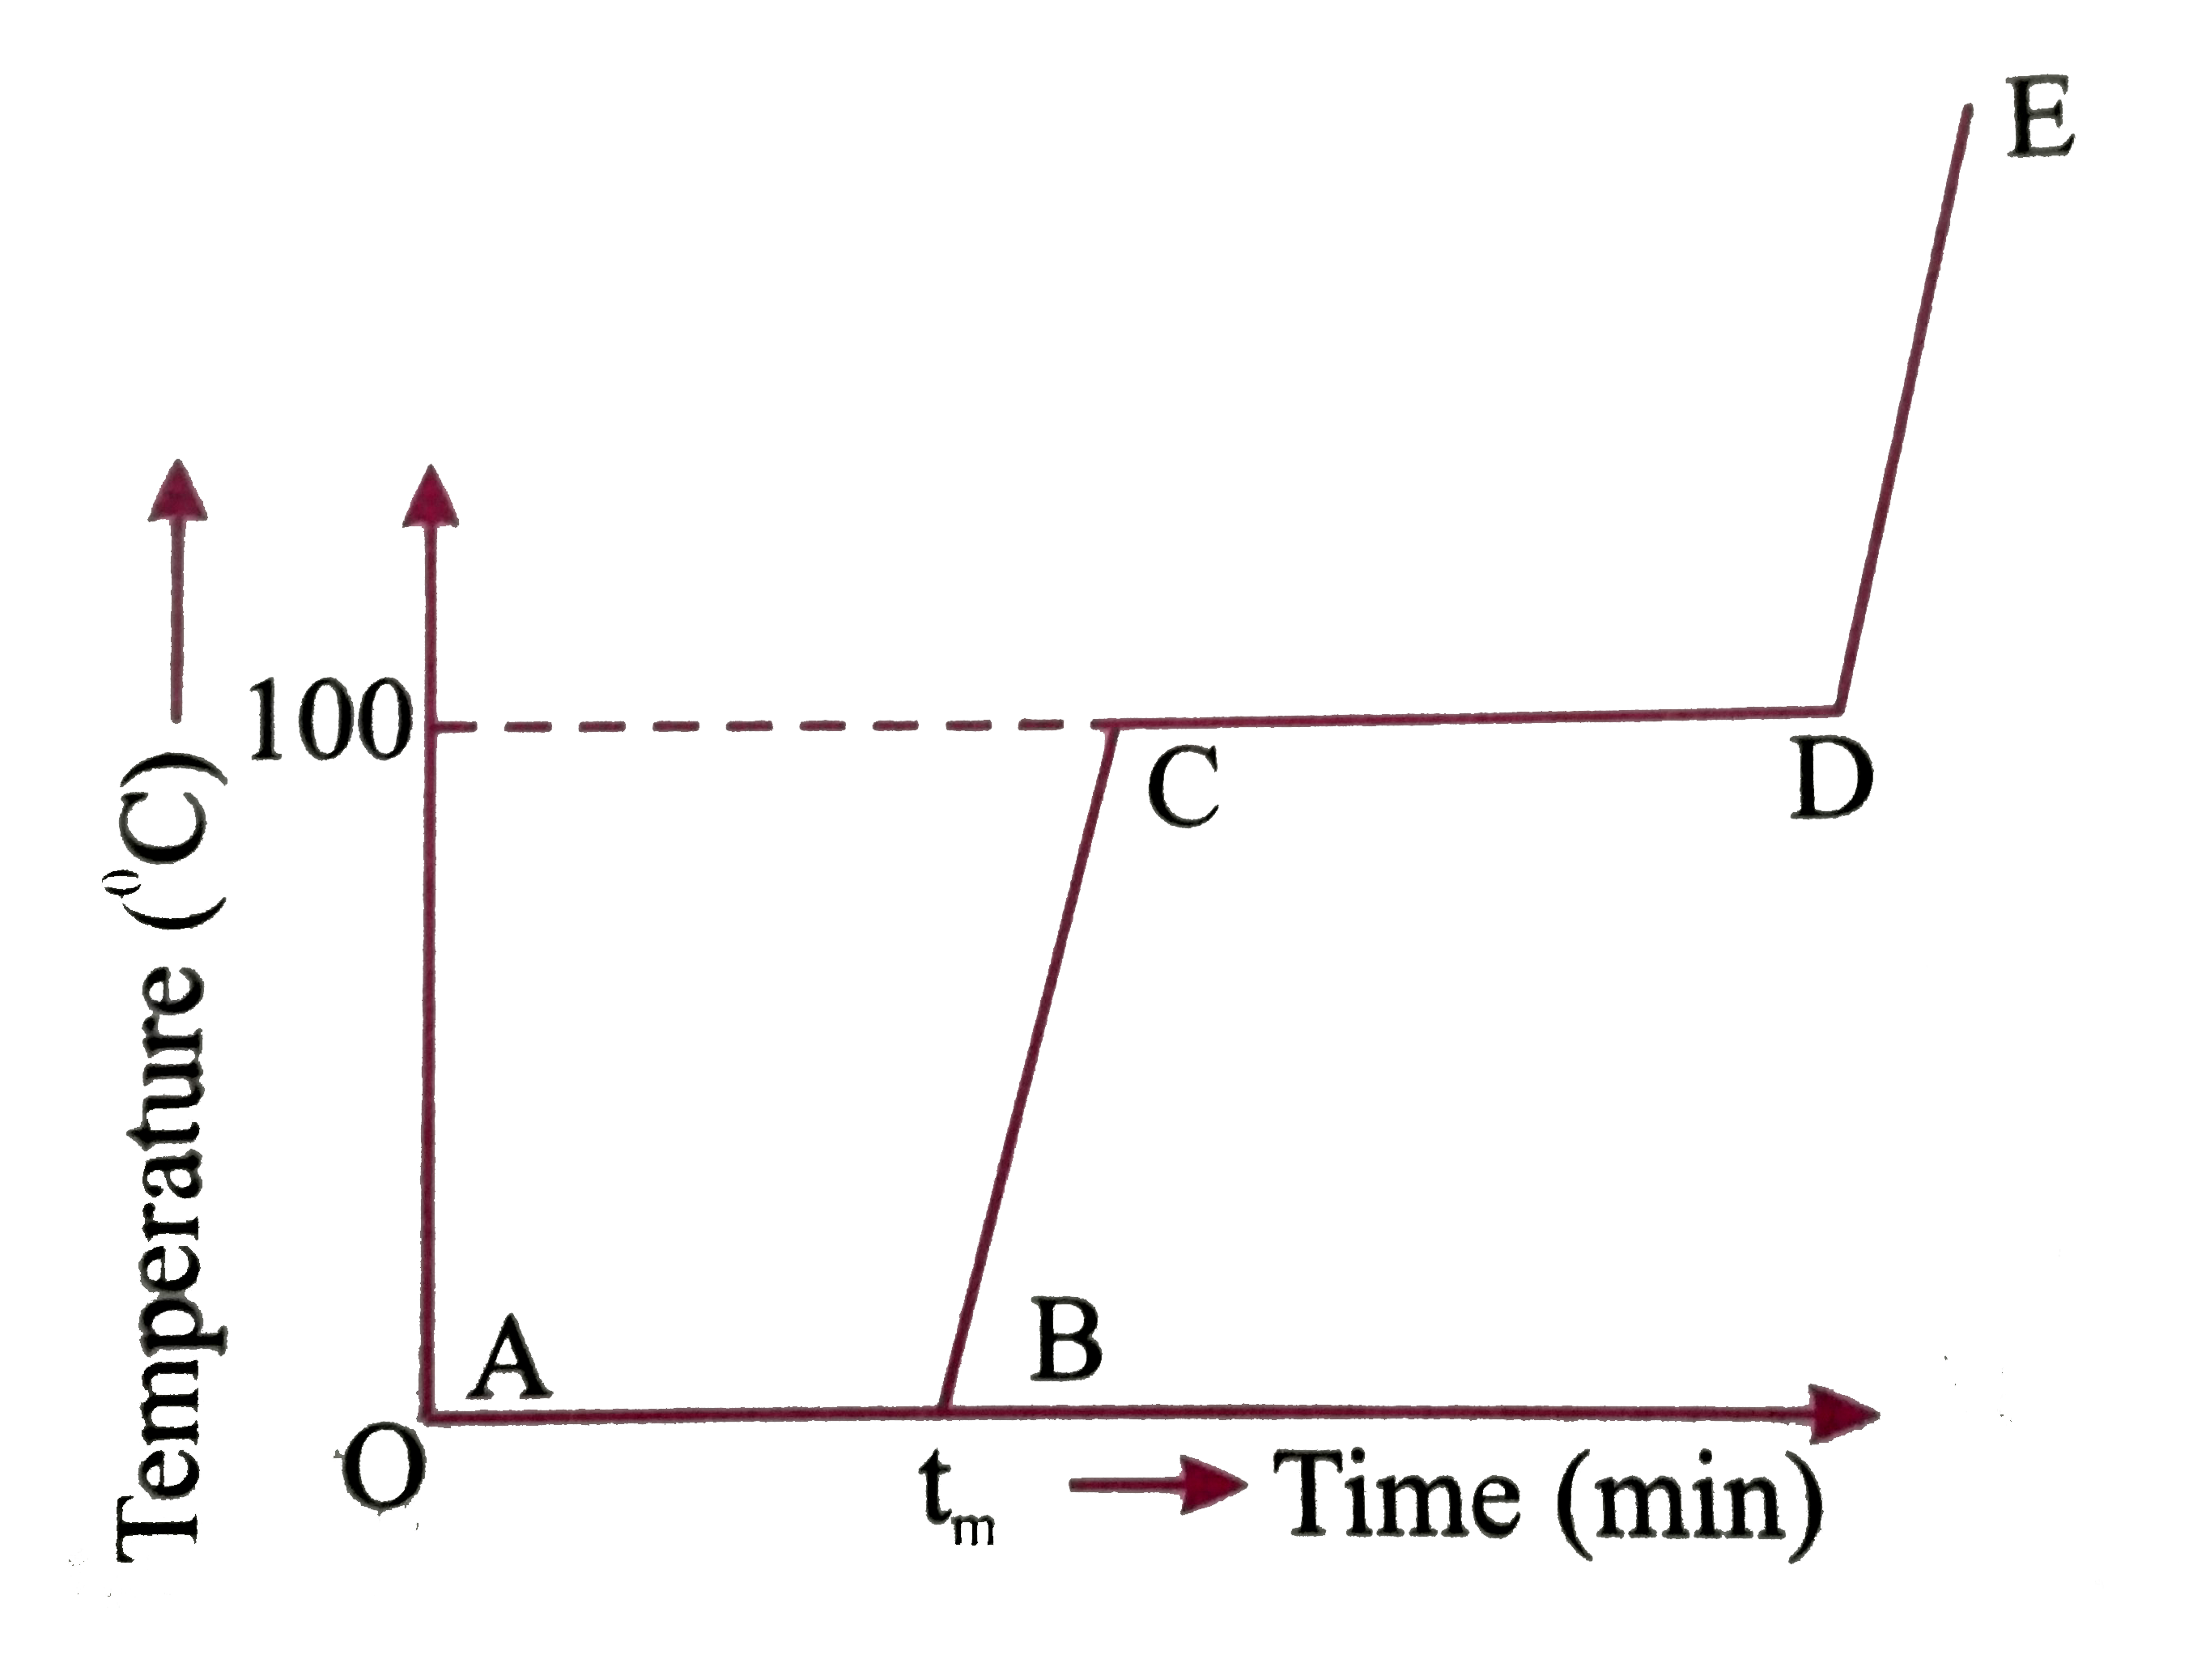
View SolutionRefer to the plot of temperature versus time (figure) showing the changes in the state if ice on heating (not to scale). Which of the following is correct ?
 .
.
View SolutionIf molar heat capacity of the given process (as shown in figure) is C, then

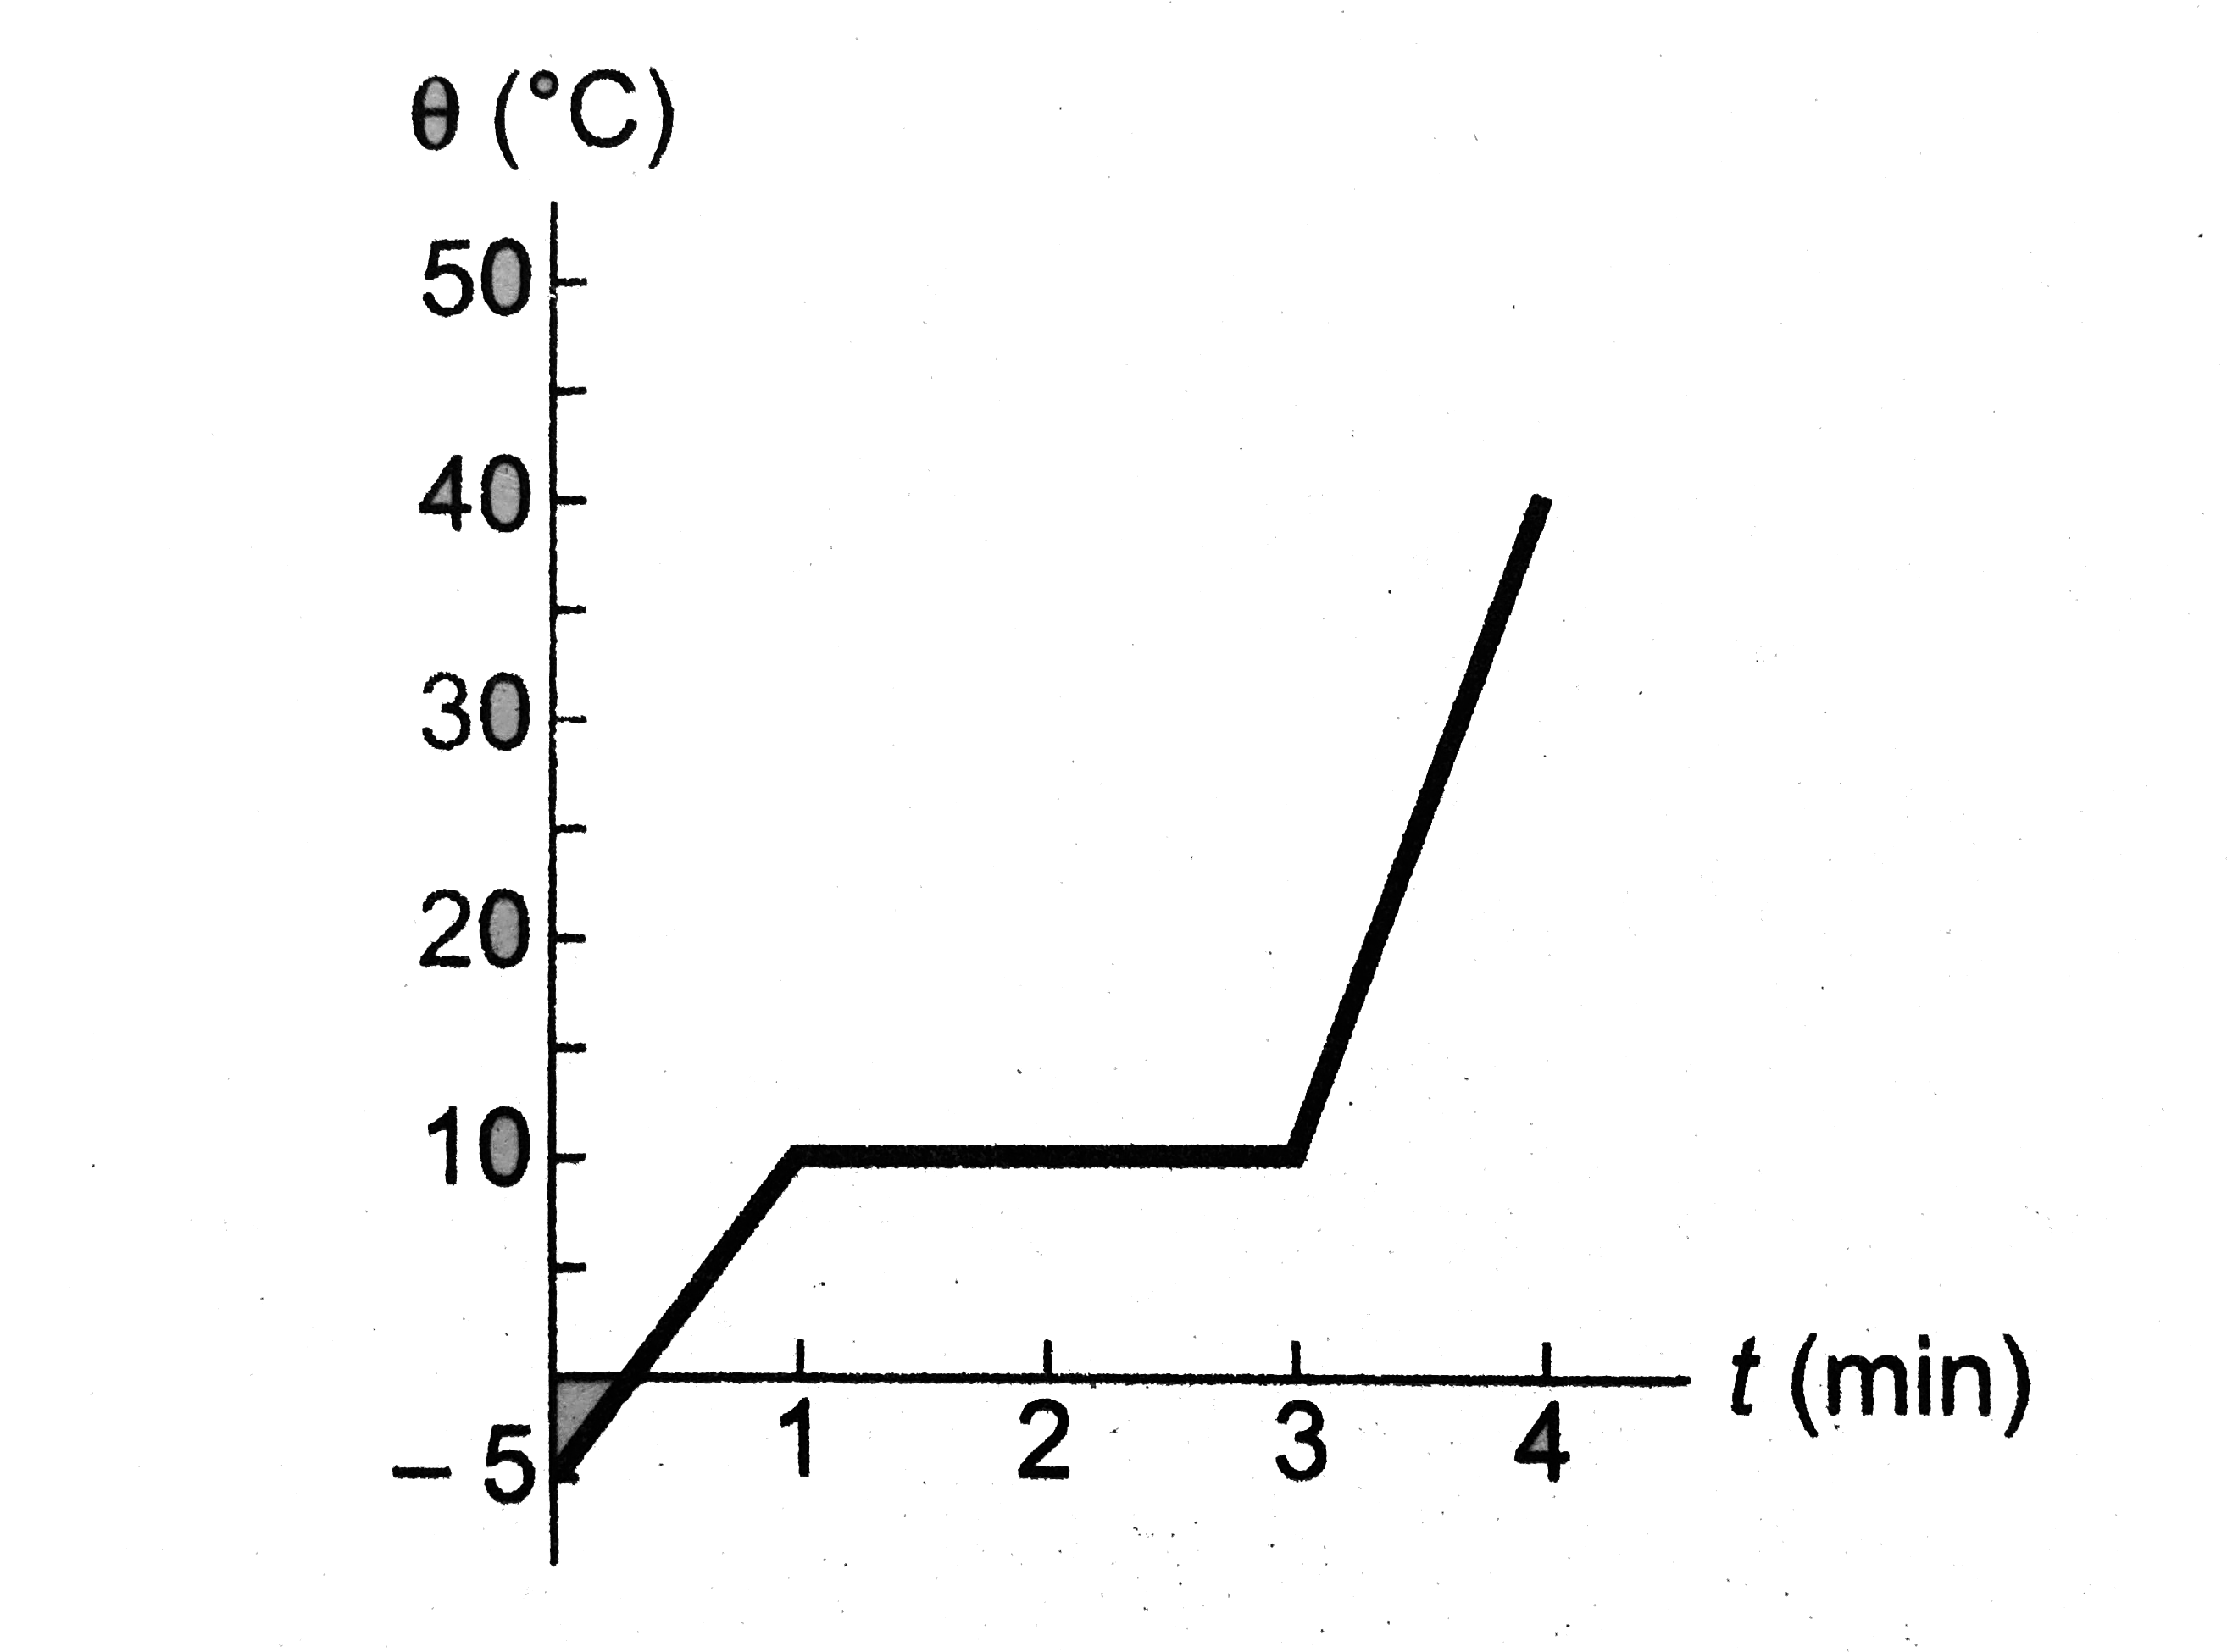
View SolutionAs a physicist, you put heat into a 500 g solid sample at the rate of 10.0kJ/min, while recording its temperature as a function of time. You plot your data and obtain the graph shown in figure.
 .
.
(a) What is the latent heat of fusion for this solid?
(b) What is the specific heat of solid state of the material?
View Solution
