In the figure Vab versus time graph along an inductor is shown. Match the following
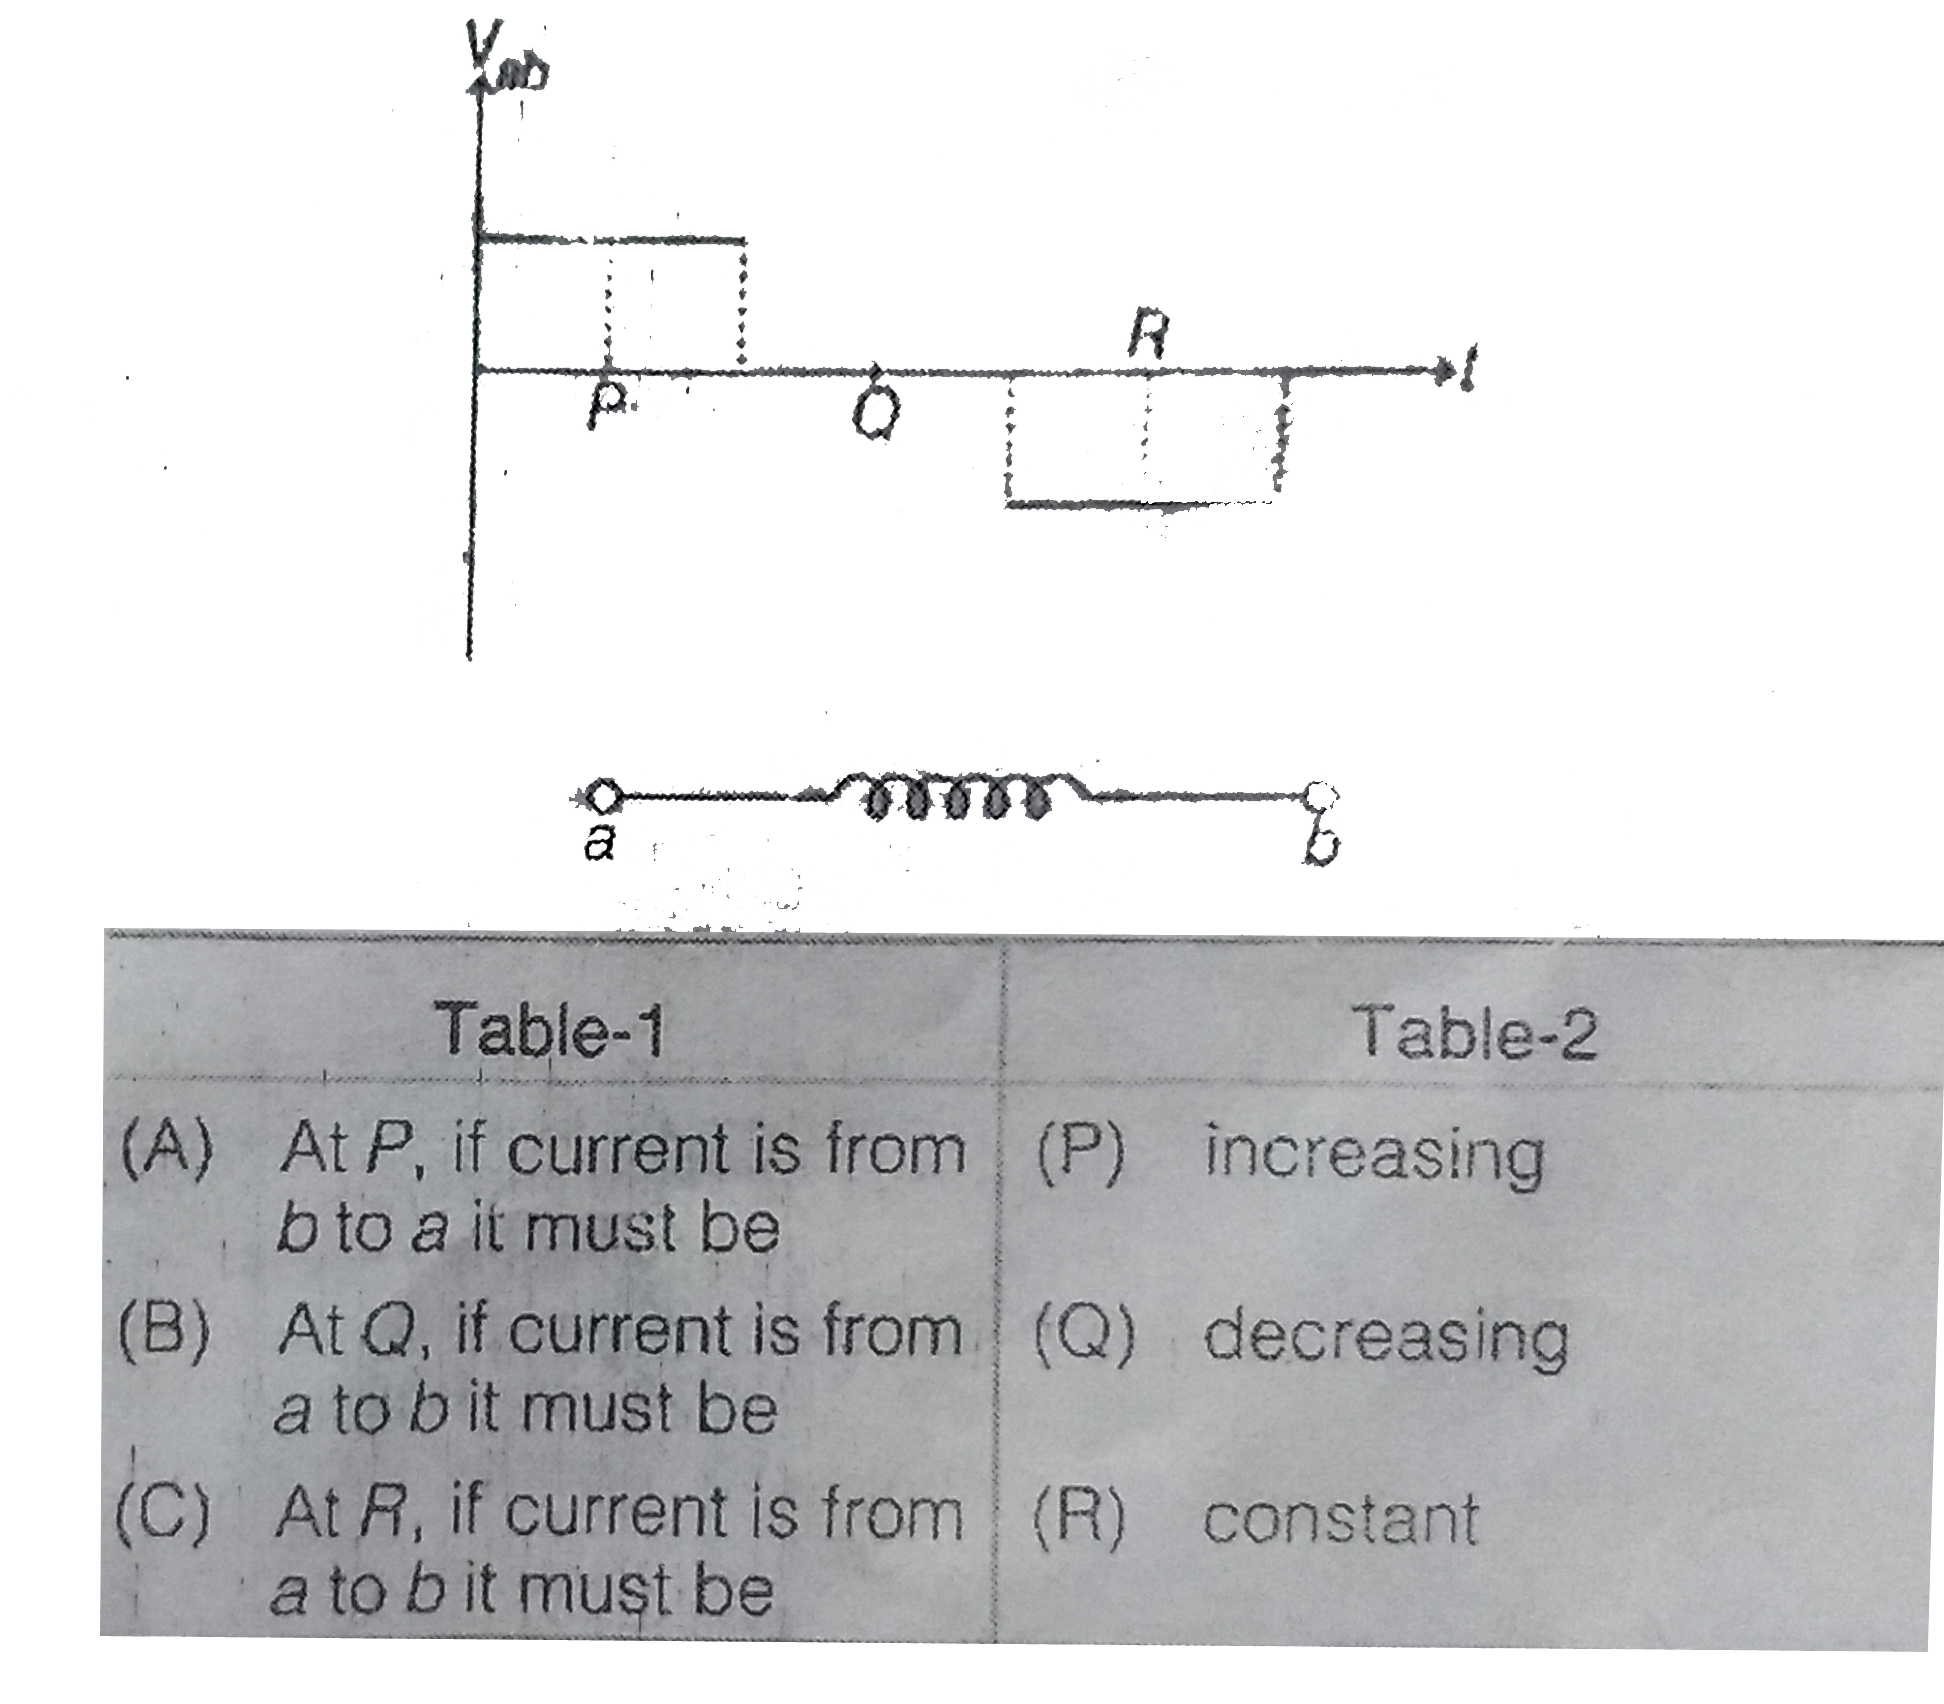
The correct Answer is:(A) Q, (B) R, (C) Q
Step by step video & image solution for In the figure V_(ab) versus time graph along an inductor is shown. Match the following by Physics experts to help you in doubts & scoring excellent marks in Class 12 exams.
Updated on:21/07/2023Similar Questions
In the figure shown Vab at t=1 is

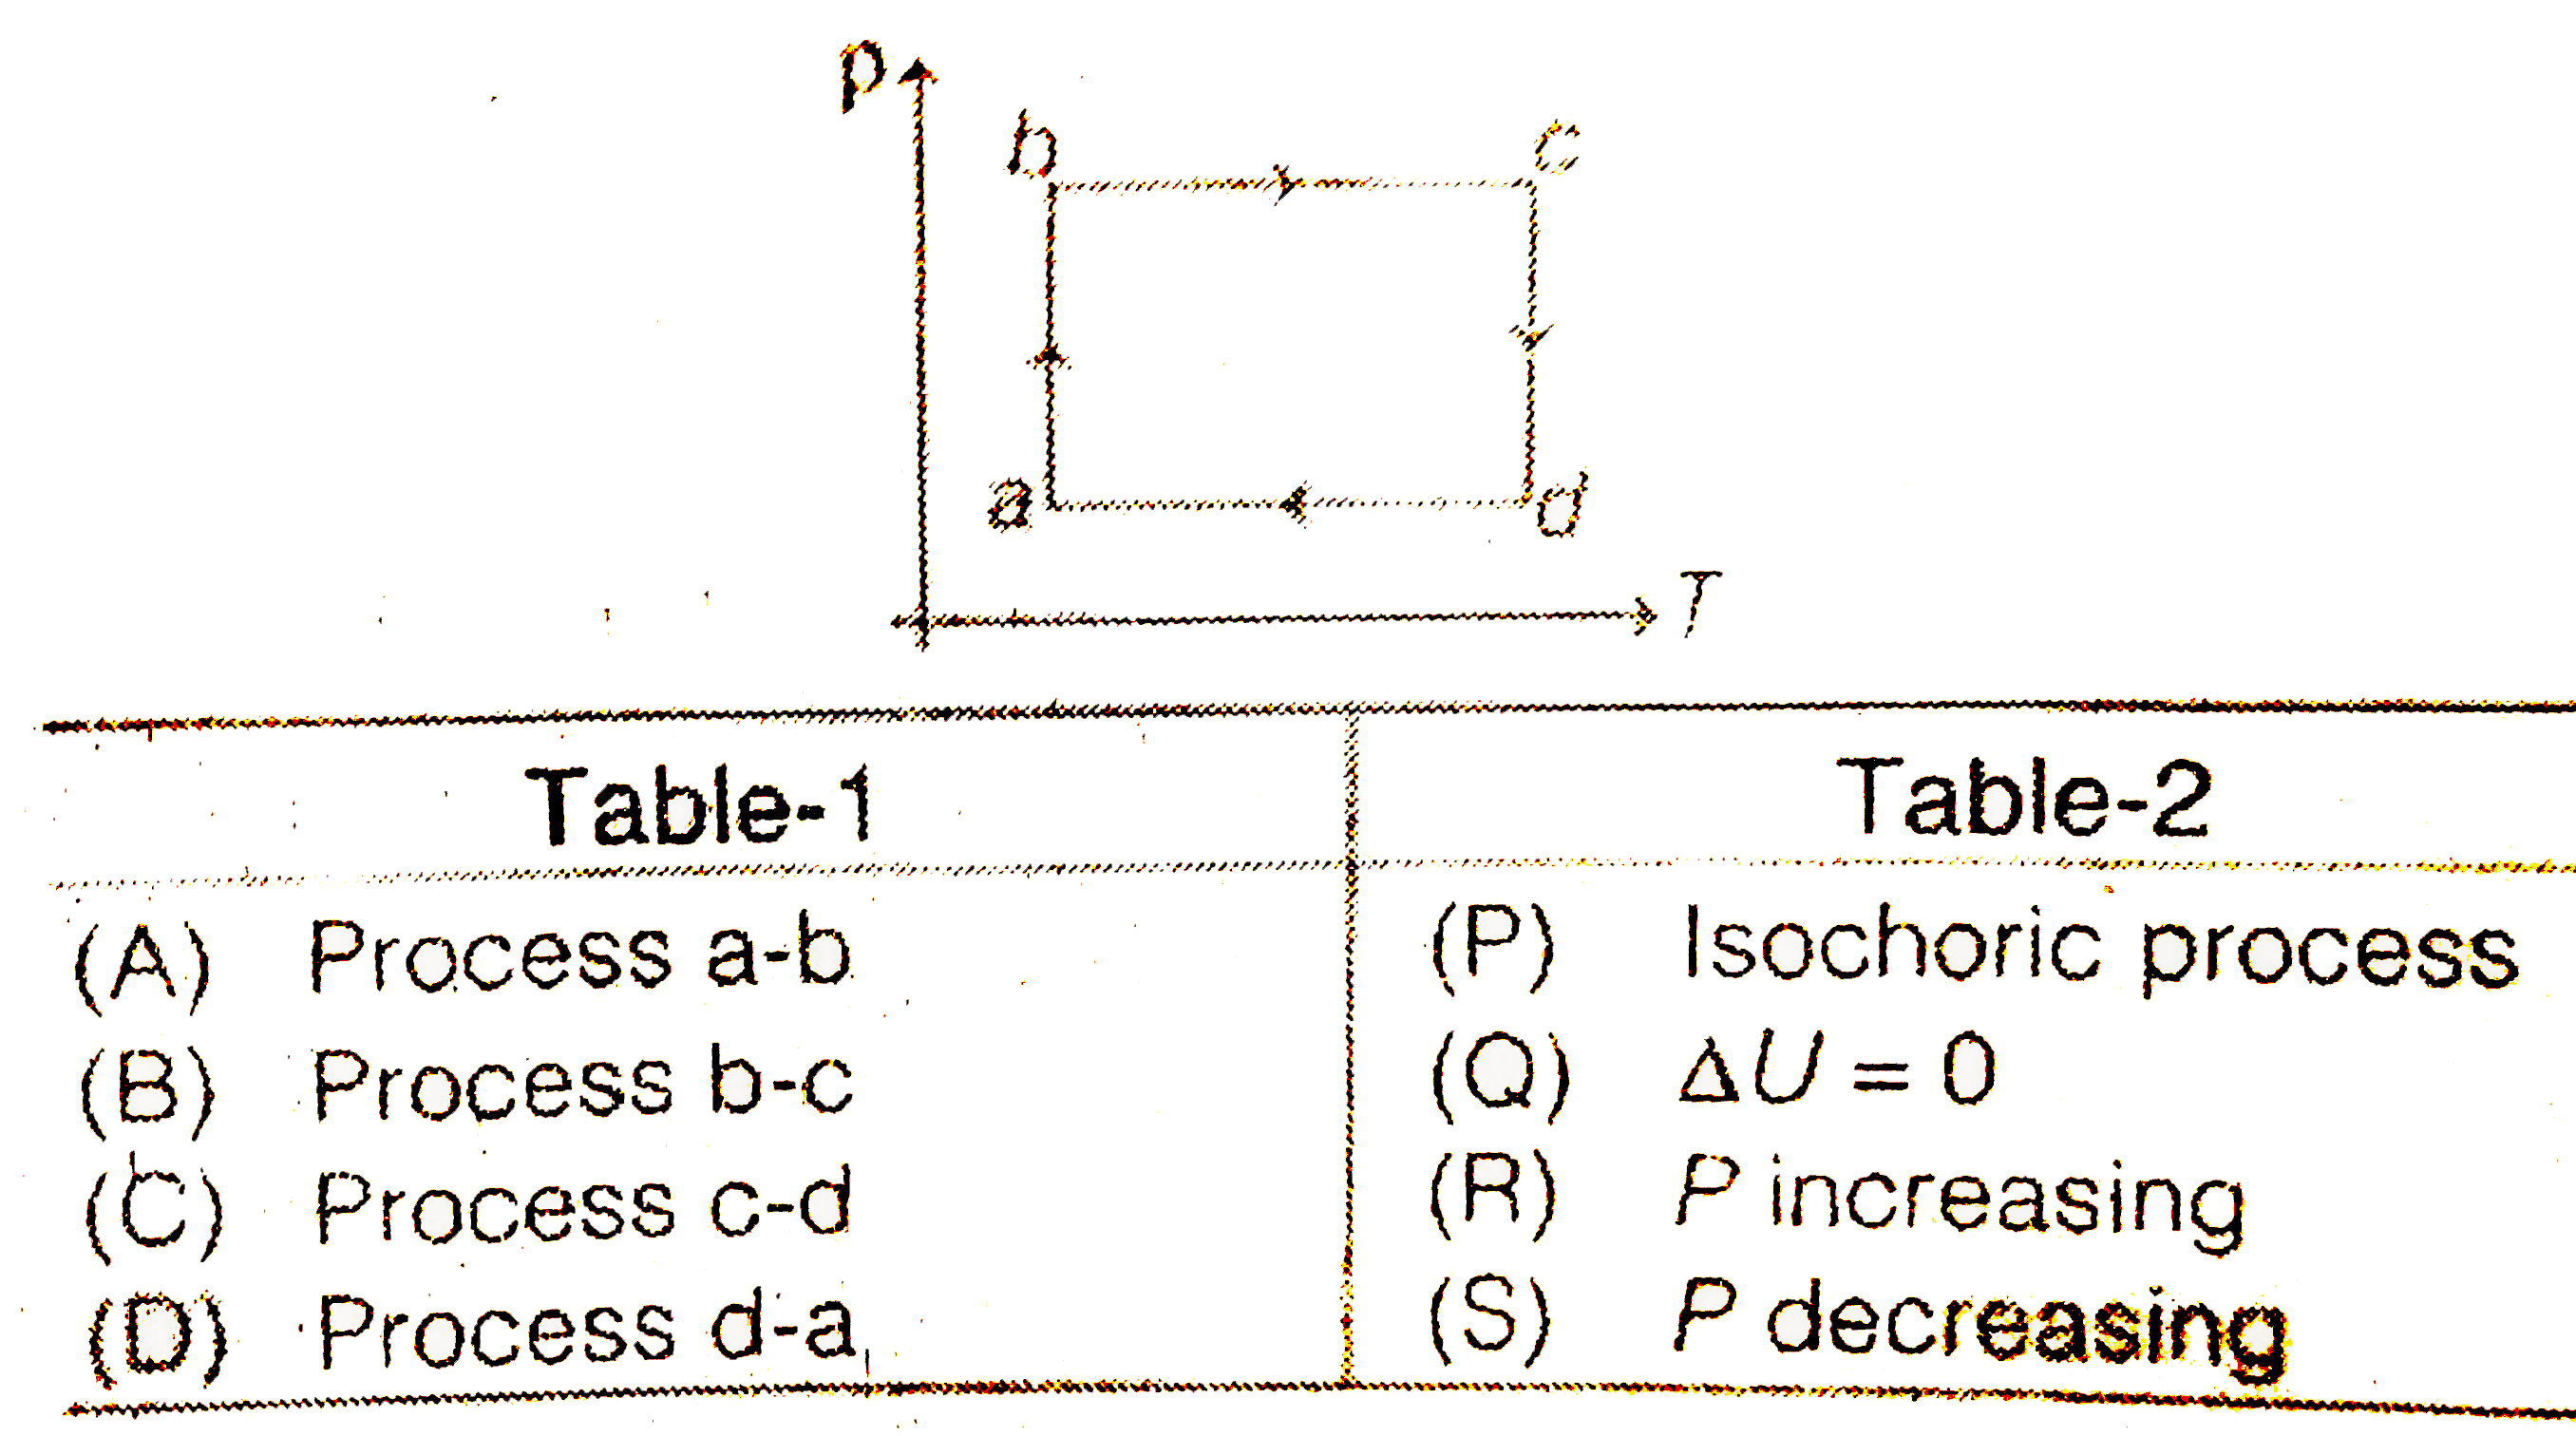
View SolutionIn the ρ-T graph shown in figure, match the following.
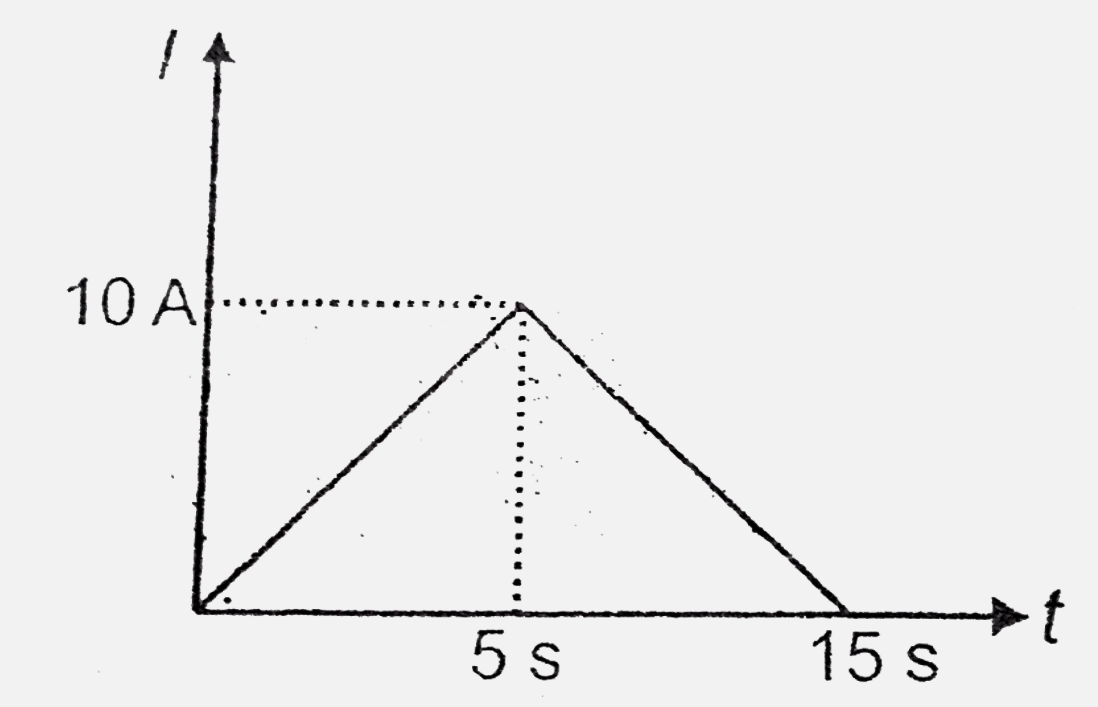
View SolutionCurrent l versus time t graph through a conductor is shown in the figure. Average current through the conductor in the interval 0 to 15 s is
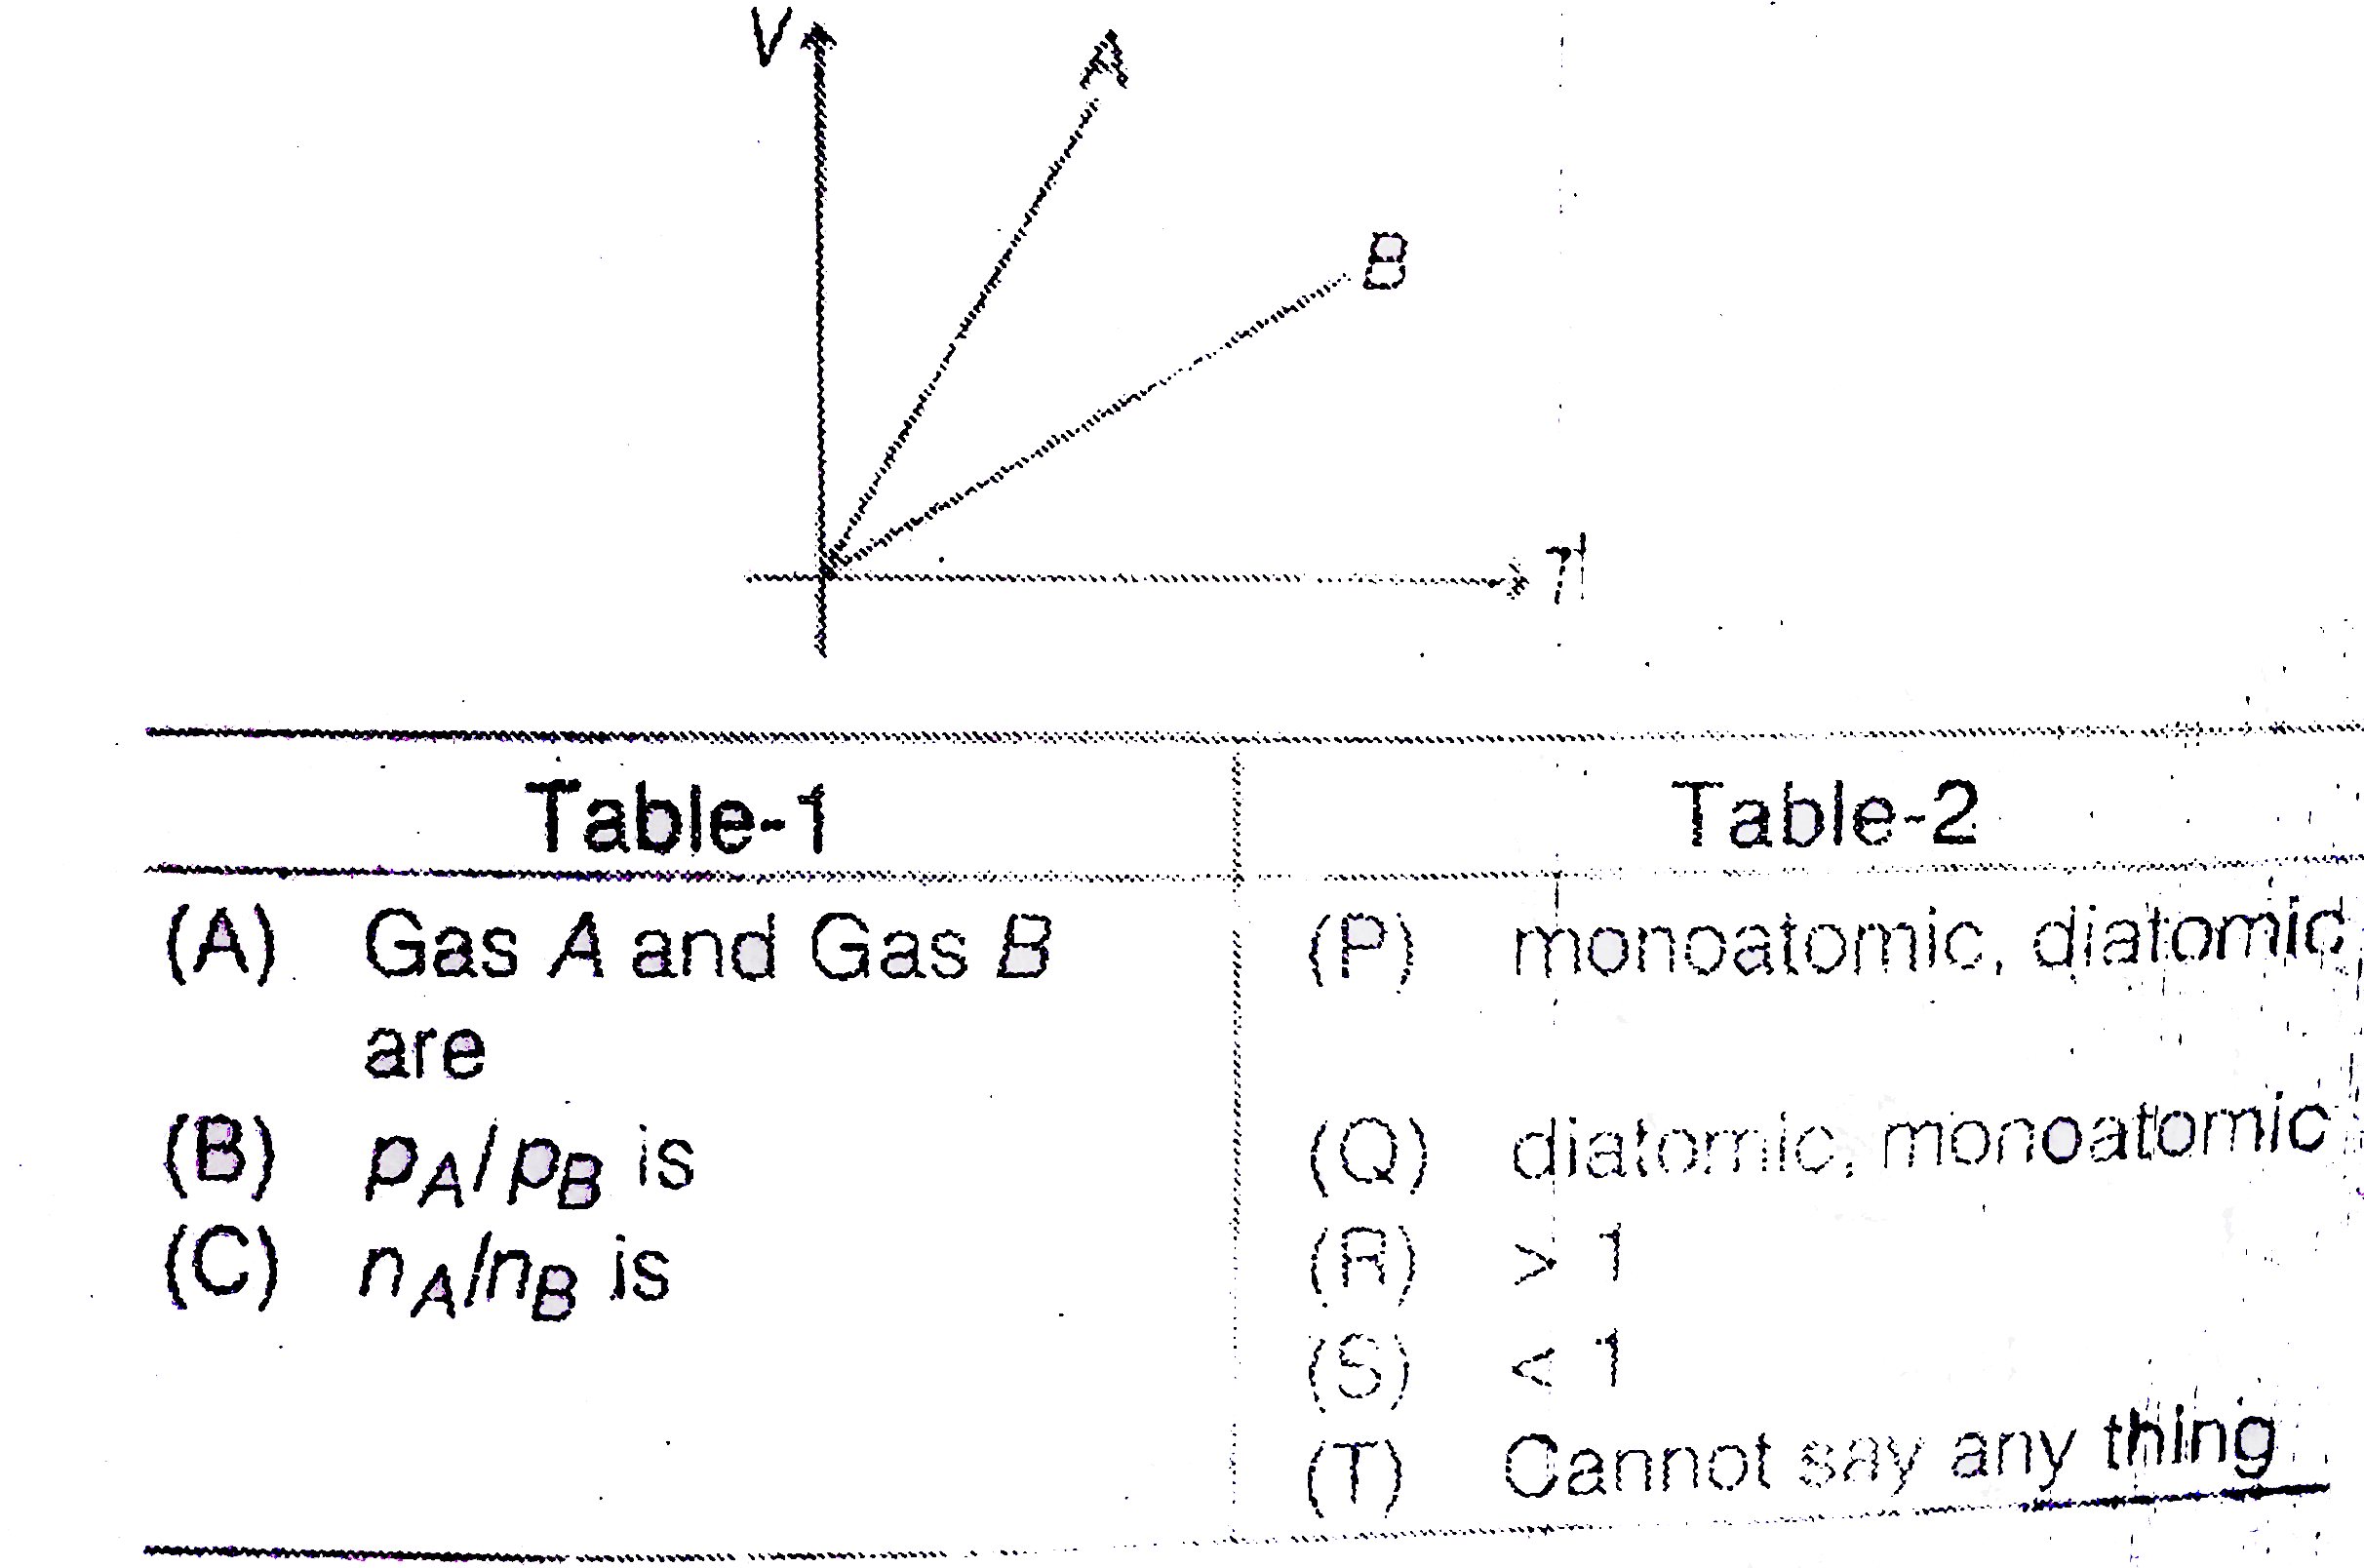
View SolutionIn the V-T graph shown in figure match the following.
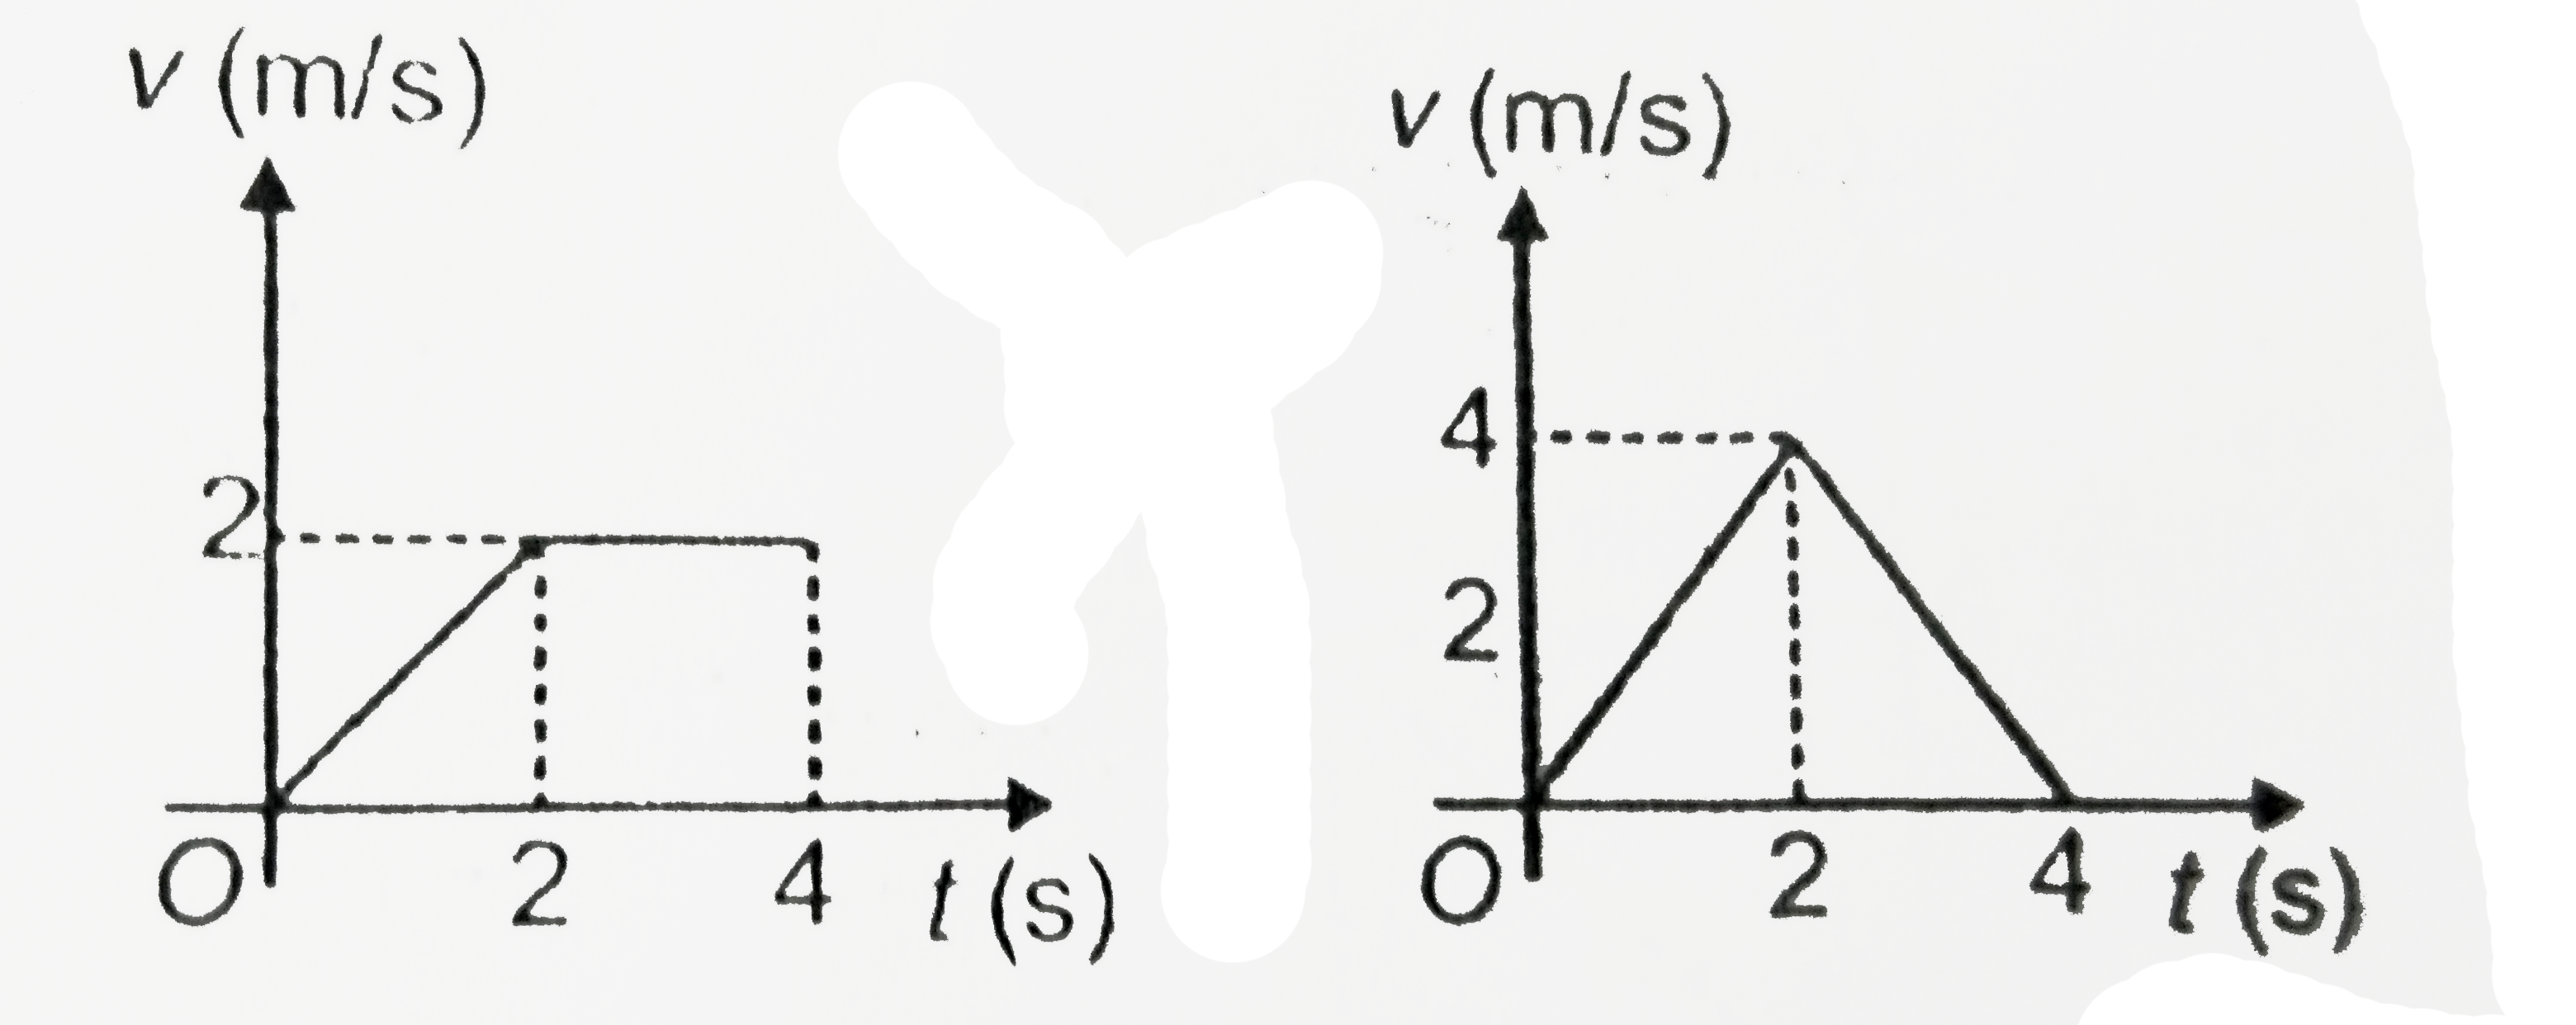
View SolutionThe velocity versus time graph of two particles moving along x-axis varies are shown in the following two plots. Then
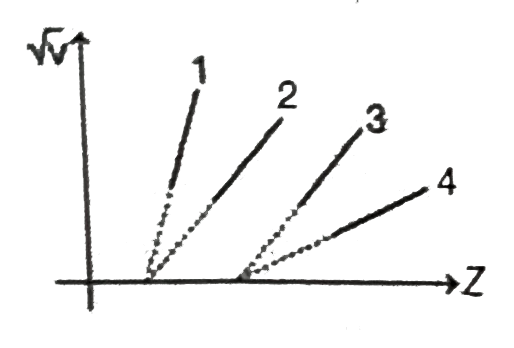
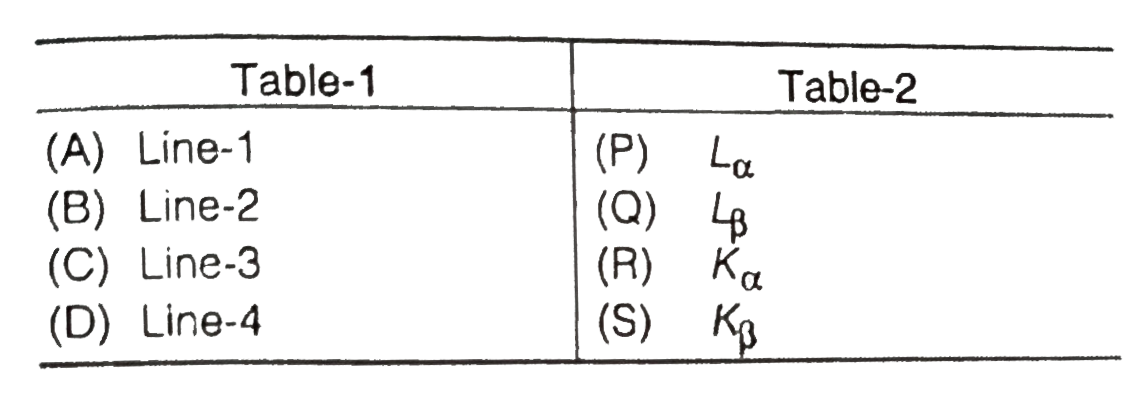
View Solution√v versus Z graph for dcharacteristic X-rays is as shown in figure. Match the following
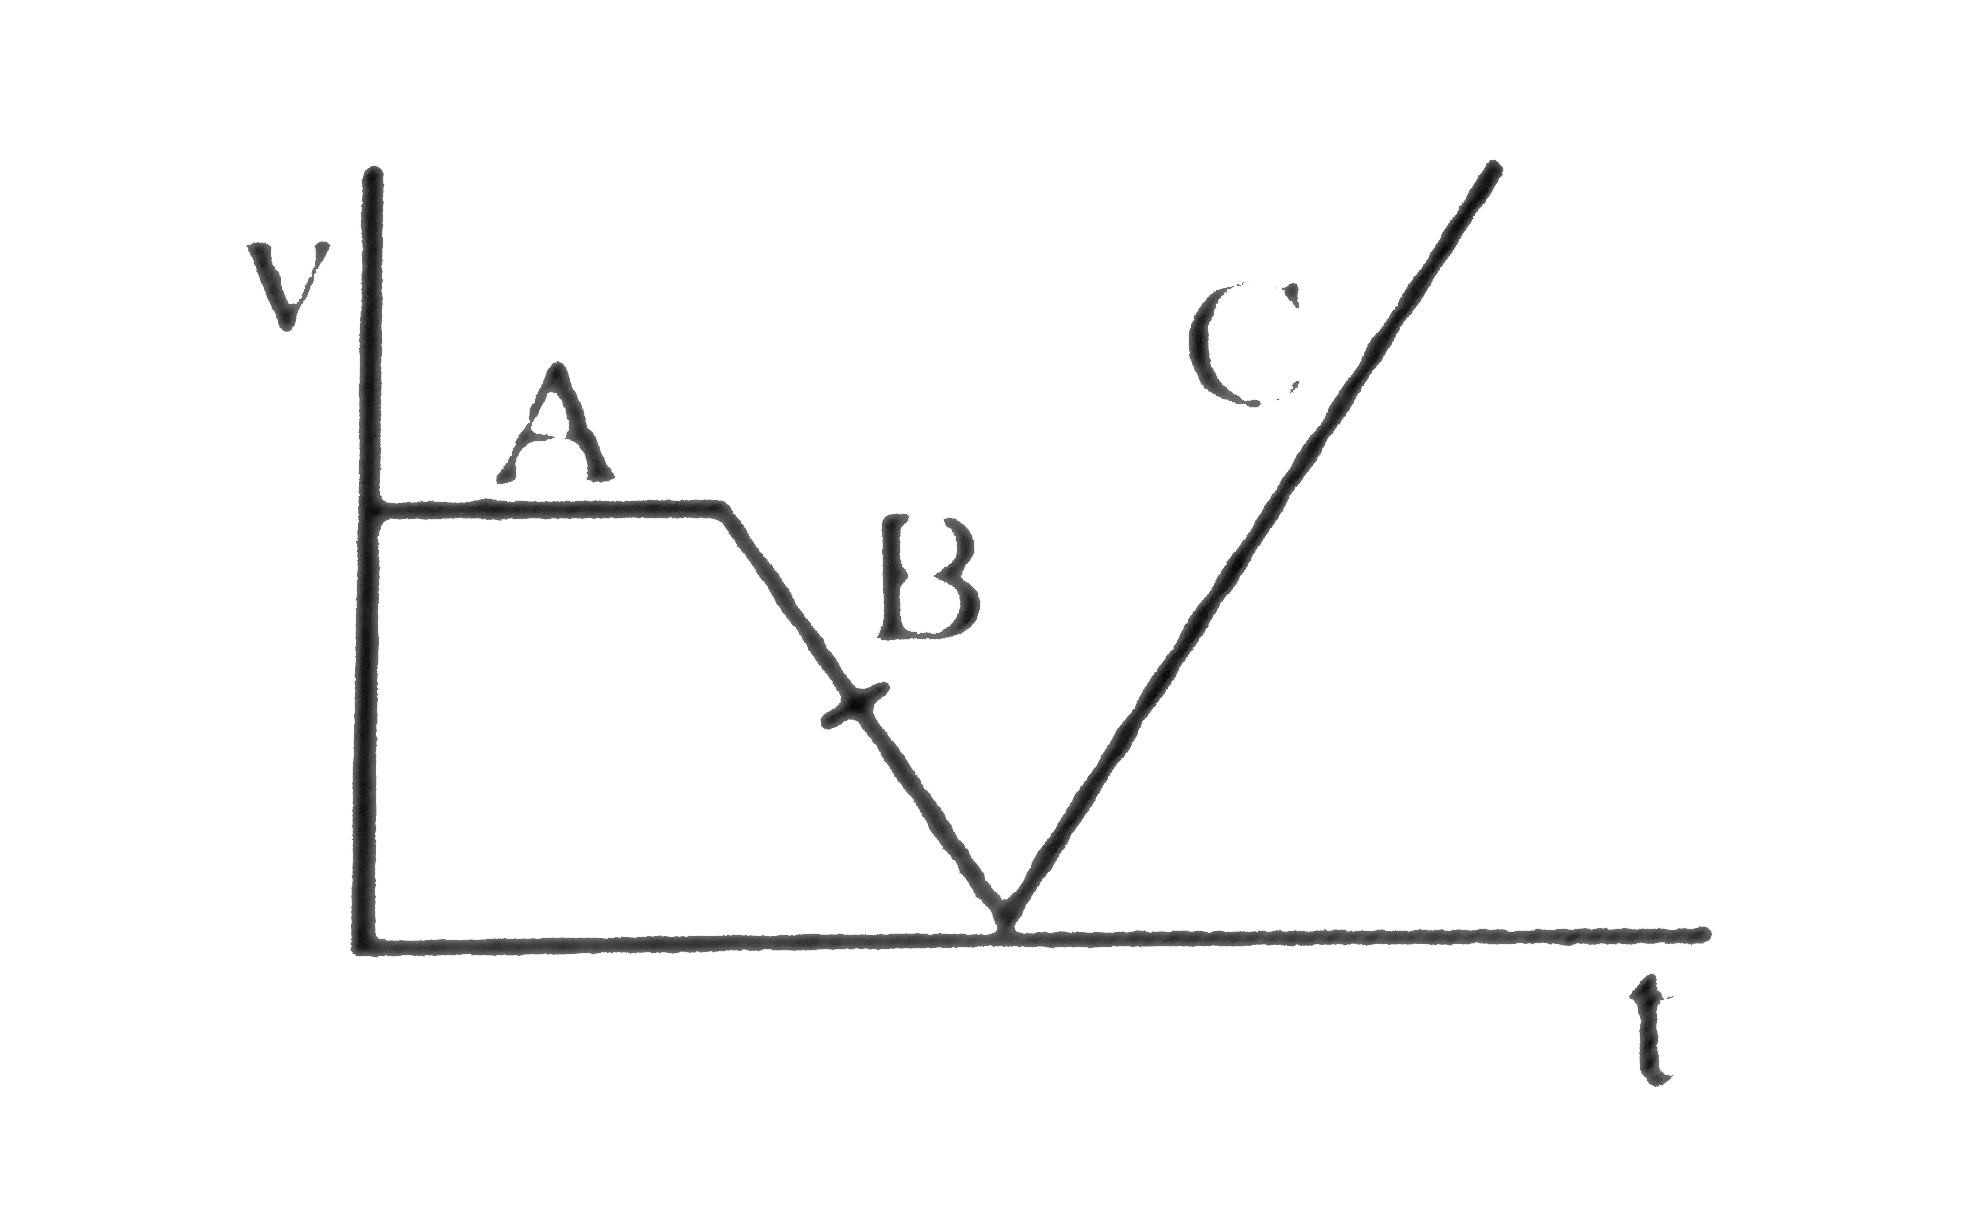
View SolutionVelocity versus time graph of a body is shown in figure. It explains that
View SolutionIn the V-T graph shown in the figure match the following columns.
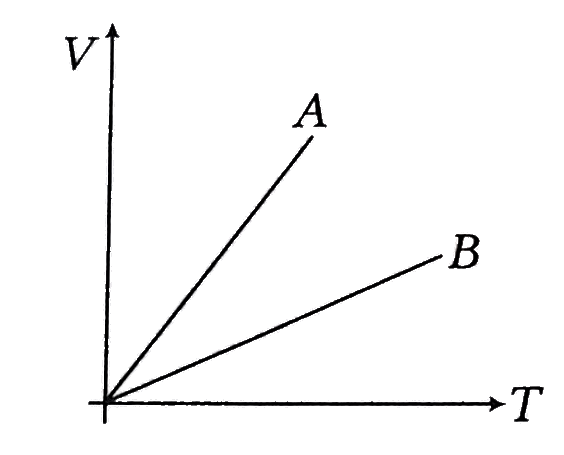
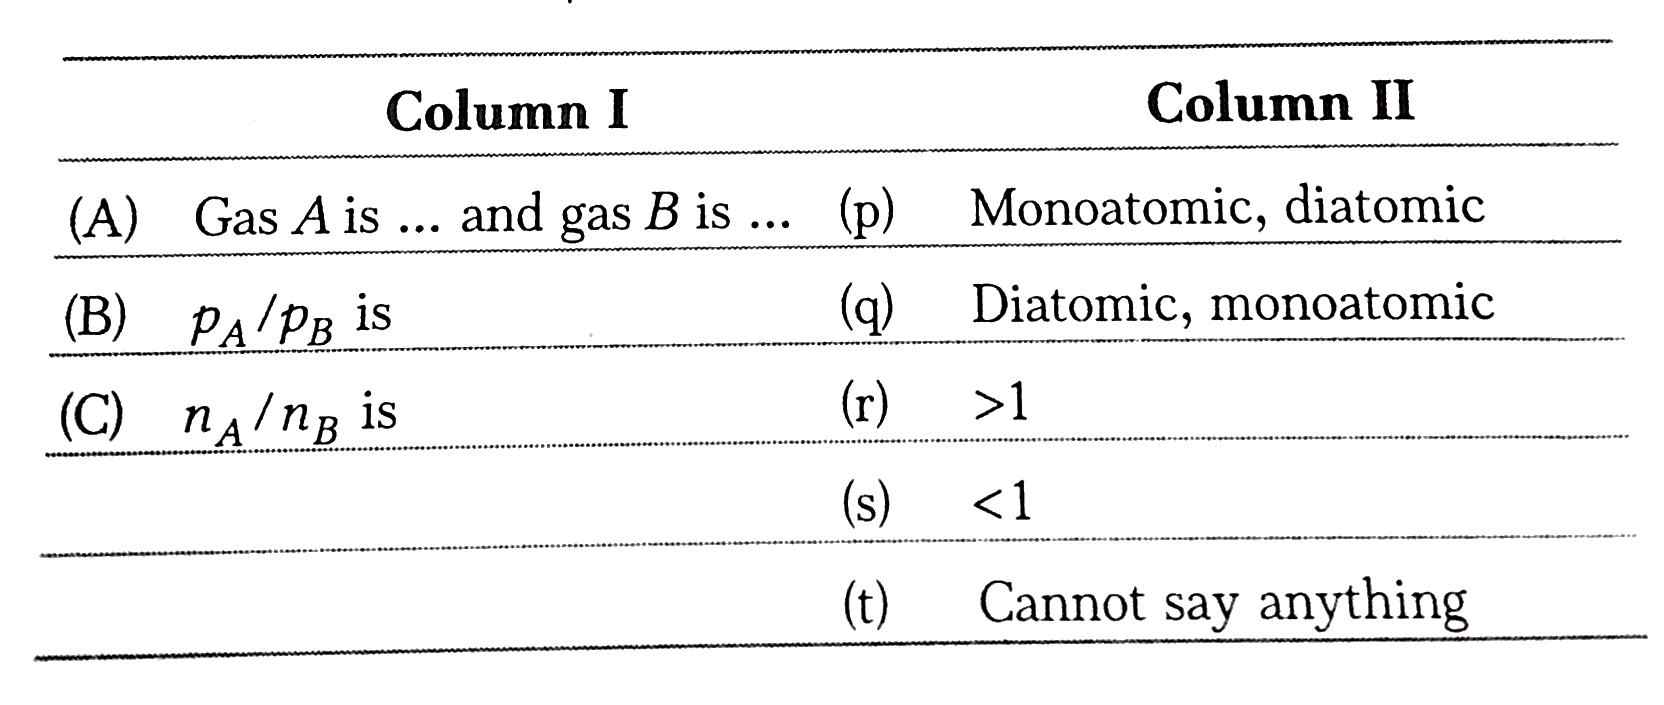
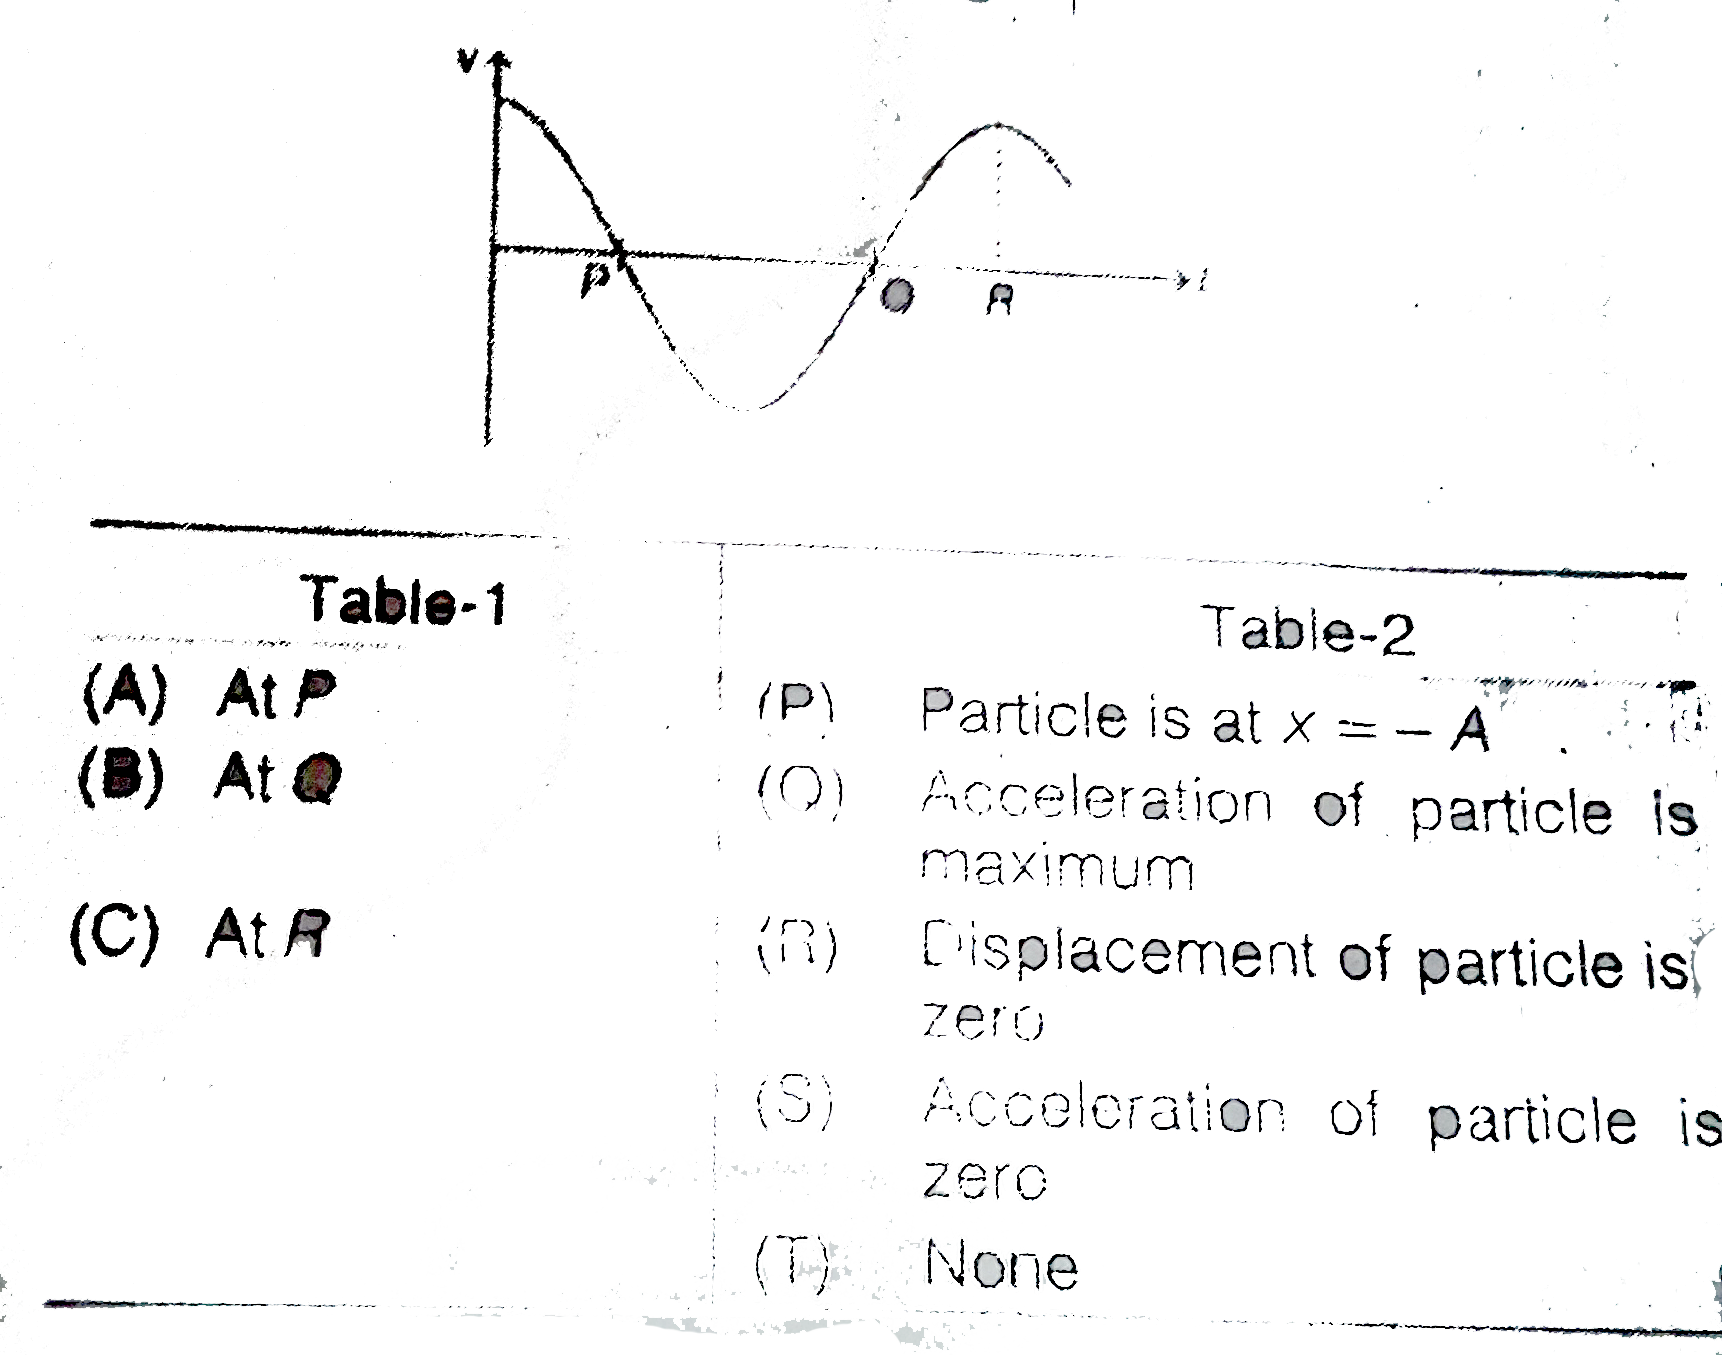
View SolutionVelocity-time graph of a particle in SHM is as shown in figure. Match the following
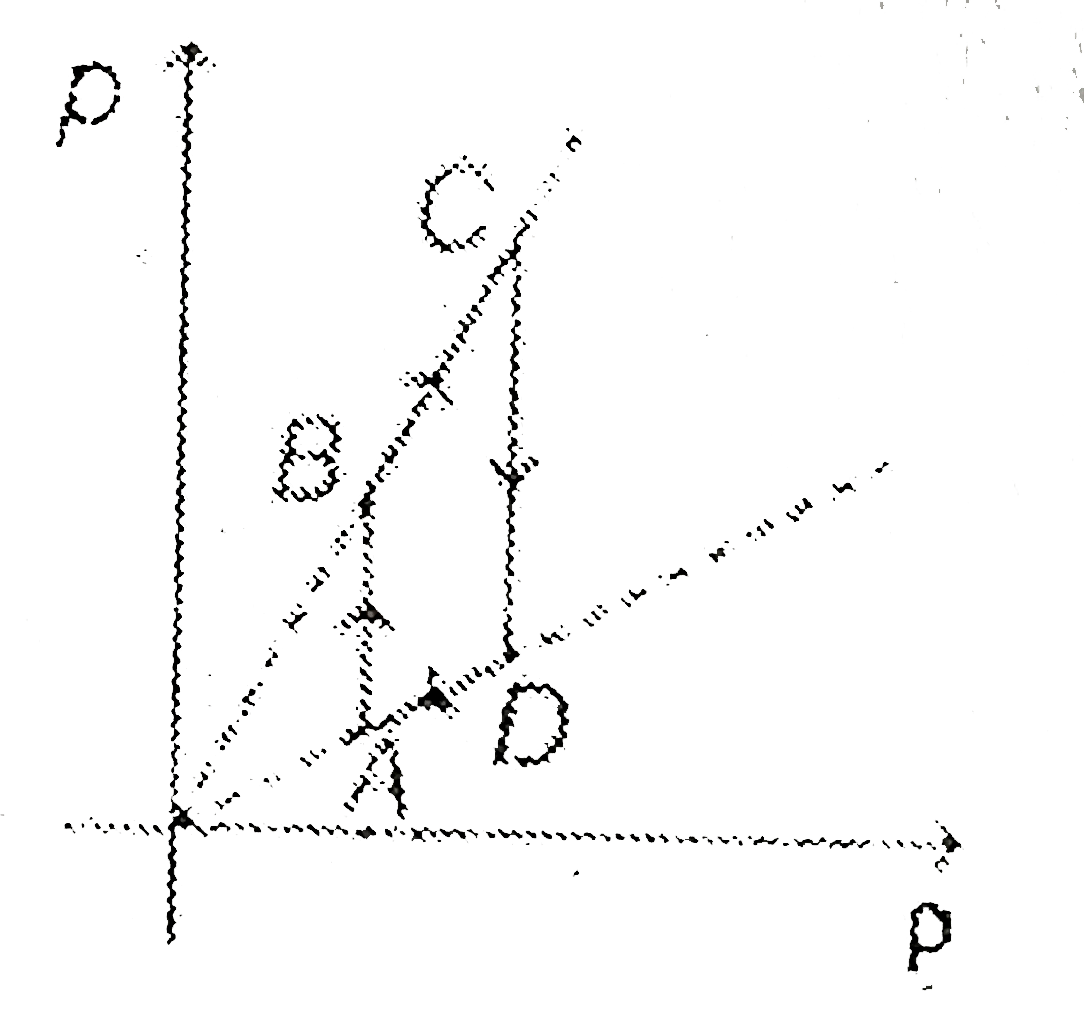
View SolutionPressure versus density graph of an ideal gas is shown in figure
View Solution
