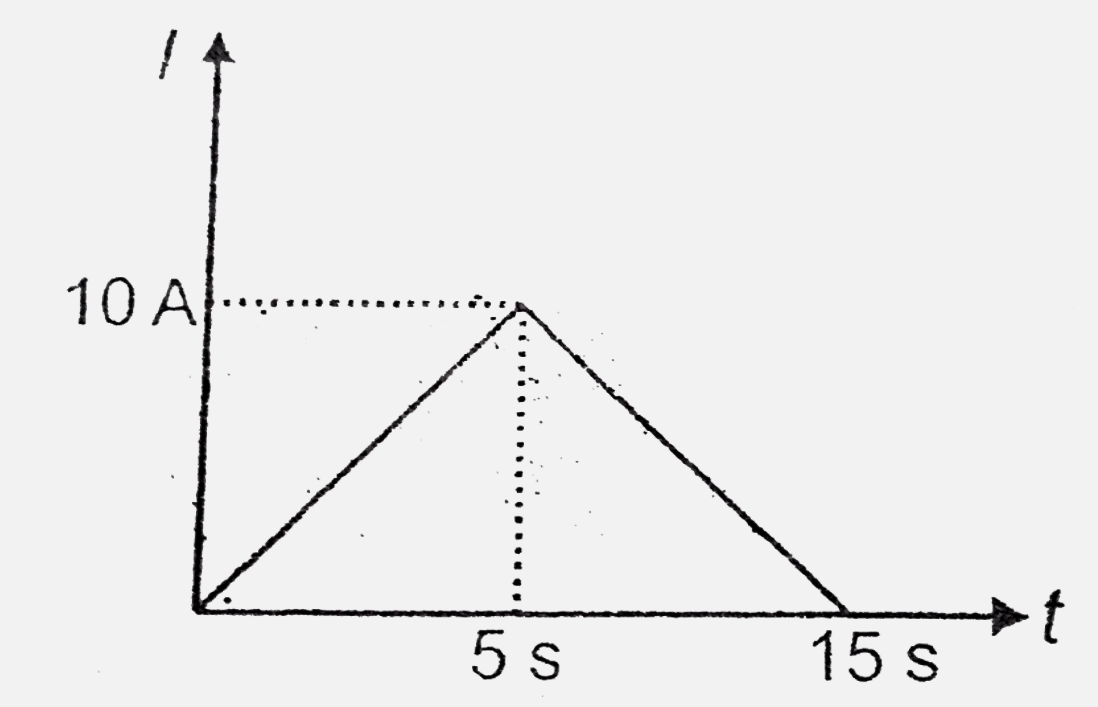
Current l versus time t graph through a conductor is shown in the figure. Average current through the conductor in the interval 0 to 15 s is
1A
10A
7.5A
5A
The correct Answer is:4
Step by step video & image solution for Current l versus time t graph through a conductor is shown in the figure. Average current through the conductor in the interval 0 to 15 s is by Physics experts to help you in doubts & scoring excellent marks in Class 12 exams.
Updated on:21/07/2023Topper's Solved these Questions
- CURRENT ELECTRICITYBOOK - AAKASH INSTITUTE ENGLISHCHAPTER - CURRENT ELECTRICITYEXERCISE - ASSIGNMENT SECTION-B(OBJECTIVE TYPE QUESTION ))
44 Videos
- CURRENT ELECTRICITYBOOK - AAKASH INSTITUTE ENGLISHCHAPTER - CURRENT ELECTRICITYEXERCISE - ASSIGNMENT SECTION-C(OBJECTIVE TYPE QUESTION ))
13 Videos
- CURRENT ELECTRICITYBOOK - AAKASH INSTITUTE ENGLISHCHAPTER - CURRENT ELECTRICITYEXERCISE - Try Yourself
34 Videos
- COMMUNICATION SYSTEMS BOOK - AAKASH INSTITUTE ENGLISHCHAPTER - COMMUNICATION SYSTEMS EXERCISE - ASSIGNMENT SECTION D (Assertion-Reason)
10 Videos
- DUAL NATURE OF RADIATION AND MATTER BOOK - AAKASH INSTITUTE ENGLISHCHAPTER - DUAL NATURE OF RADIATION AND MATTER EXERCISE - ASSIGNMENT (SECTION-D)
10 Videos
Similar Questions
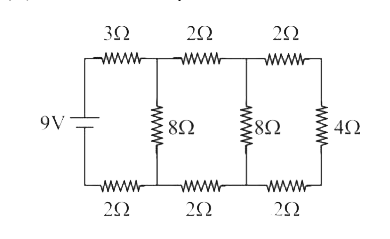
In the circuit shown in the figure, the current through the
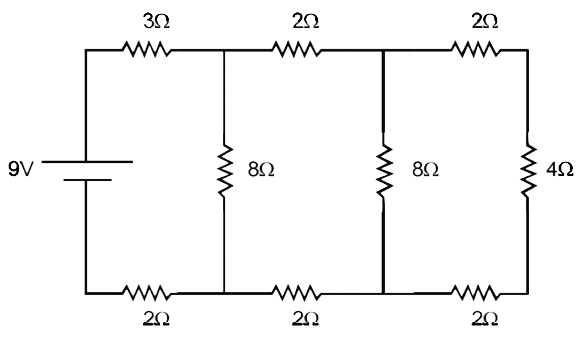
View SolutionIn the circuit shown in figure the current through
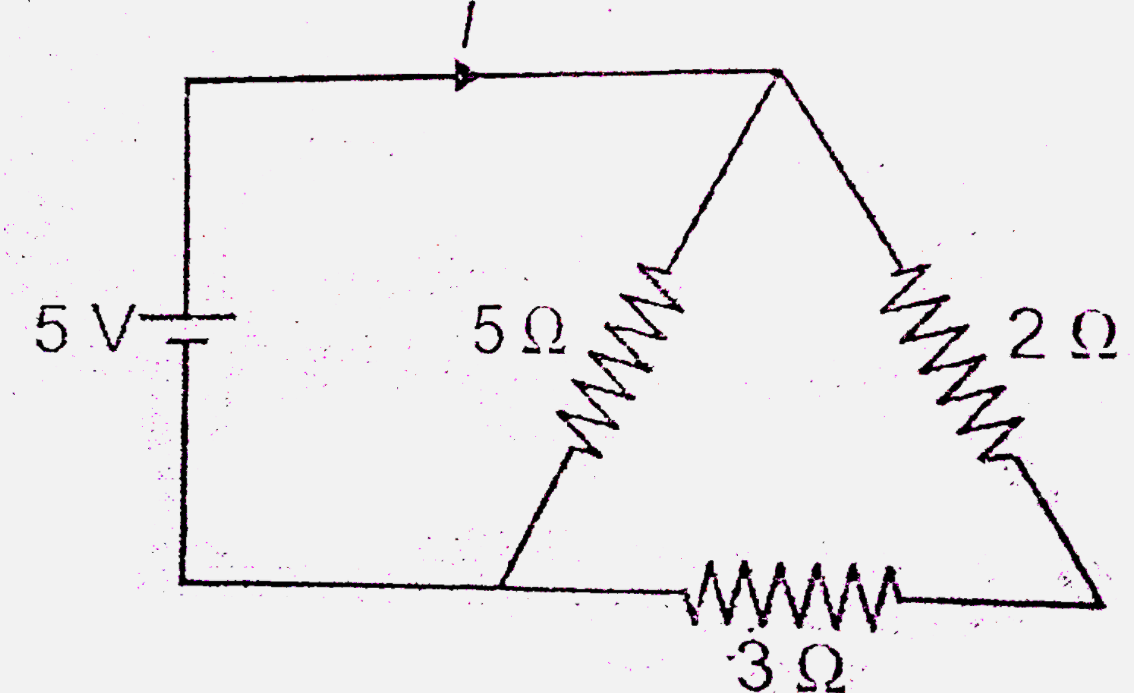
View SolutionThe current l through the cell in the network shown is
View SolutionWhen no current is passed through a conductor,
View SolutionWhen a current passes through a resistor, its temperature increases. Is it an adiabatic process?
View SolutionCharge through a cross-section of a conductor is given by Q=5t2−2t coulomb . Find the average current through the conductor in the interval t1=2s to t2=4s
(1) 14s (2) 28 A
(3) 56A (4) 7A
View SolutionCharge through a cross section of a conductor is give by Q=5t2−2t coulomb .Find the average current through the conduction the interval t1=2s to t2=4s .
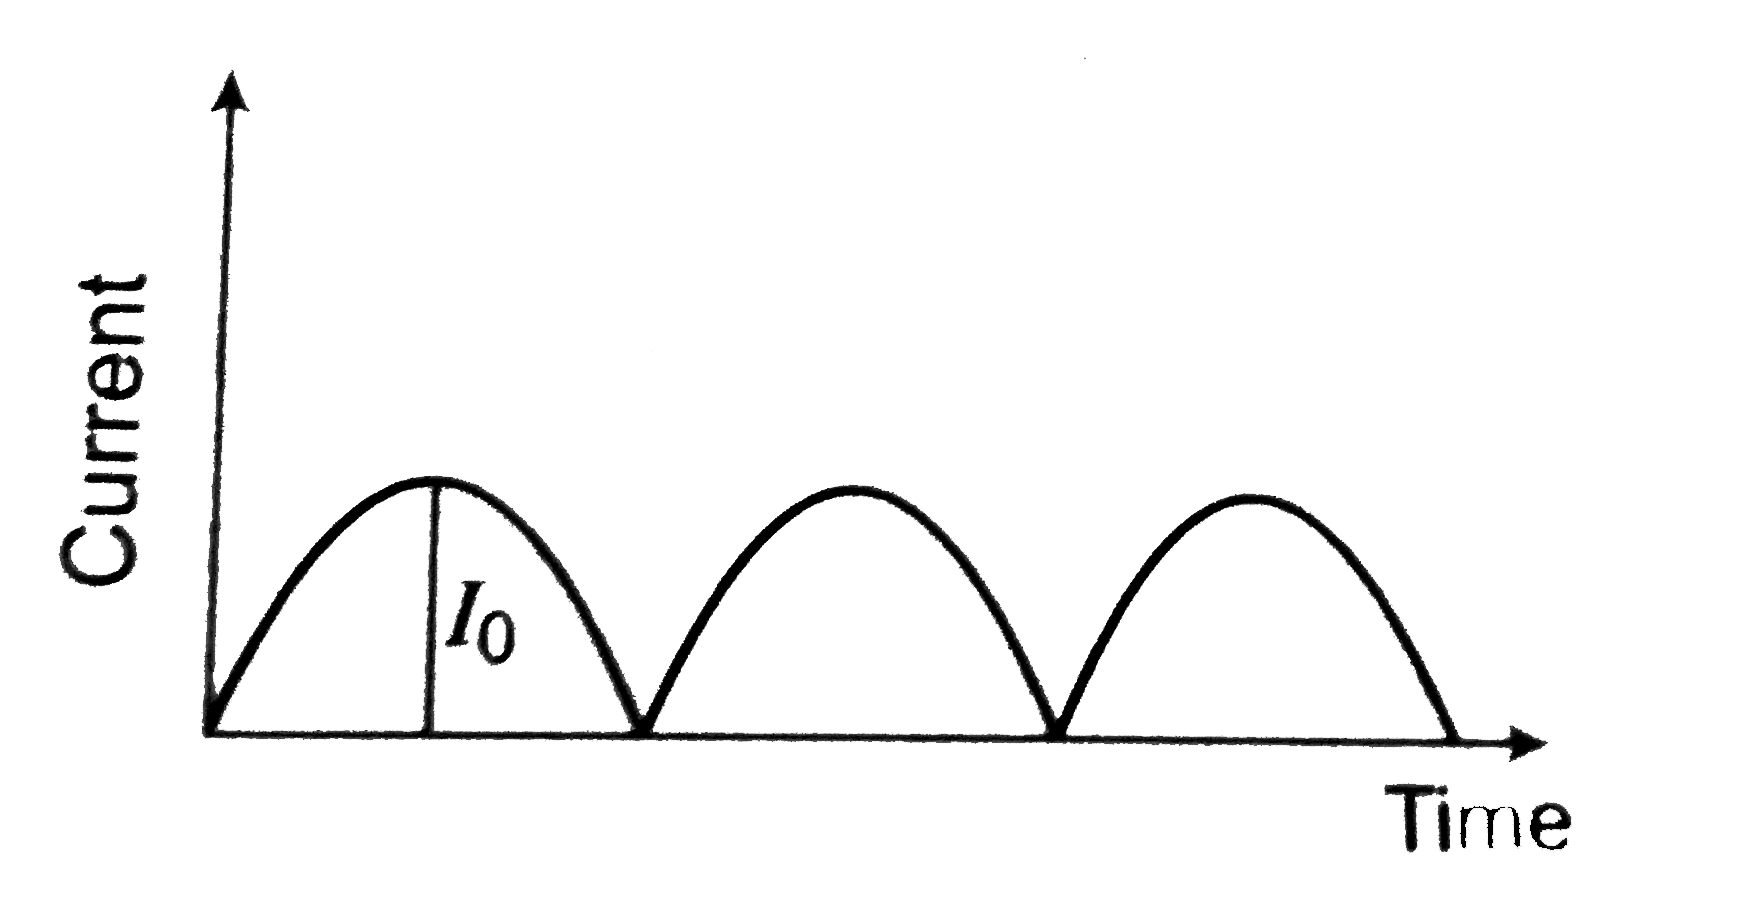
View SolutionThe output current versus time curve of a rectifier is shown in the figure. The average value of output current in this case is
View SolutionRelation between current in a conductor and time is shown in fig.

Total charge flowing through the conductor is
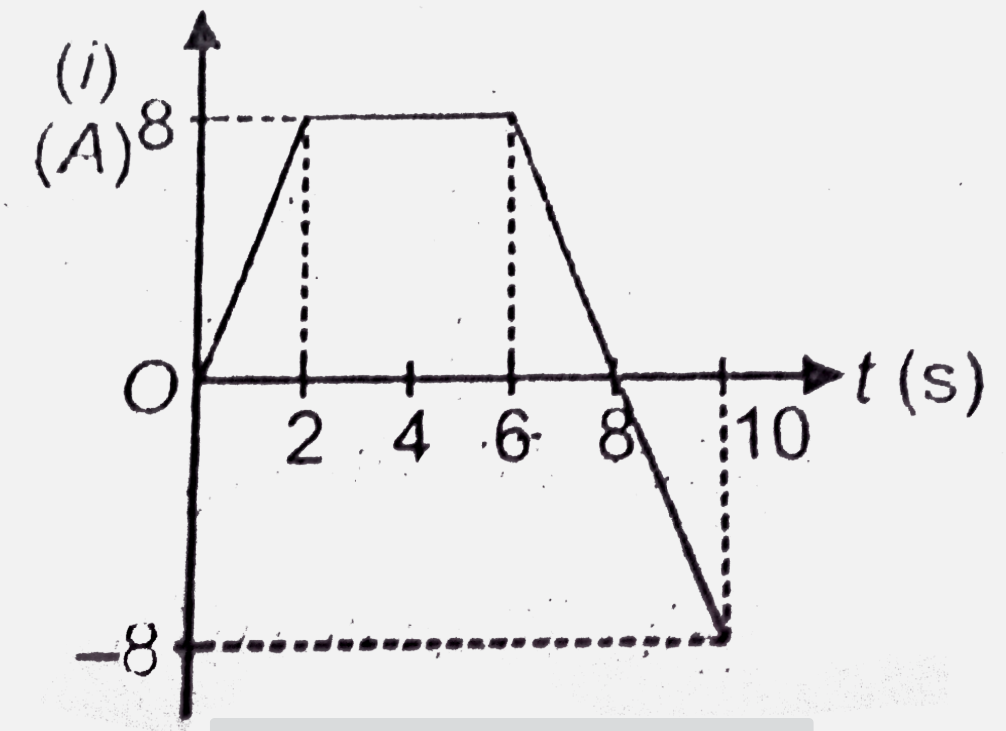
View SolutionThe current I through a conductor varies with time t as shown in figure. The average electric current during t=0 to t=10 s will be
View Solution