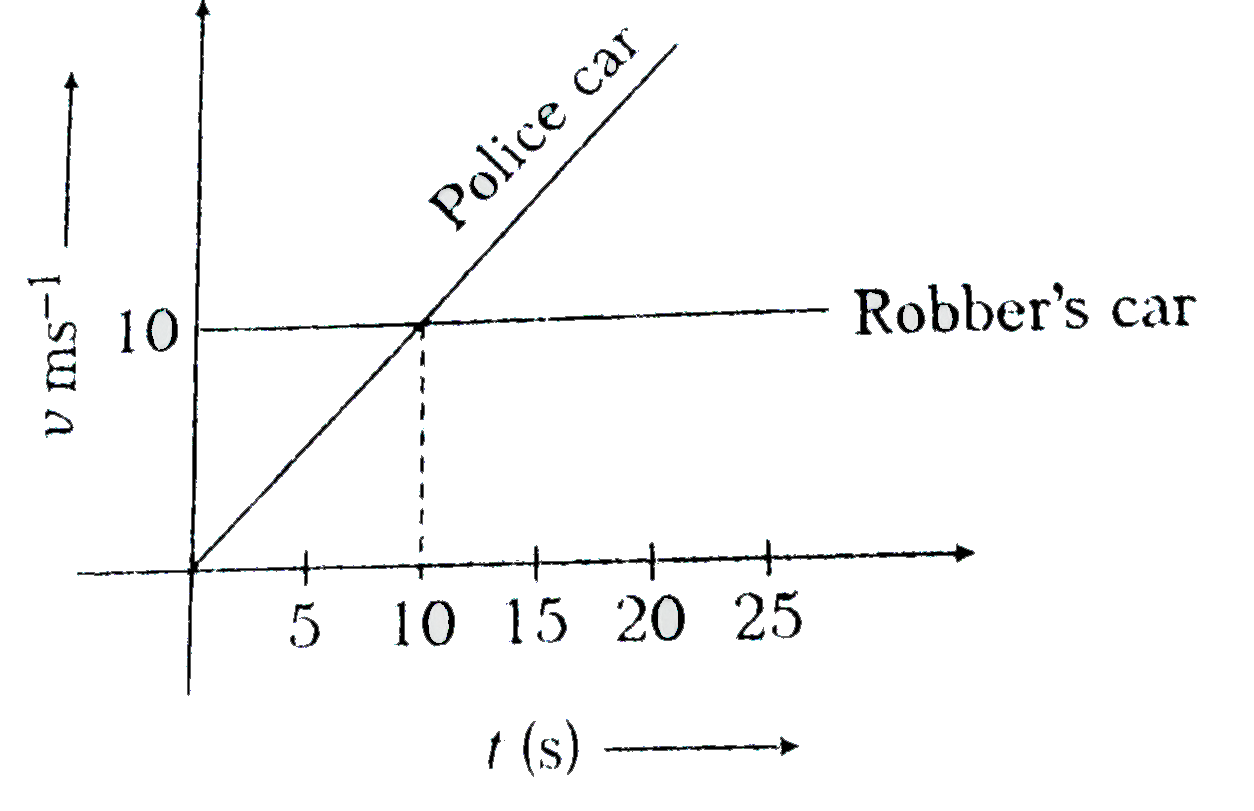
The velocity-time graph of robber's car and a chasing police car are shown in the following graph. Police car crosses the robber's car in time
10 s after it starts
1 s after it starts
20 s after it starts
Never crosses
The correct Answer is:C
From graph, velocity of robber's car =10ms−1
Let police car crosses it after t second.
Distance travelled by robber's car = 10 t m
Police car is moving with a constant acceleration of 1ms−2 as it attains a velocity of 10ms−1 in 10 s after starting from rest. Distance travelled in t second =12.a.t2=12t2
When the police car crosses the arosses the robber's car, distance travelled by the both cars should be same from the starting point of chase.
∴12t2=10t⇒t=20s
Topper's Solved these Questions
- BOOK - DC PANDEY ENGLISHCHAPTER - MOTION IN A PLANEEXERCISE - (B) Meical entrance special format questions (Mathch the columns)6videos
MOTION IN A PLANE
- BOOK - DC PANDEY ENGLISHCHAPTER - MOTIONEXERCISE - Medical entrances gallery19videos
MOTION
- BOOK - DC PANDEY ENGLISHCHAPTER - PROJECTILE MOTIONEXERCISE - Level - 2 Subjective10videos
PROJECTILE MOTION
Similar Questions
The velocity-time graphs of a car and a scooter are shown in the figure. (i) The difference between the distance travelled by the car and the scooter in 15 s and (ii) the time at which the car will catch up with the scooter are, respectively.
 View Solution
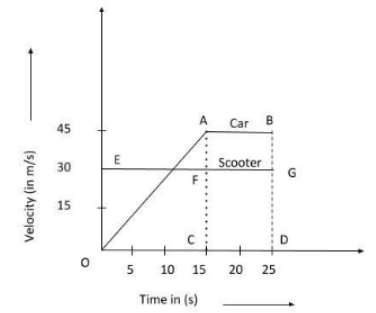
The velocity-time graphsof a car and a scooter are shown in the figure. (i) The difference between the distance travelled by the car and the scooter in 15 and (ii) the time at which the car will catch up with the scooter are, respectively.
 View Solution
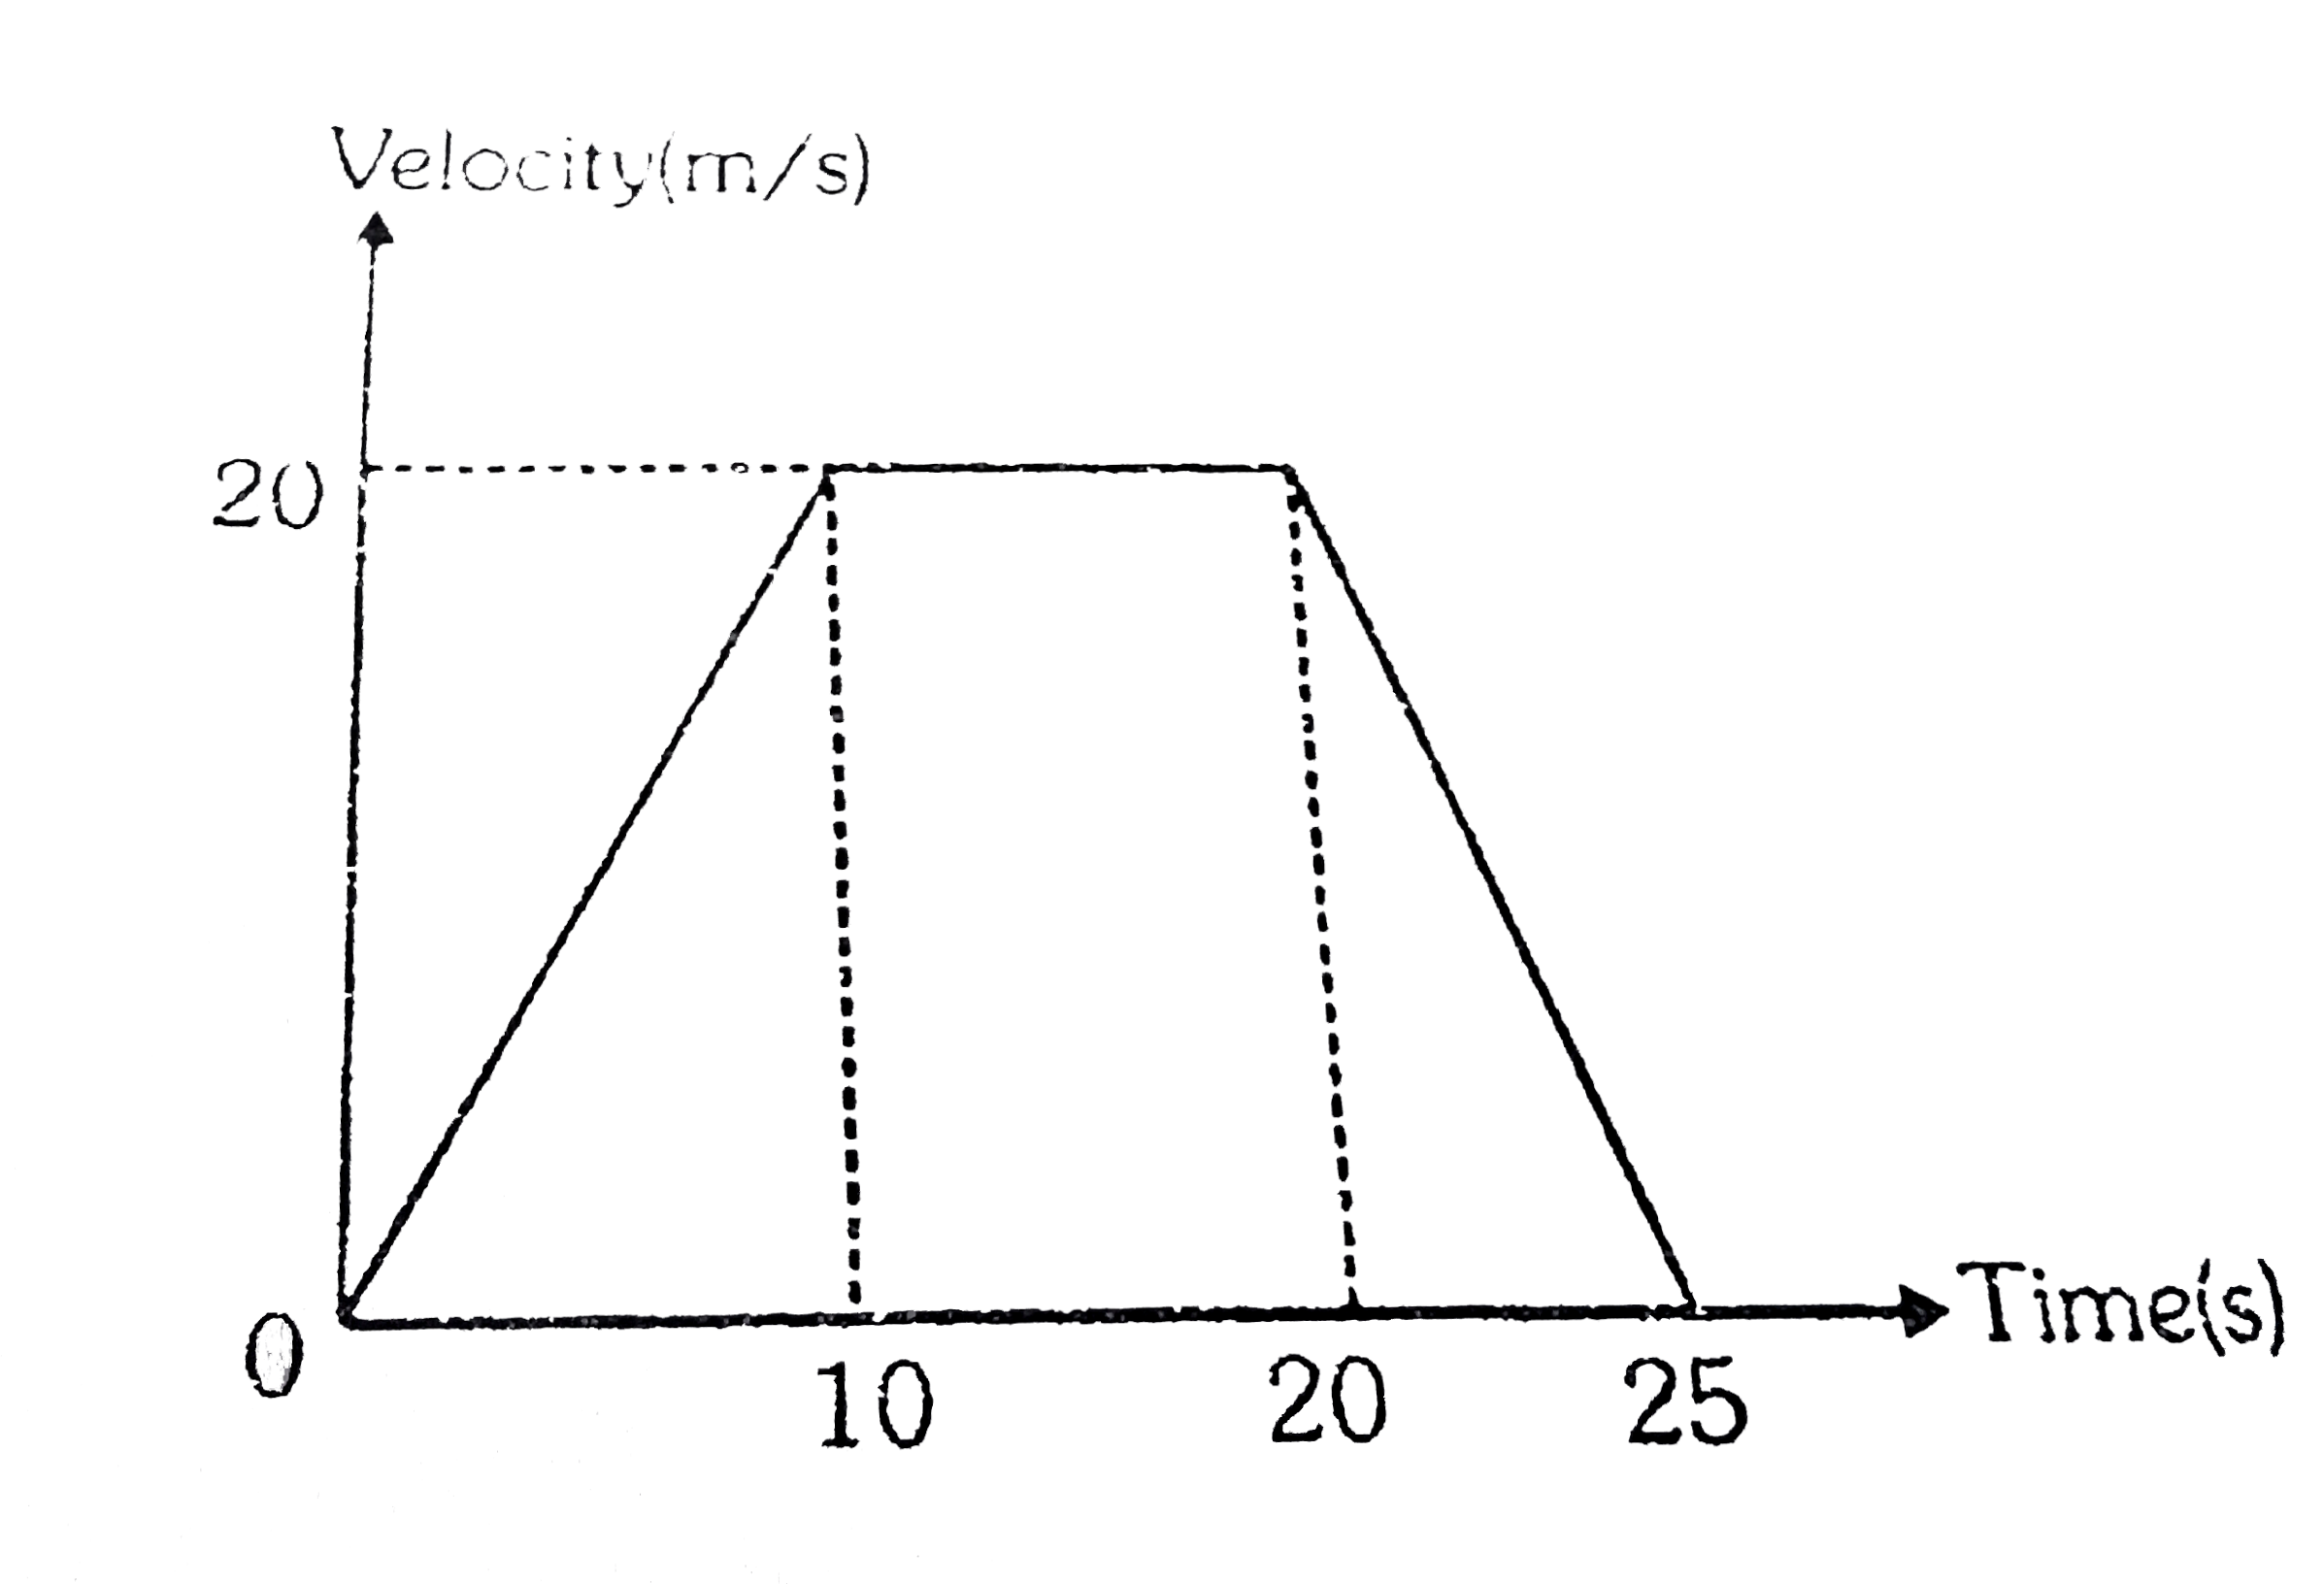
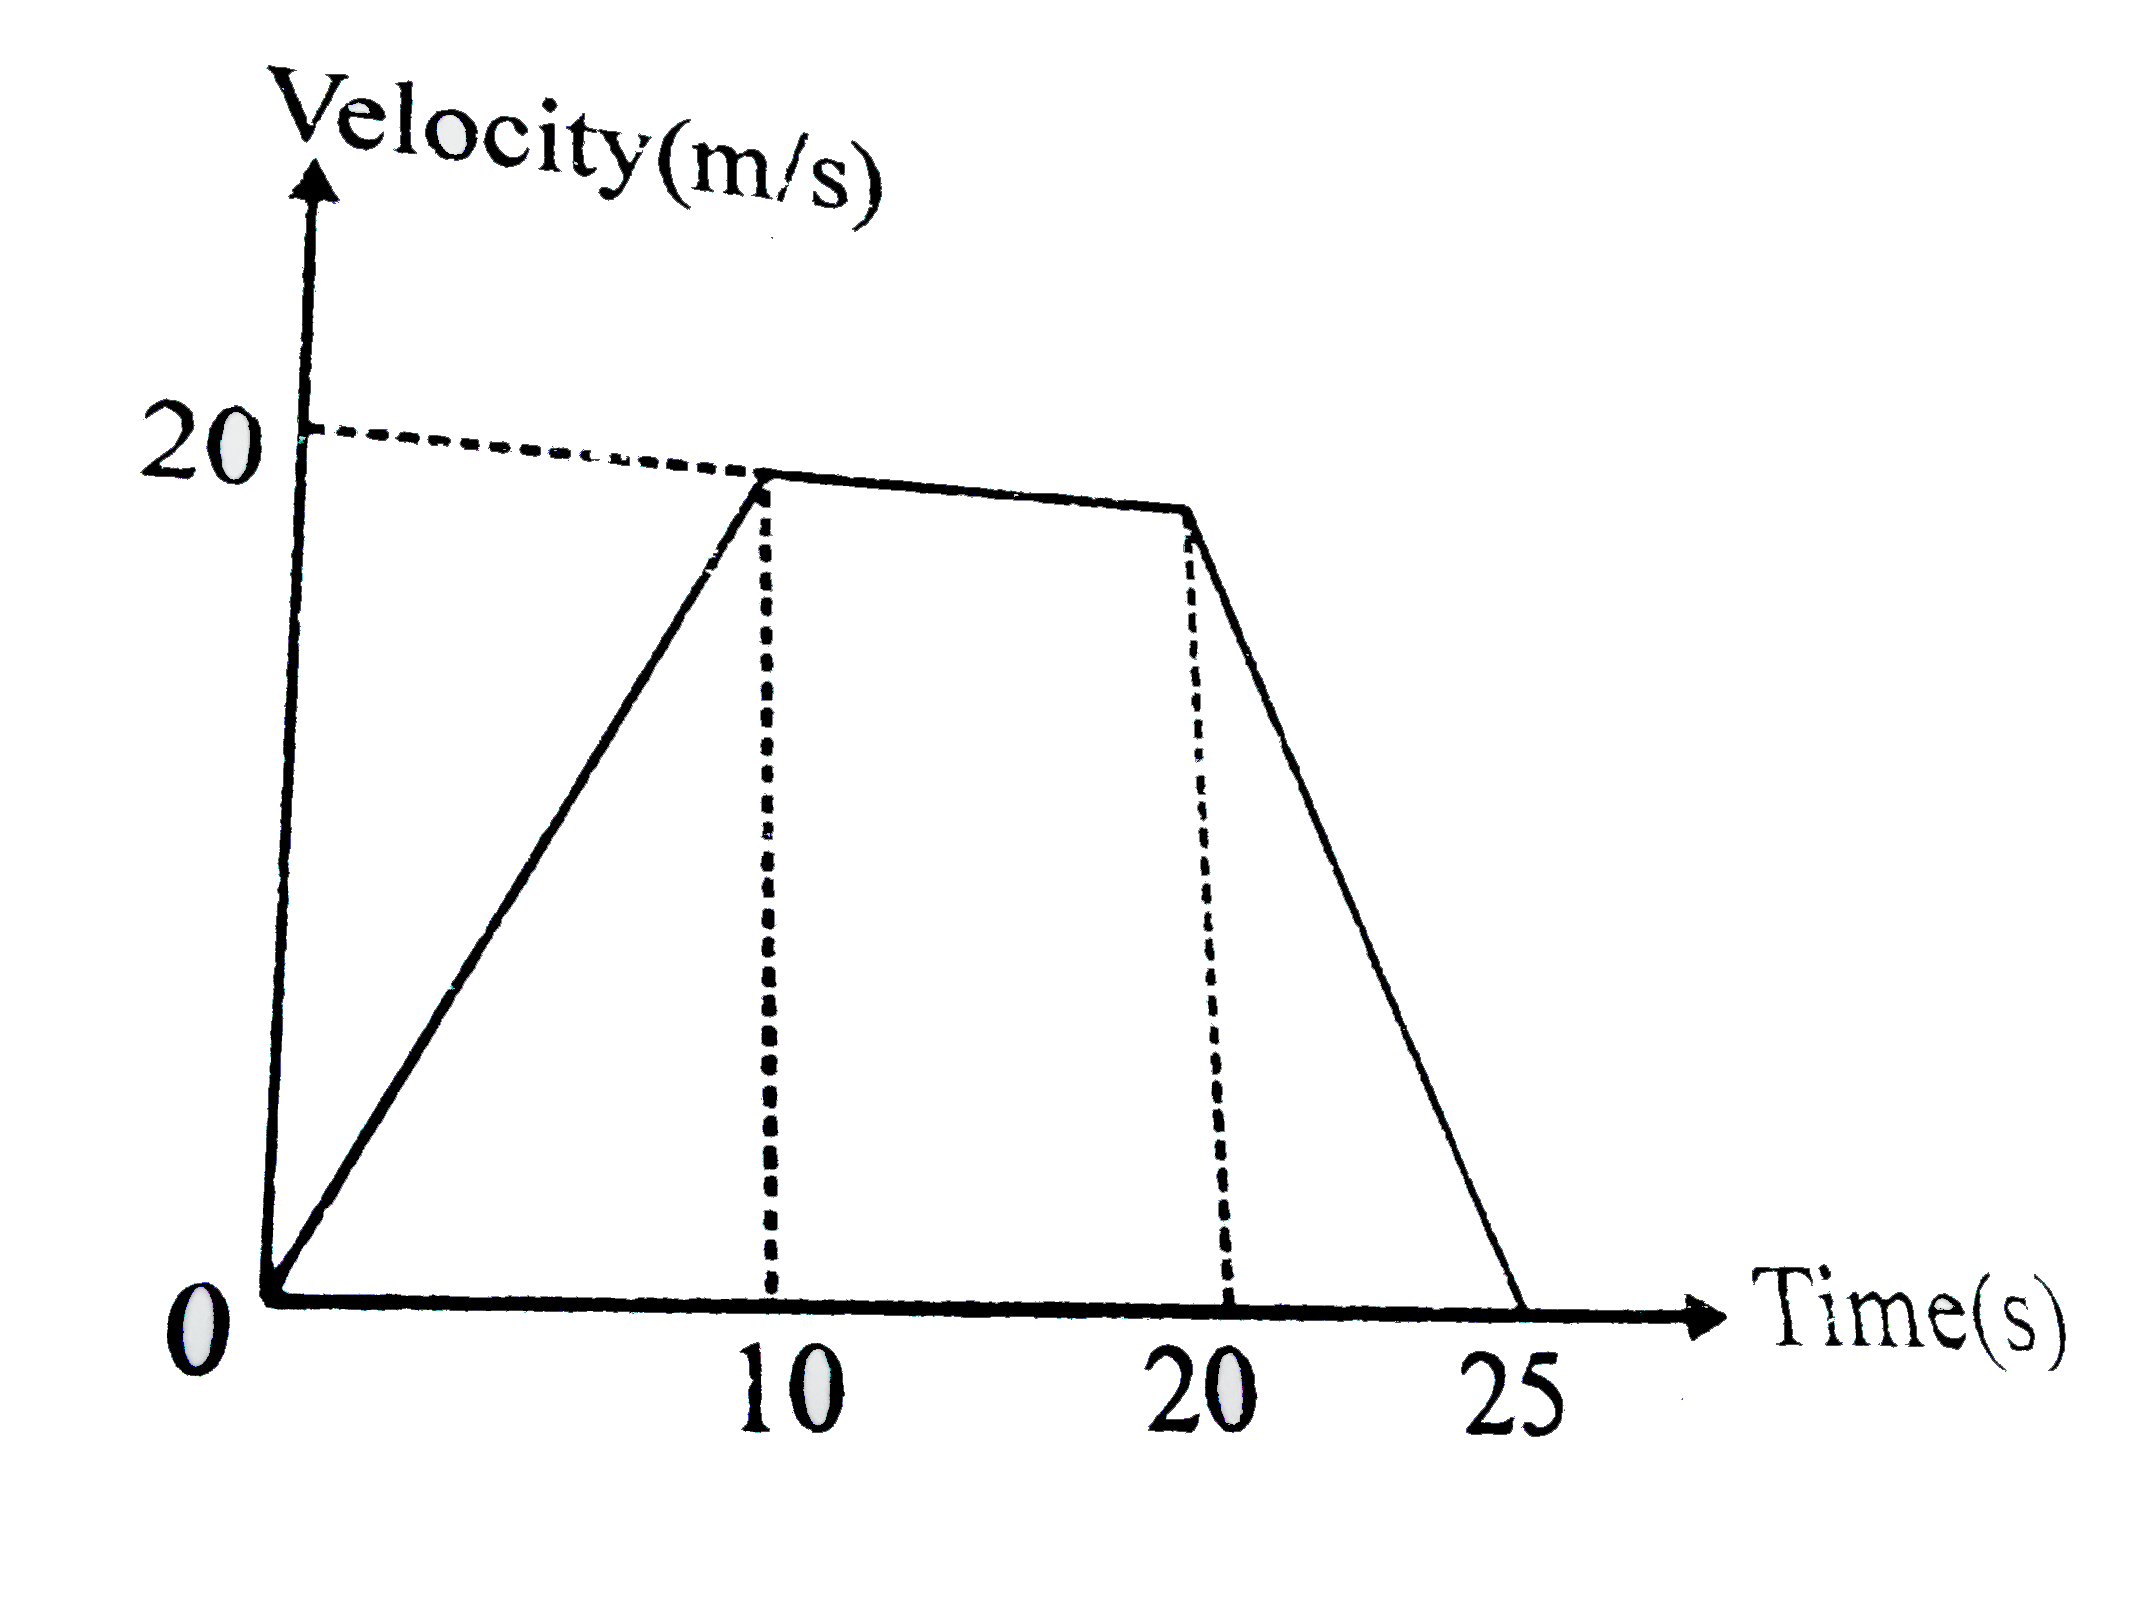
The velocity-time graph of a car moving along a straight road is shown in figure. The average velocity of the car is first 25 seconds is
 View Solution
The velocity-time graph of a car moving along a straight road is shown in figure. The average velocity of the car in first 25 seconds is
 View Solution
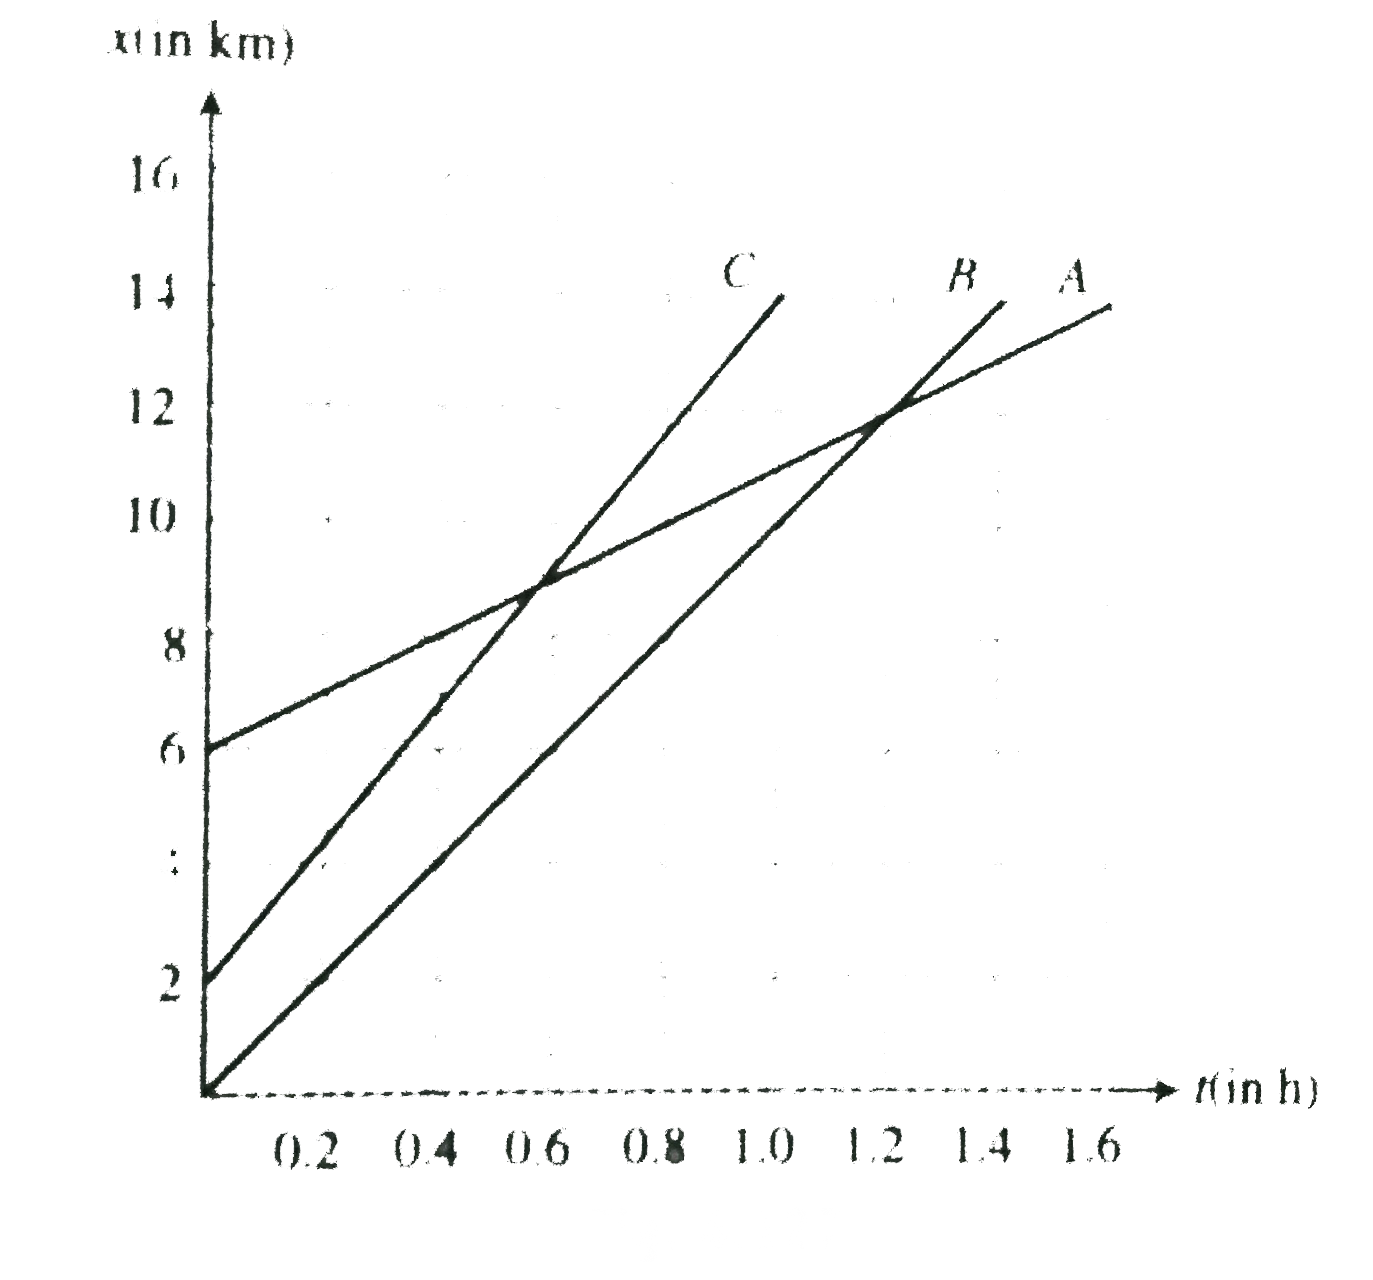
Shows the position-time graphs of three cars A,B and C On the basis of the graphs answer the follwing questions:
 .
.
a. Which car has the highest speed and which the lowest?
b. Are the three cars evrs at the same point on the road?
c. When C passes A, wher is B?
d. What is the time interval during car A travel between the time it passed cars B and C ?.
e. What is the relative velocty of car B with respect to car C?View SolutionA car is moving on a straight road. The velocity of the car varies with time as shown in the figure. Initially (at t=0), the car was at x=0, where, x is the position of the car at any time 't'.
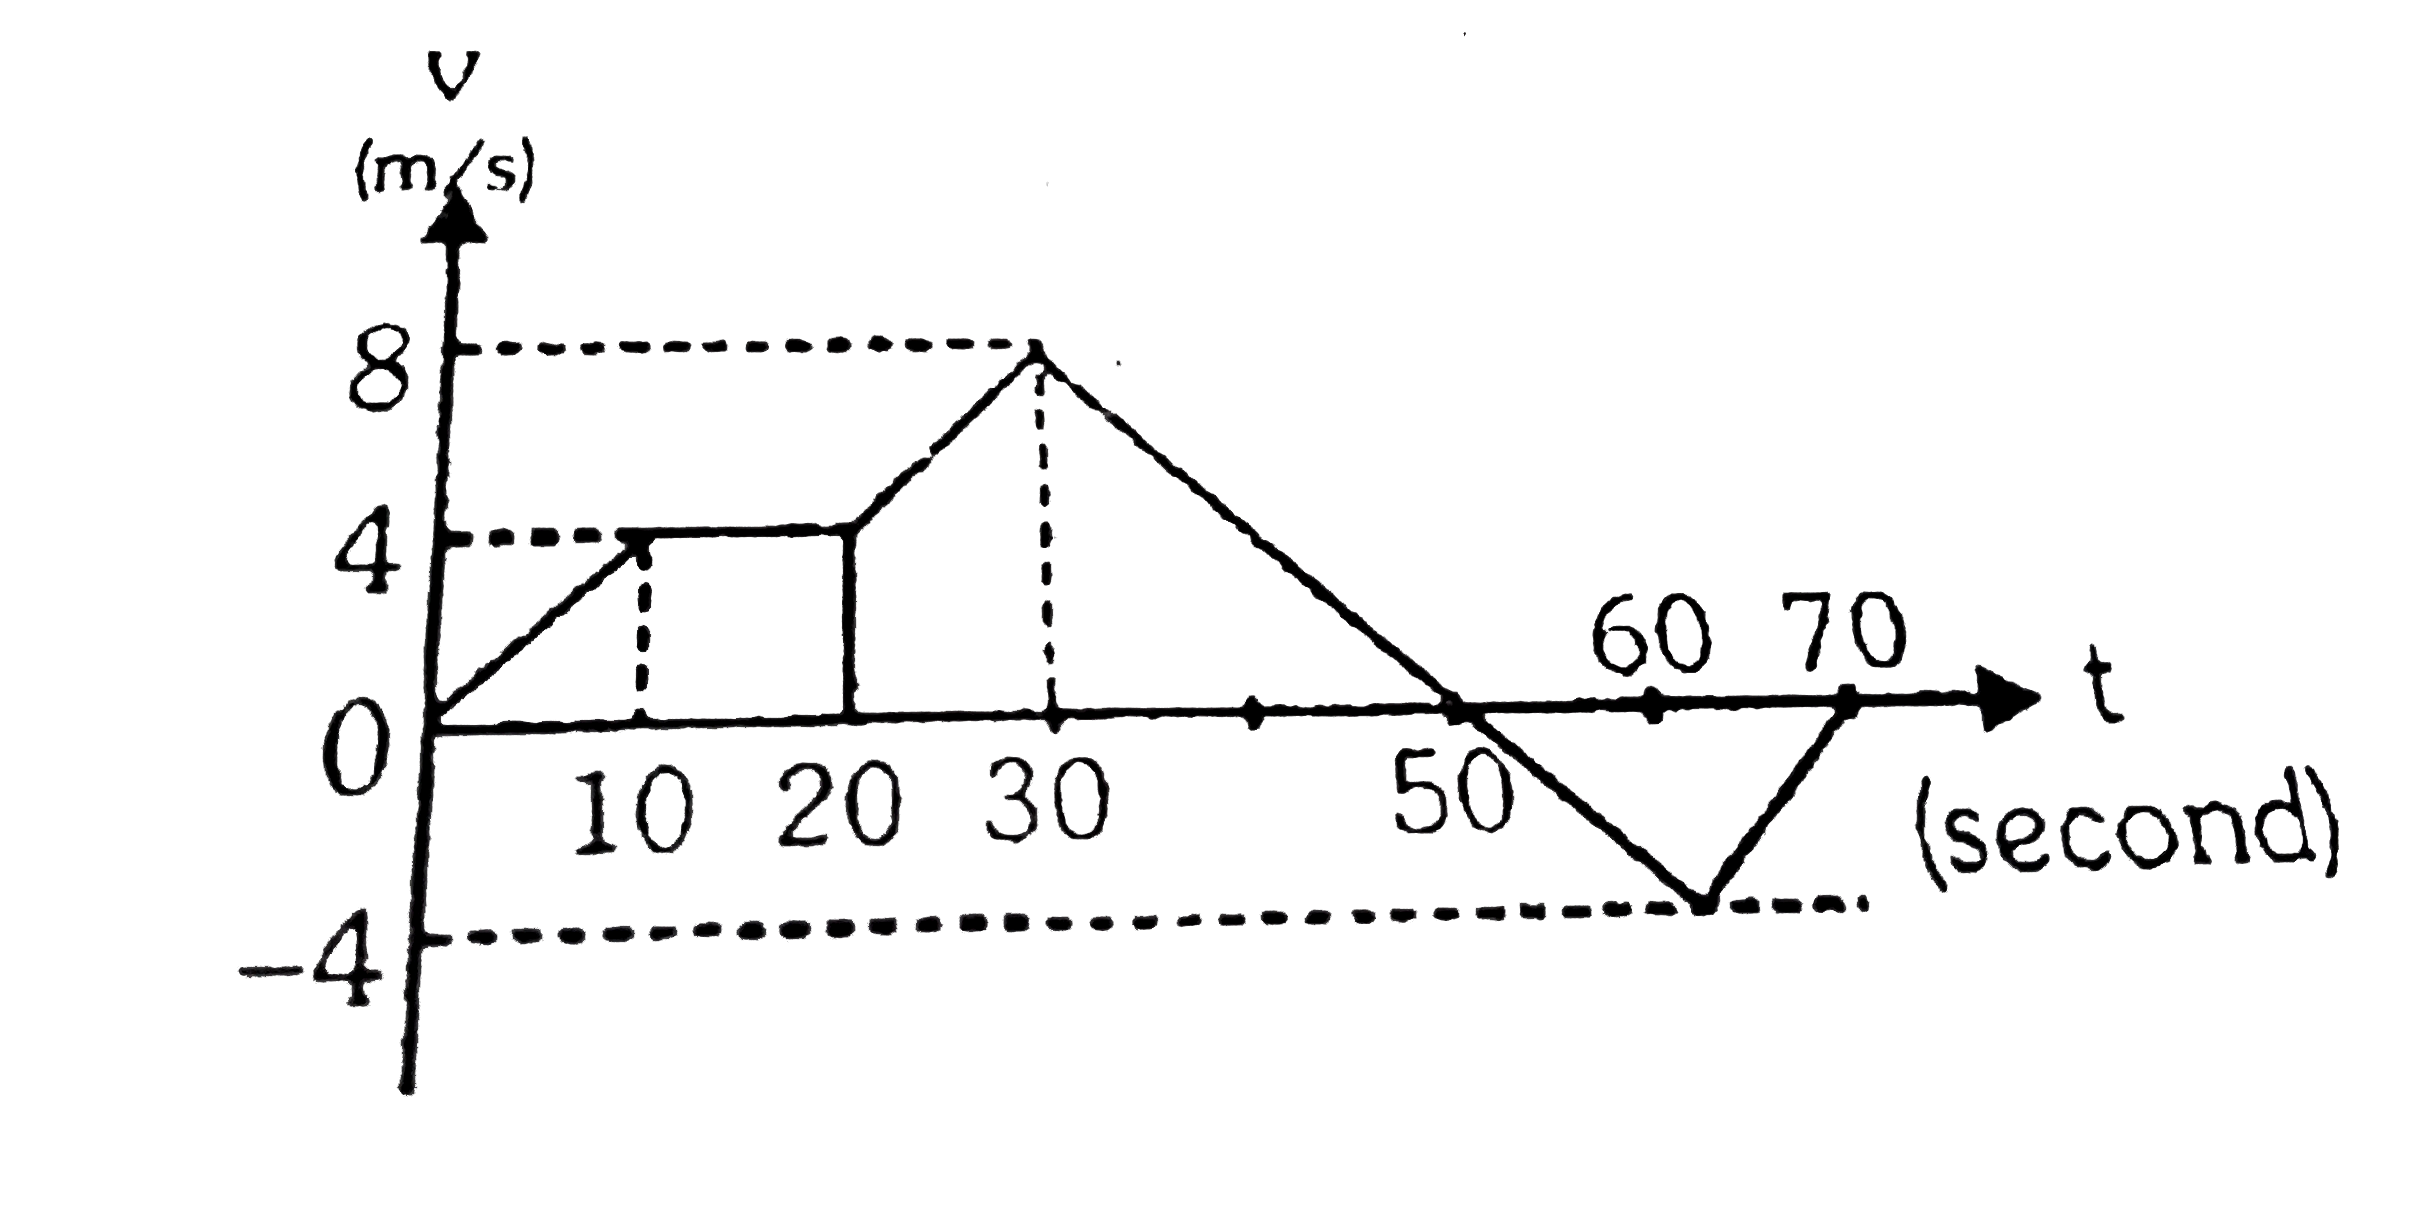
The maximum displacement from the starting position will be :-View SolutionA car is moving on a straight road. The velocity of the car varies with time as shown in the figure. Initially (at t=0), the car was at x=0, where, x is the position of the car at any time 't'.
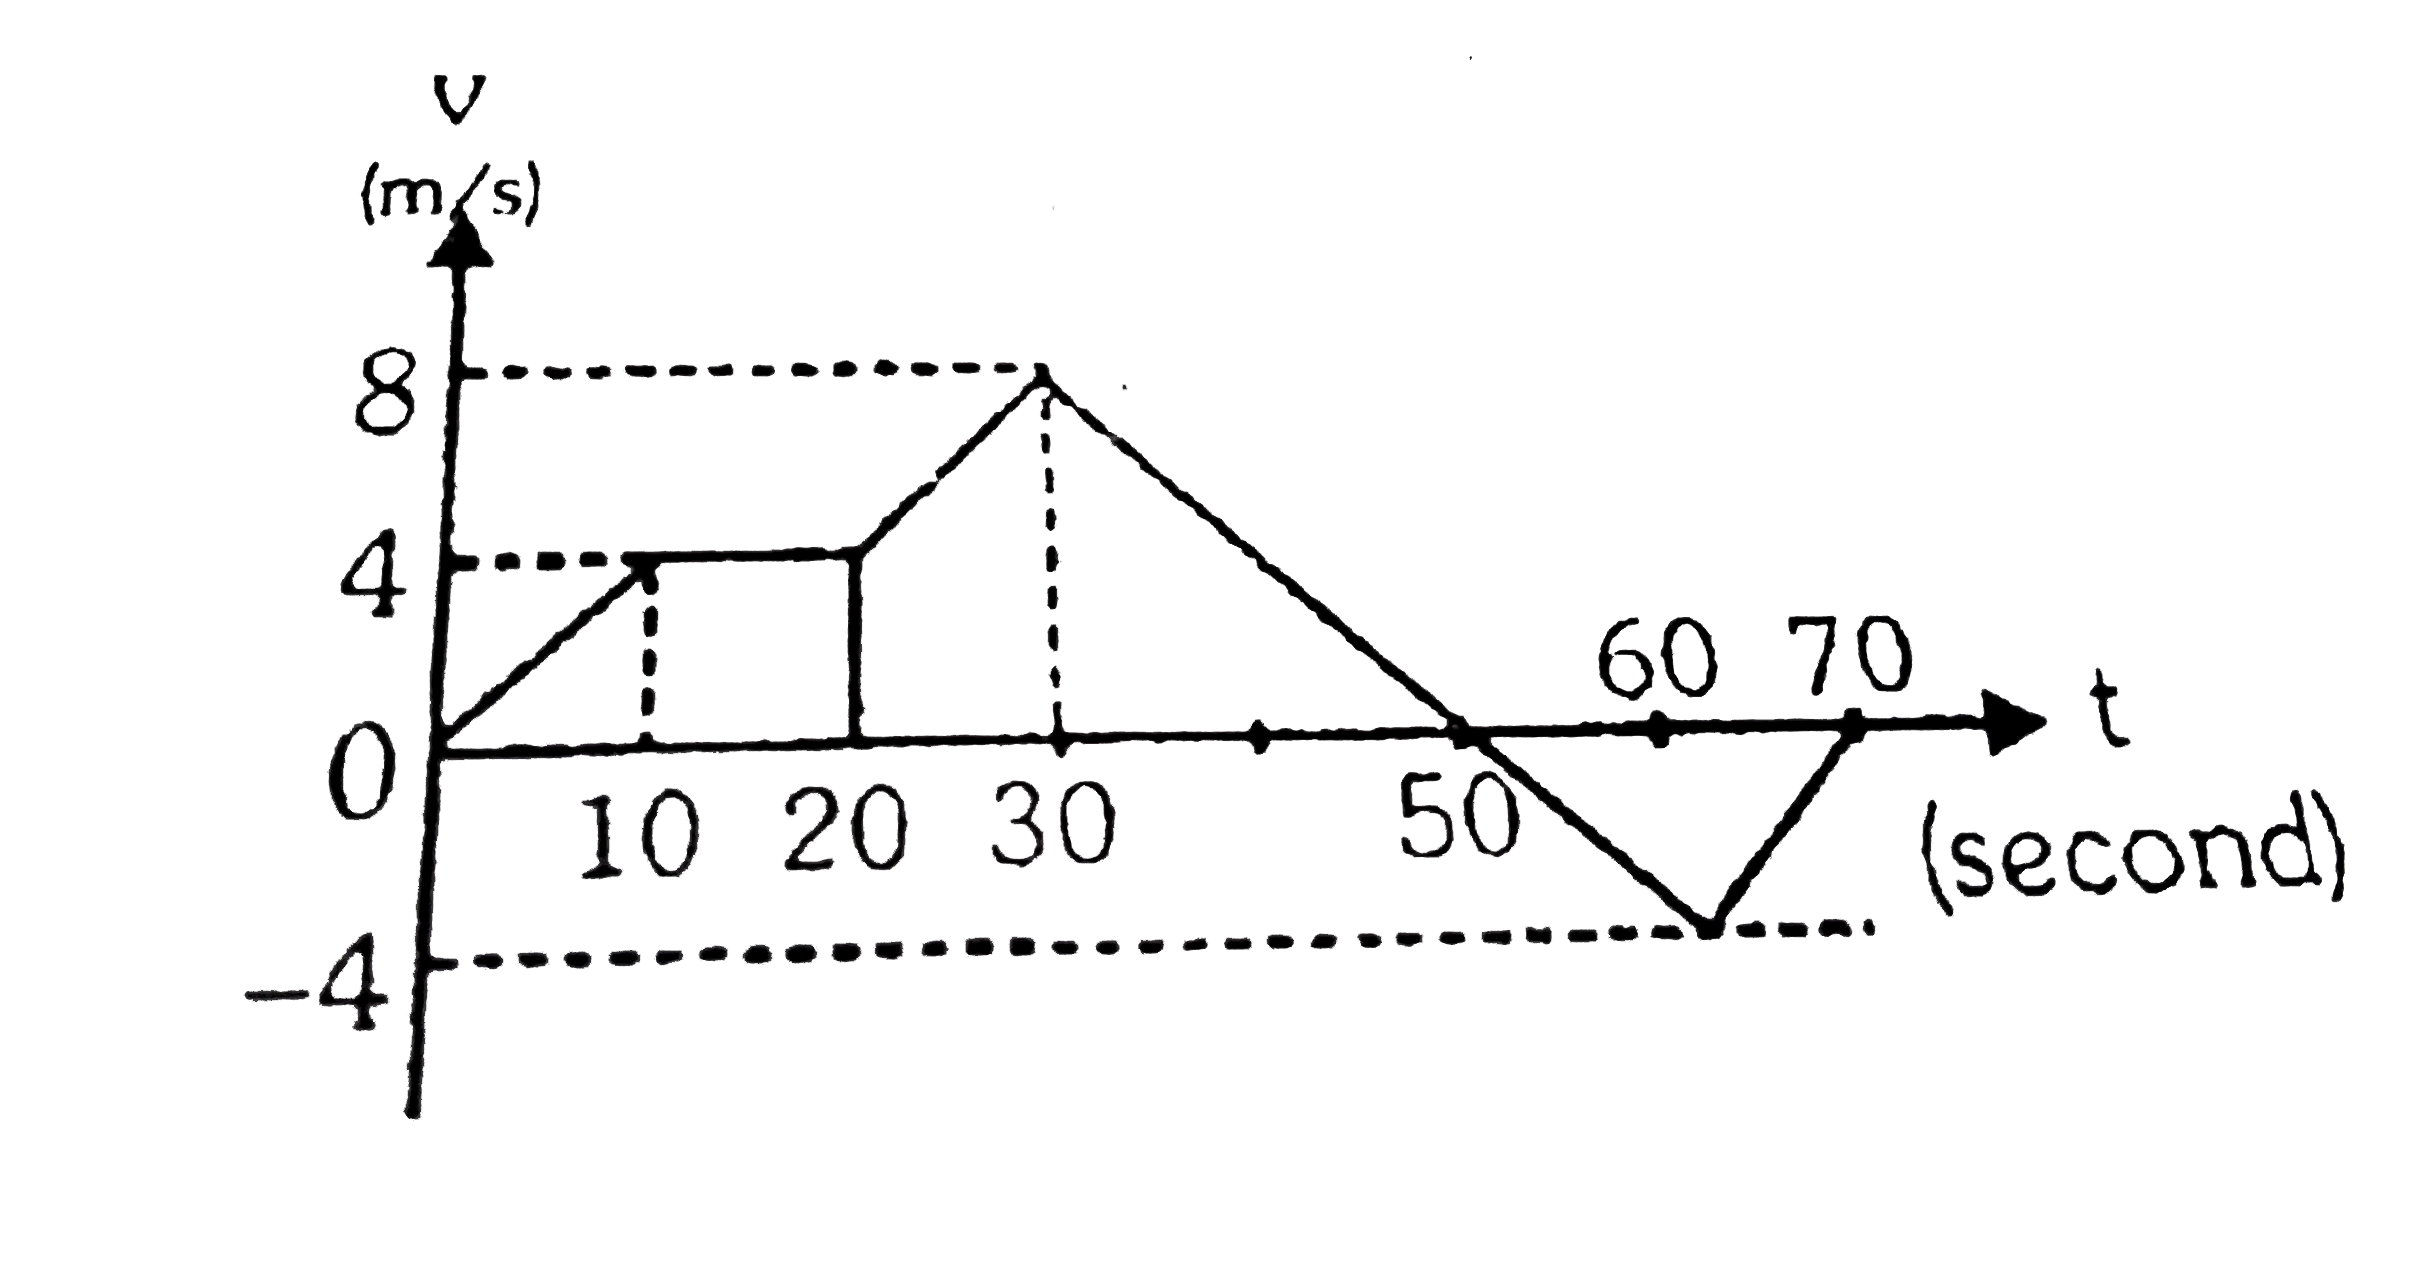
The time interval during which the car is retarding can be :-View SolutionSpeed time graph of two cars A and B approaching towards each other is shown in figure. Initial distance between them is 60m. The two cars will cross each other after t secons. Find value of it t.
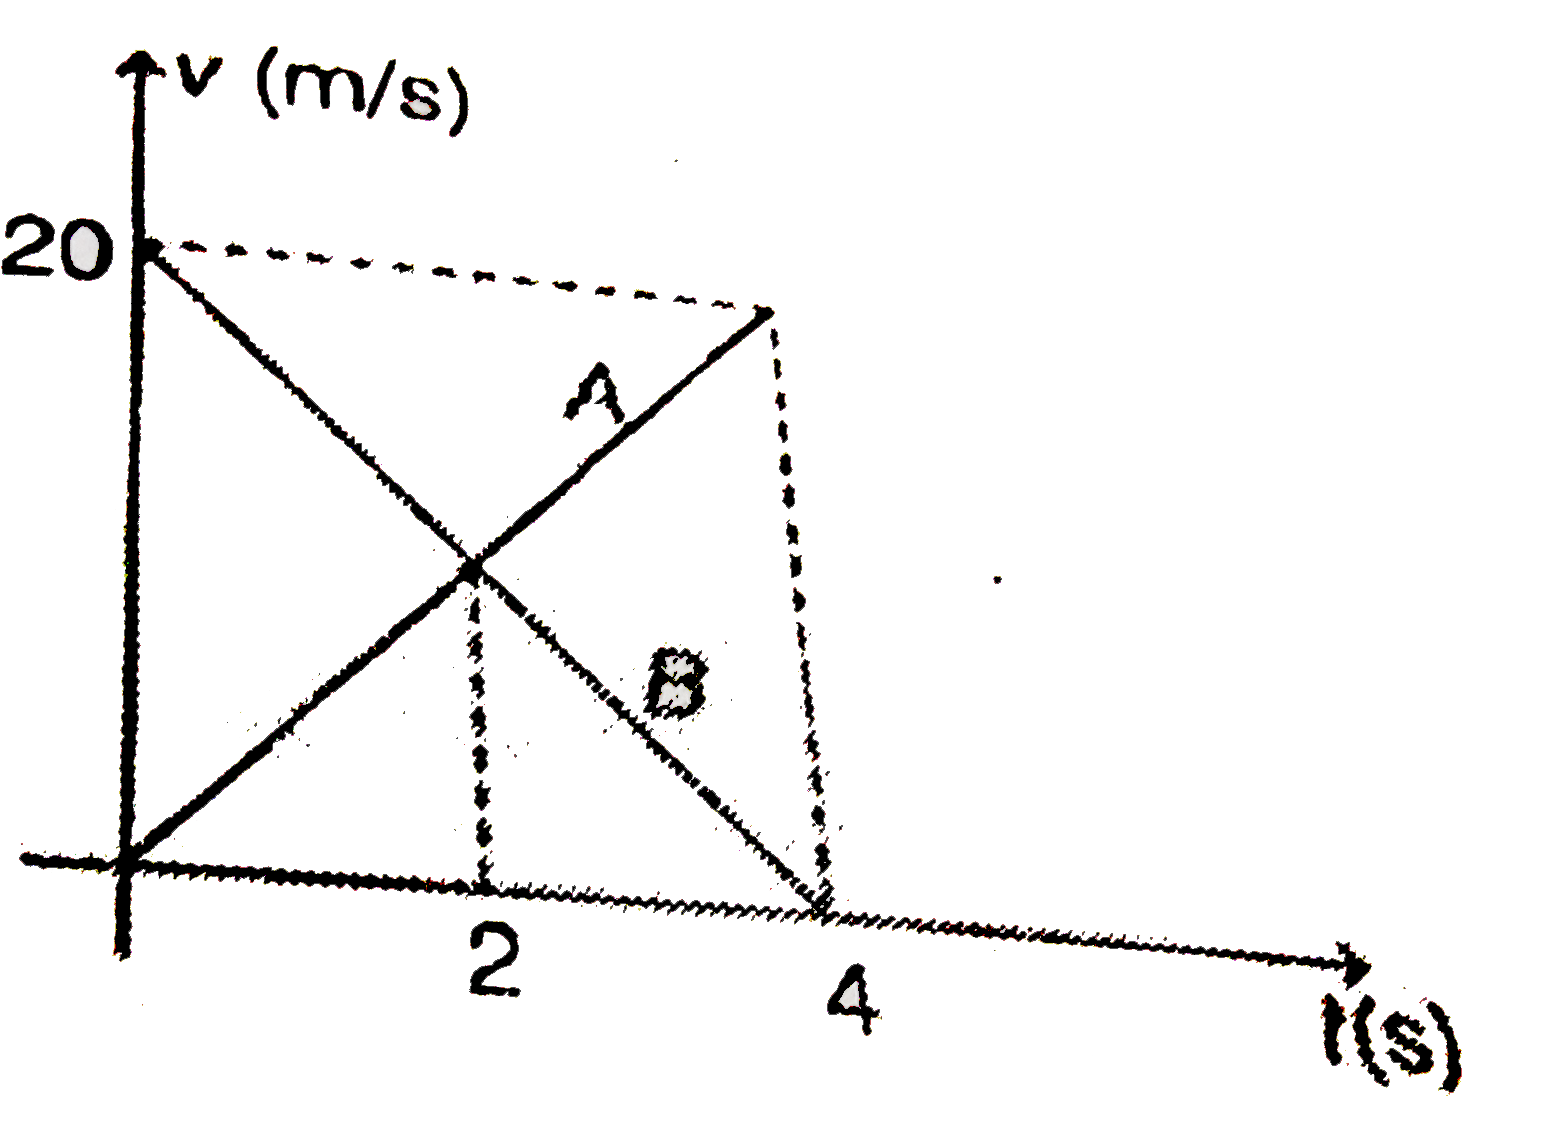 View Solution
Graphs are very useful to represent a physical situation. Various quantities can be easily represented on graphs and other quantites can be determined from the graph. For example the slope of velocity-time graph represents instantaneous acceleration. For a motion with constant acceleration slope of velocity-time graph is constant. If acceleration is changing with time, slope with change and thus velocity-time graph will be a non-linear curve. Further the area of velocity-time graph gives displacement.
The average velocity of the car for the entire trip isView SolutionThe speed-time graph for a car is shown is Figure
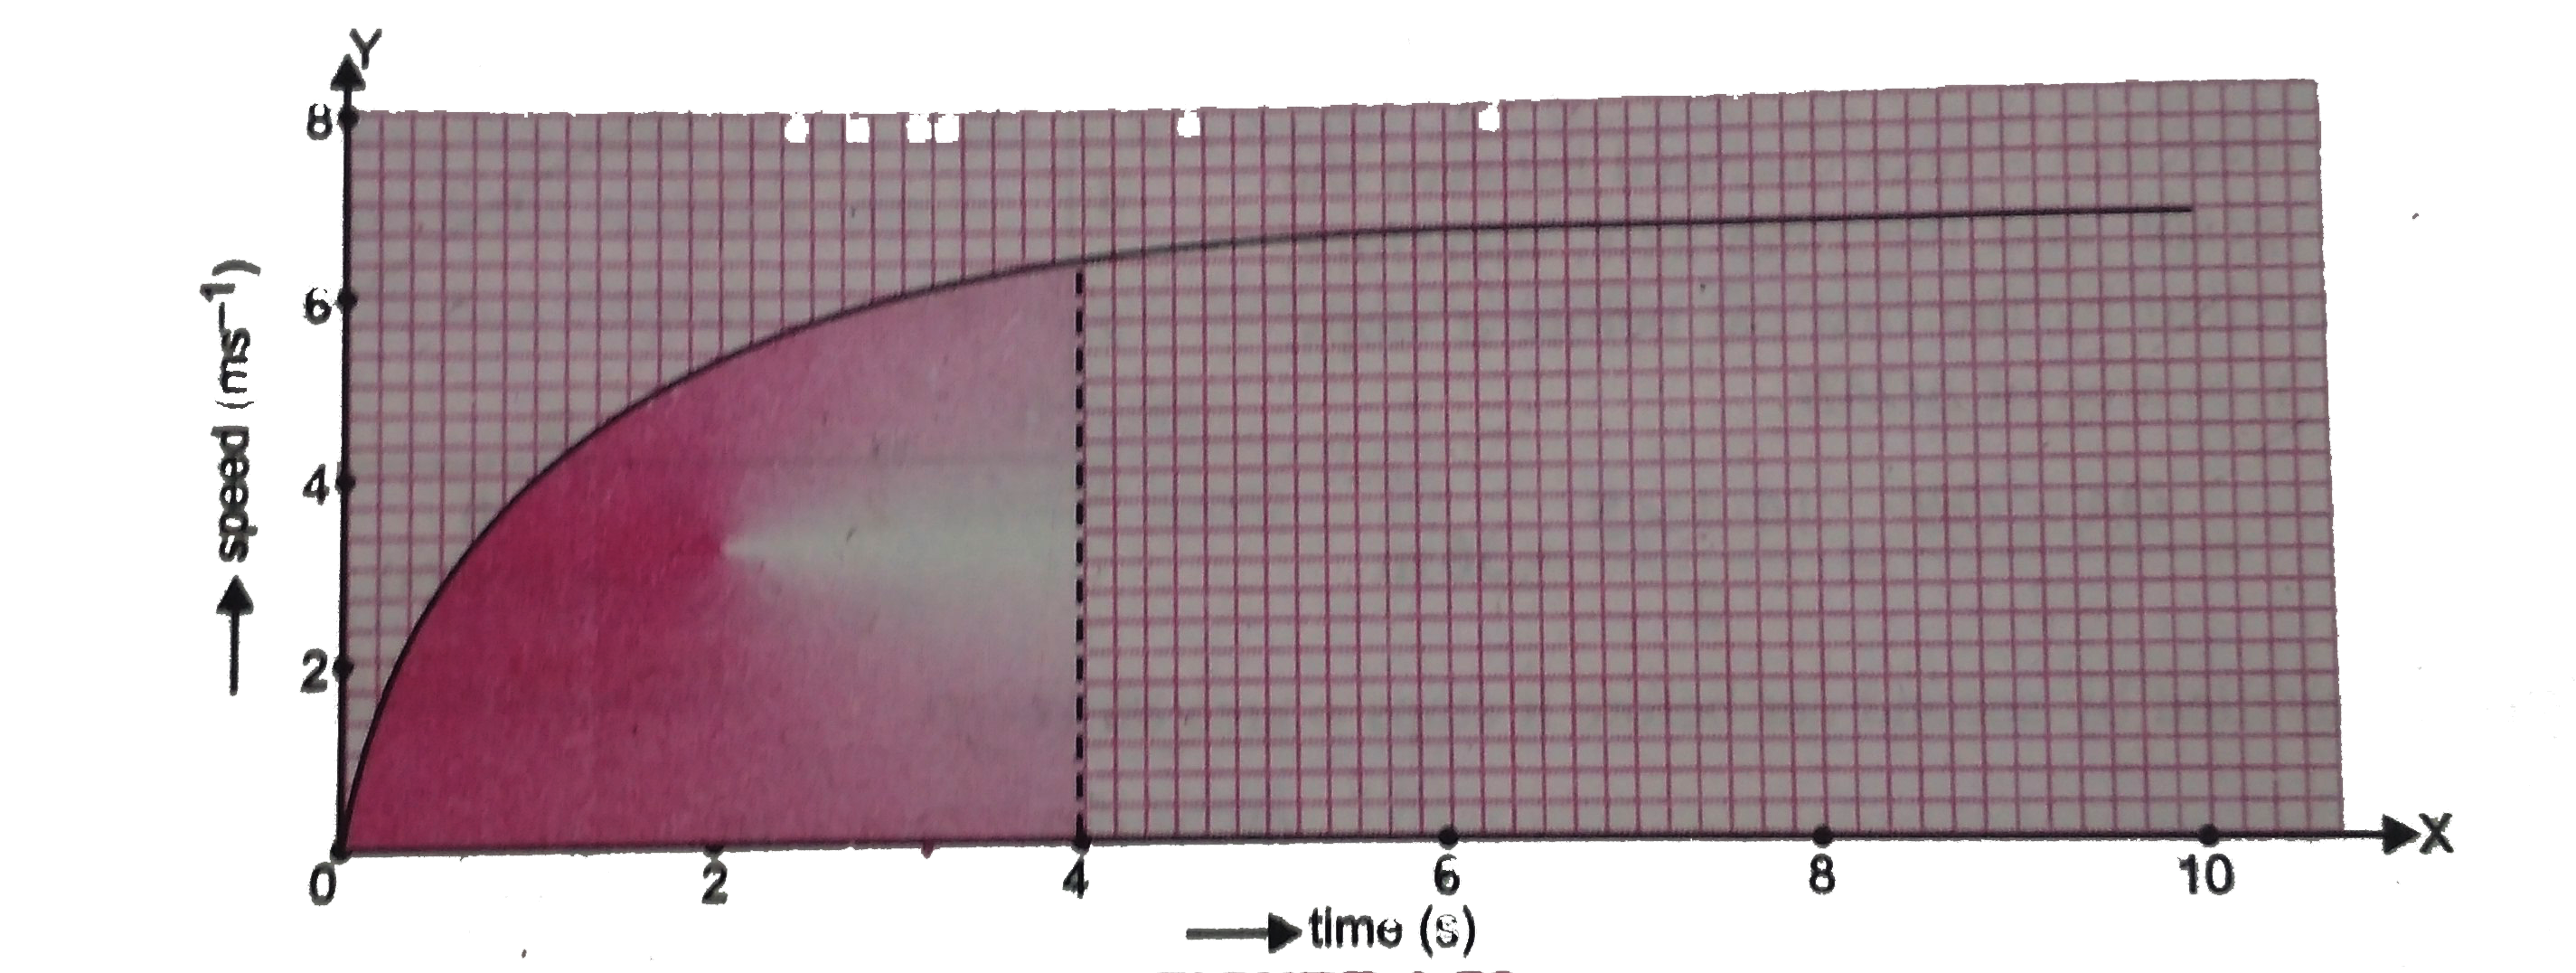
(a) Find how far does the car travel in the first 4 seconds. Shade the area on the graph that represents the distance travelled by the car during this period.
(b) Which part of the graph represents uniform motion of the car ?View Solution

