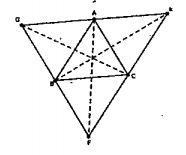
In the picture below, the lines parallel to each side of the blue triangle through the opposite vertex are drawn to make the big triangle.
How many triangles in the picture have the same area as that of the blue triangle.
 Solution in Malayalam
Step by step video & image solution for In the picture below, the lines parallel to each side of the blue triangle through the opposite vertex are drawn to make the big triangle. How many triangles in the picture have the same area as that of the blue triangle. by Maths experts to help you in doubts & scoring excellent marks in Class 9 exams.
Topper's Solved these Questions
Similar Questions
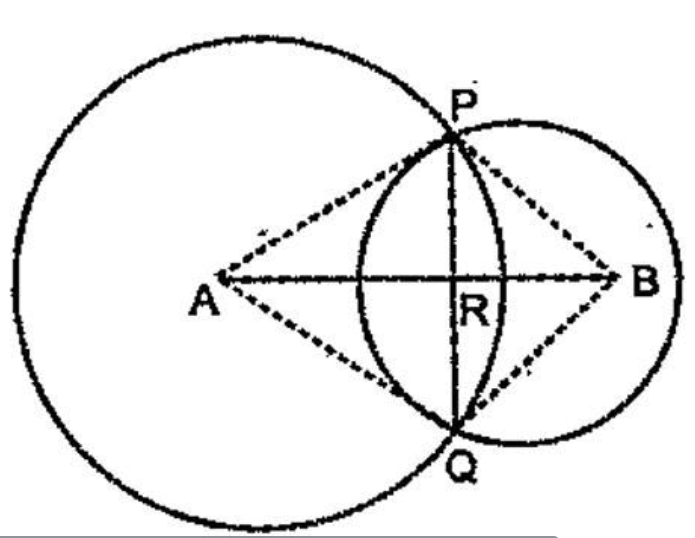
Prove that the line joining the centres of two intersecting circles is the perpendicular bisector of the line joining the points of intersection.
 01:37View Solution
How many lines of symmetry does the above figure have ?
02:11View SolutionDetermine the point of symmetry of a regular hexagon.
01:31View SolutionDtermine the images of the following figure about the given line :
02:04View SolutionIn the following figure ,ABCD is a parallelogram, CB is extended to F and the line joining D and F intersect AB at E. Then prove that ΔEAD~ΔEBF
02:45View SolutionMatch the following Column A to Column B
 02:17View Solution
Match the following Column A to Column B
 05:41View Solution
Match the following Column A to Column B
 03:28View Solution
Find the area of figure given below.
 04:08View Solution
Find the area of the paths each having a uniform width in the following rectangular field.
ltimg src="https://d10lpgp6xz60nq.cloudfront.net/physics_images/PS_MATH_VII_C06_S01_002_Q01.png" width="80%"gt02:31View SolutionFind the perimeter of the figure given below.
 02:21View Solution
Find the area of the figure given below.
 02:03View Solution
The area of the shaded part in the figure given below is ______.
 02:10View Solution
The inequation represented by the graph given below is :
02:17View SolutionThe inequation that best describes the graph given below is _________
02:10View SolutionThe inequation that best describes the following graph is _________
02:24View Solution

