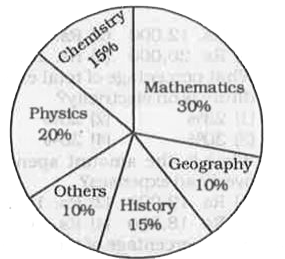
The following pie-chart shows the study time of different subjects of a students in a day. Study the piechart and answer the following questions.
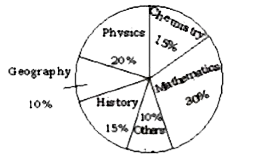
What is the angle subtended by geography and mathematics together at centre?
120∘
144∘
180∘
135∘
The correct Answer is:B
Step by step video & image solution for The following pie-chart shows the study time of different subjects of a students in a day. Study the piechart and answer the following questions. What is the angle subtended by geography and mathematics together at centre? by Maths experts to help you in doubts & scoring excellent marks in Class 14 exams.
Updated on:21/07/2023Topper's Solved these Questions
Similar Questions
The following pie-chart shows the study time of different subjects of a students in a day. Study the piechart and answer the following questions.
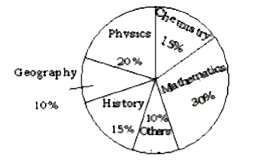
The time spent to study history and chemistry is 4 hours 30 minutes. then the student studied physics for how much time?
View SolutionThe following pie-chart shows the study time of different subjects of a students in a day. Study the piechart and answer the following questions
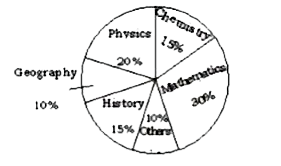
If the student studied chemistry for 3 hours, then he/she studied geography for how much time ?
View Solution
Knowledge Check
The following pie-chart shows the study-time of different subjects of a student in a day. Study the pie-chart and answer the following questions
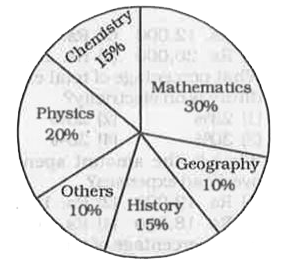
If the student studied 10 hours in a day, then he / she studied mathematics forA3 hoursB103 hoursC13 hoursD310 hoursThe following pie-chart shows the study-time of different subjects of a student in a day. Study the pie-chart and answer the following questions
The time spent to study history and chemistry is 4 hours 30 minutes, Then the student studied physics forA1 hour 30 minutesB2.9 hours (approx.)C2 hoursD3 hoursThe following pie-chart shows the study-time of different subjects of a student in a day. Study the pie-chart and answer the following questions
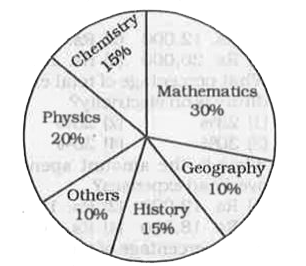
If the student studied chemistry for 3 hours, then he / she studied geography forA1 hourB2 hoursC1 hour and 30 minutesD2 hours and 30 minutes
The following pie-chart shows the number of students who failed in different subjects in an examination. Examine the chart and answer the following questions. The total number of students who have failed is 500.
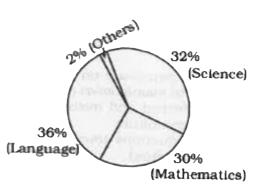
The central angle of the sector for the students who have failed in mathematics is :
View SolutionStudy the pie-chart and answer the questions.
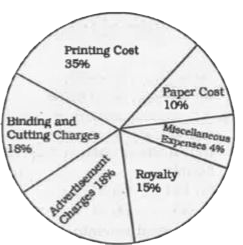
The central angle for the sector on "Paper-Cost" is
View SolutionThe following pie-chart shows the study-time of different subjects of a student in a day. Study the pie-chart and answer the following questions
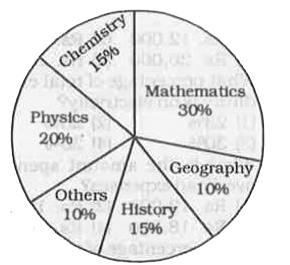
Instead of 10%, if the student spends 15% of study other subjects and the time is taken from the time scheduled to study mathematics and if he / she used to study 20 hours per day, then the difference of time for studying mathematics per day is :
View SolutionThe pie chart shows the breakup of expenditure of a software company for the year 2017. Study the diagram and answer the following questions.
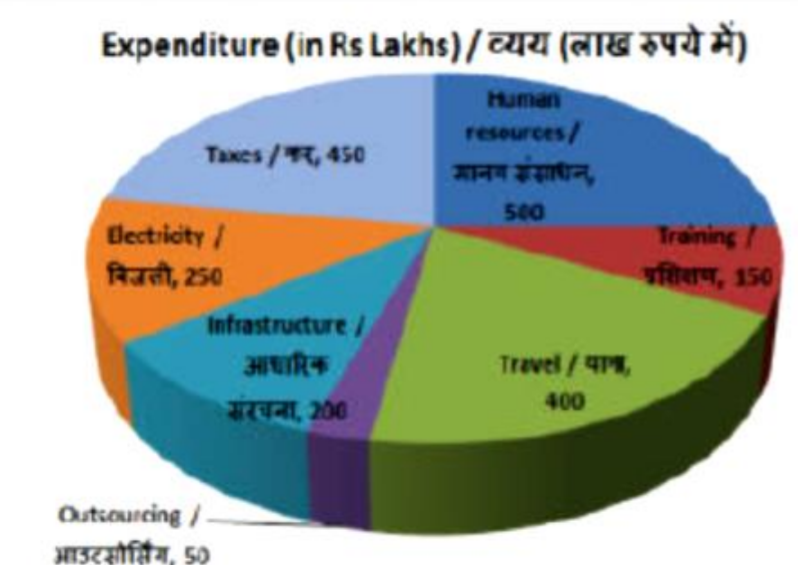
What is the total expenditure (in Rs lakhs)?
View SolutionThe pie chart shows the breakup of expenditure of a college for the year 2017. Study the diagram and answer the following questions.
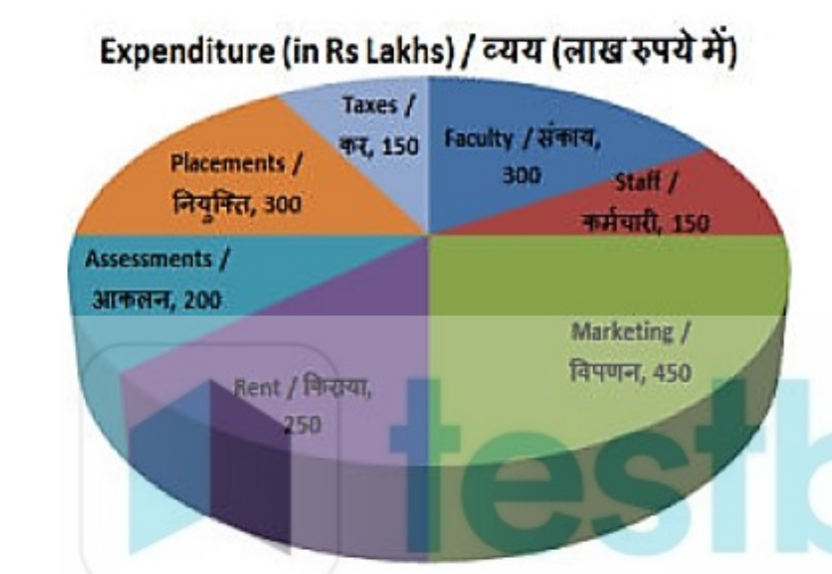
What is the total expenditure (in Rs lakhs)?
View Solution
