What is the use of the indicator diagram or PV diagram?
Step-by-Step Solution:
1. Understanding the PV Diagram:
- The PV diagram, also known as the indicator diagram, is a graphical representation that plots pressure (P) on the y-axis and volume (V) on the x-axis.
2. Purpose of the PV Diagram:
- The primary use of the PV diagram is to illustrate how pressure changes with respect to volume during a thermodynamic process. This helps in visualizing the relationship between these two variables.
3. Analyzing Processes:
- The diagram can represent various thermodynamic processes, such as isothermal (constant temperature), adiabatic (no heat exchange), isobaric (constant pressure), and isochoric (constant volume) processes. Each process will have a distinct shape on the diagram.
4. Identifying Work Done:
- The area under the curve in the PV diagram represents the work done by or on the system during the process. This is a crucial aspect of thermodynamics, as it allows us to quantify energy transfer.
5. Cycles Representation:
- The PV diagram can also represent cyclic processes, where the system returns to its initial state after completing a series of changes. The area enclosed by the cycle on the diagram indicates the net work done over one complete cycle.
6. Practical Applications:
- Engineers and scientists use the PV diagram to analyze the performance of engines, refrigerators, and other thermodynamic systems. It helps in optimizing designs and understanding efficiency.
Summary:
The PV diagram is a vital tool in thermodynamics that illustrates the relationship between pressure and volume, identifies work done during processes, and represents various thermodynamic cycles.
---
- The PV diagram, also known as the indicator diagram, is a graphical representation that plots pressure (P) on the y-axis and volume (V) on the x-axis.
- The primary use of the PV diagram is to illustrate how pressure changes with respect to volume during a thermodynamic process. This helps in visualizing the relationship between these two variables.
- The diagram can represent various thermodynamic processes, such as isothermal (constant temperature), adiabatic (no heat exchange), isobaric (constant pressure), and isochoric (constant volume) processes. Each process will have a distinct shape on the diagram.
- The area under the curve in the PV diagram represents the work done by or on the system during the process. This is a crucial aspect of thermodynamics, as it allows us to quantify energy transfer.
- The PV diagram can also represent cyclic processes, where the system returns to its initial state after completing a series of changes. The area enclosed by the cycle on the diagram indicates the net work done over one complete cycle.
- Engineers and scientists use the PV diagram to analyze the performance of engines, refrigerators, and other thermodynamic systems. It helps in optimizing designs and understanding efficiency.
The PV diagram is a vital tool in thermodynamics that illustrates the relationship between pressure and volume, identifies work done during processes, and represents various thermodynamic cycles.
Topper's Solved these Questions
- BOOK - ICSECHAPTER - INTERNAL ENERGY EXERCISE - LONG ANSWER QUESTIONS8videos
INTERNAL ENERGY
- BOOK - ICSECHAPTER - INTERNAL ENERGY EXERCISE - SHORT ANSWER QUESTIONS30videos
INTERNAL ENERGY
- BOOK - ICSECHAPTER - INTERNAL ENERGY EXERCISE - ADDITIONAL SOLVED PROBLEMS12videos
INTERNAL ENERGY
- BOOK - ICSECHAPTER - GRAVITATIONEXERCISE - FROM THE HUBBLE TELESCOP2videos
GRAVITATION
- BOOK - ICSECHAPTER - MOTION IN FLUIDS EXERCISE - SELECTED PROBLEMS (FROM POISEUILLE.S FORMULA)19videos
MOTION IN FLUIDS
Similar Questions
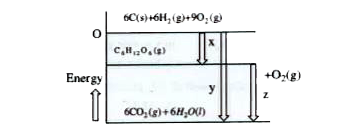
Consider the following energy level diagram:

Answer the following question on the basis of the given diagram
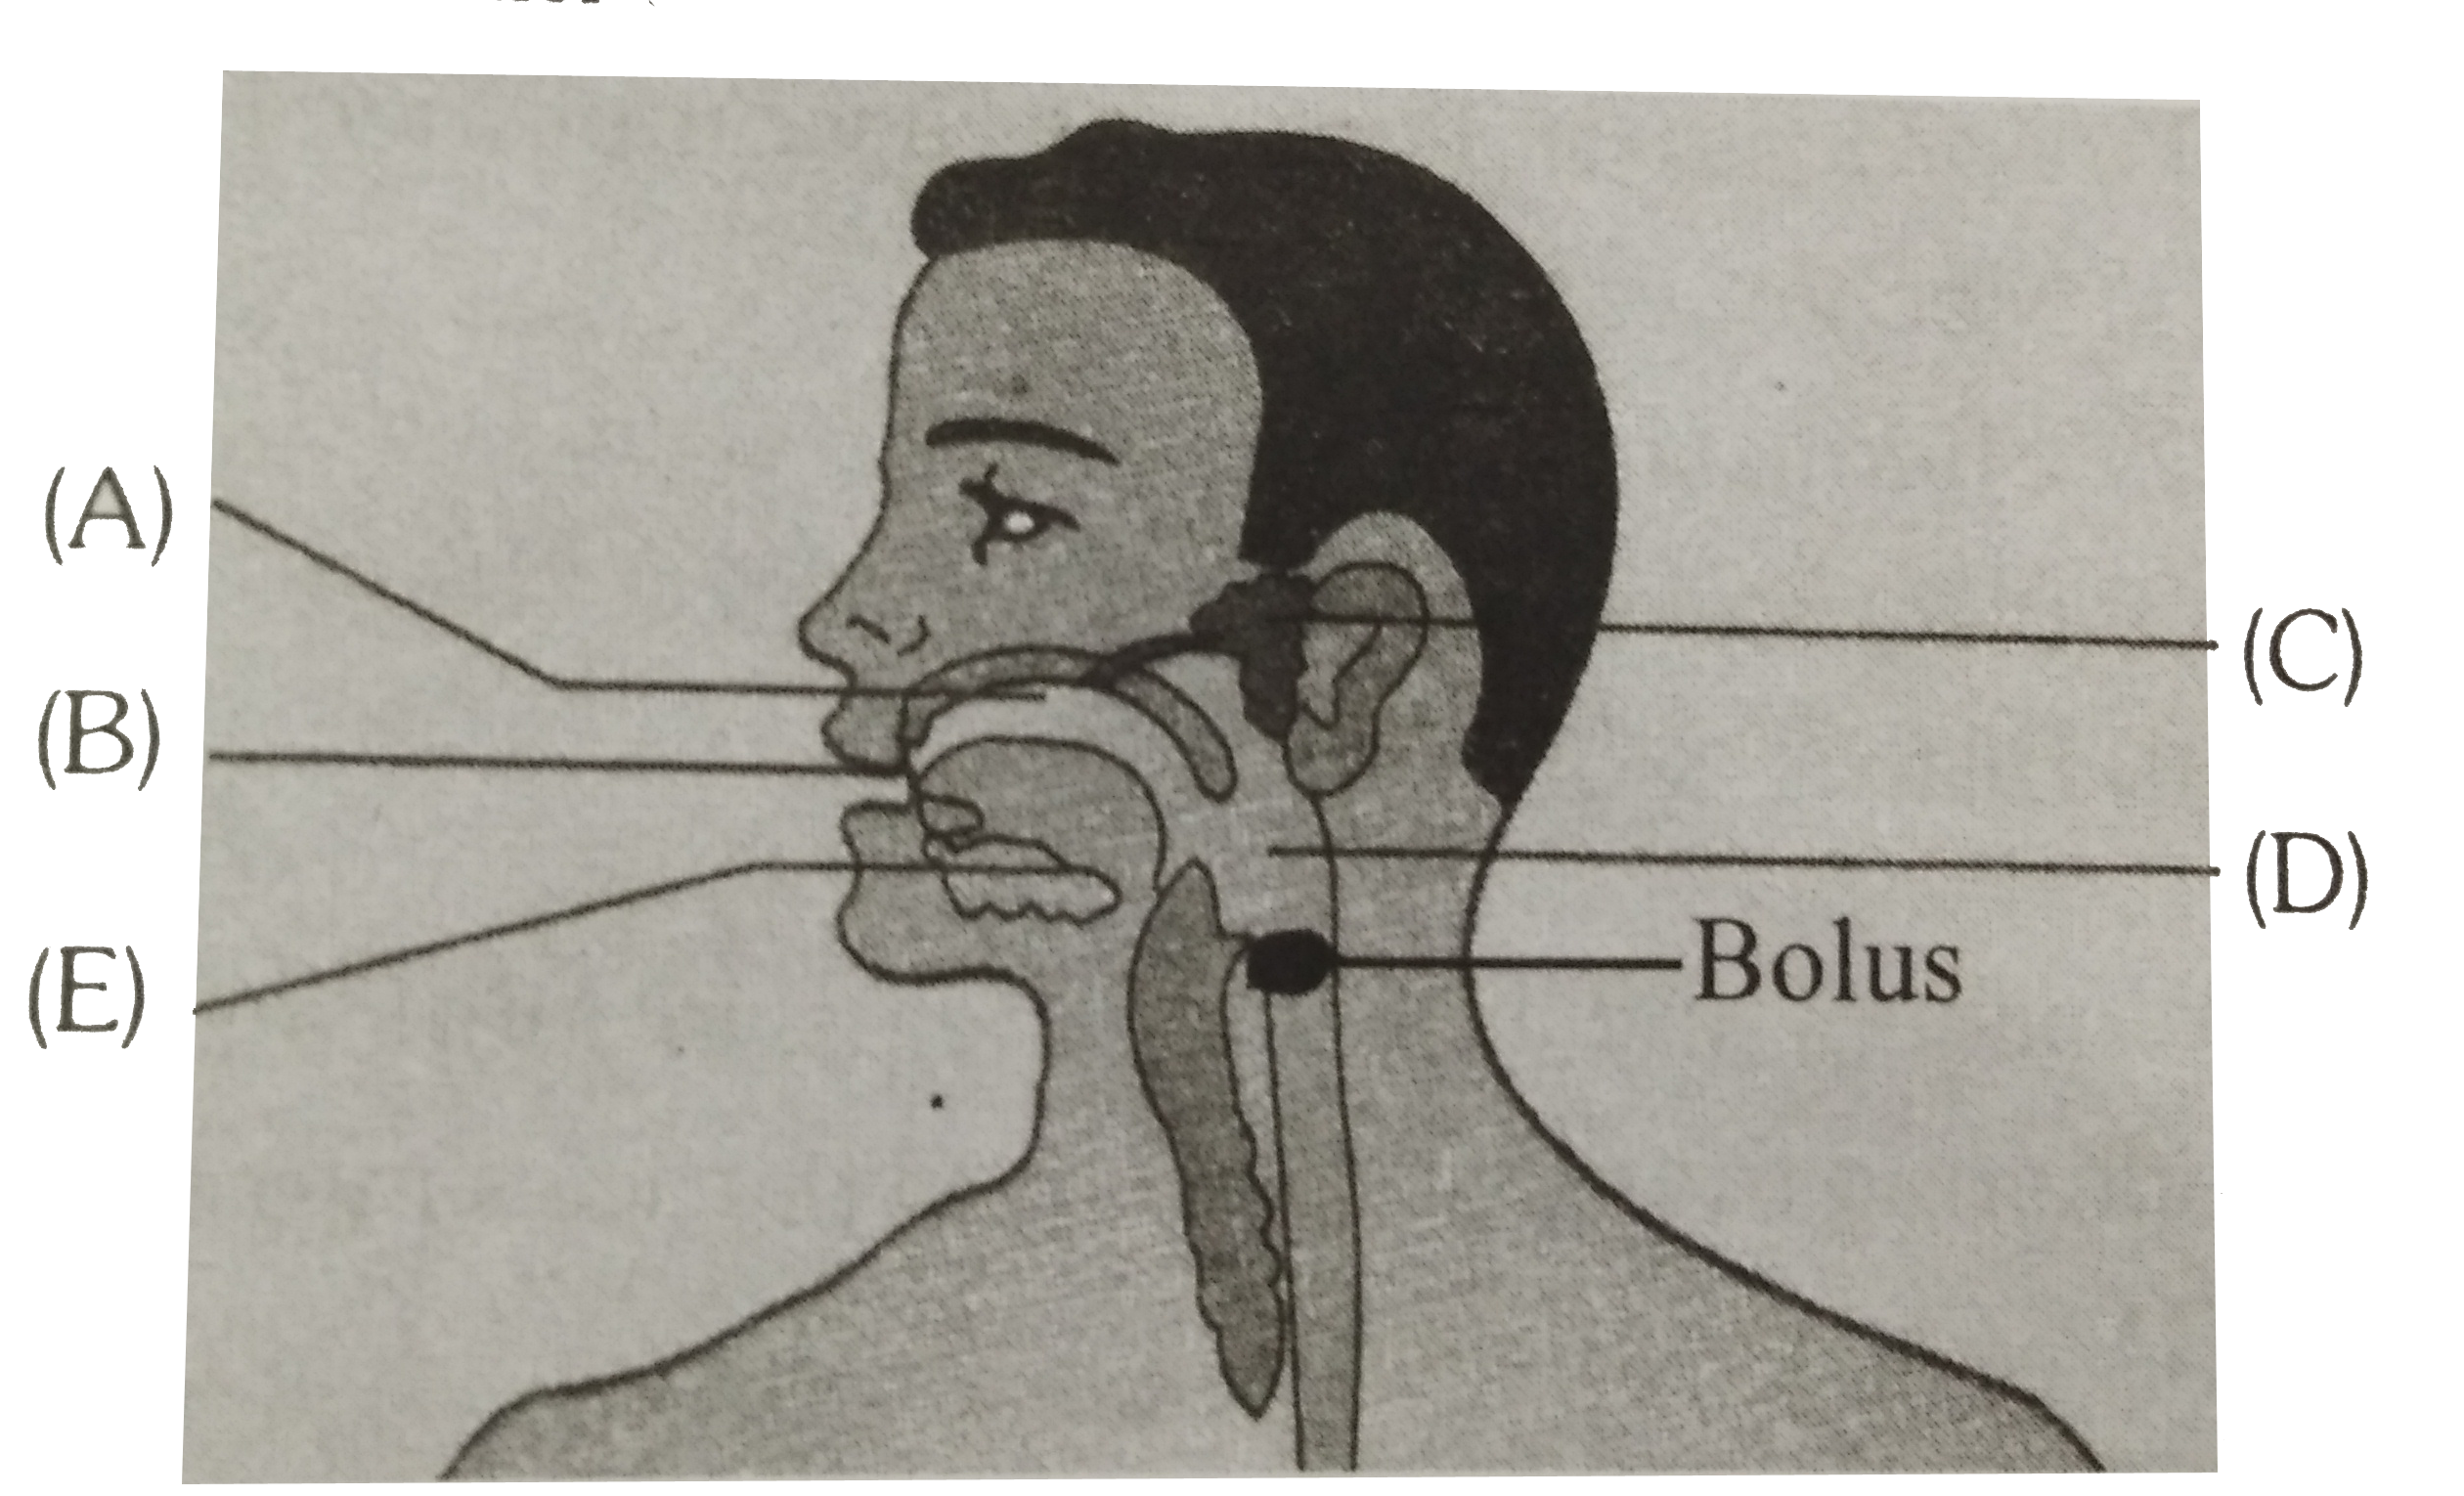
In the given diagram z refers toView SolutionWhat is shown in the given diagram ?
 View Solution
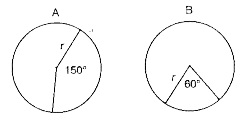
What is the ratio of the areas of the major sector in diagram A to the minor sector in a diagram B?
 View Solution
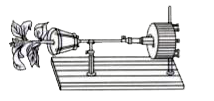
The diagram given below is an instrument which is used to eliminate the effect of gravity

What is the use of this instrument in this experiment?View SolutionWhat is Ellingham diagram?
View SolutionWhat is Ellingham diagram?
View SolutionWhat is Ellingham diagram?
View SolutionIn which of the following indicator diagrams gives below do AB,BC, and CA represent isothermal, isochroic, and adiabatic changes, respectively?
View SolutionThat type of crystal defect is indicated in the diagram below
 View Solution
What is prism? With the help of a diagram of the principal section of a prism, indicate its refracting surface, refracting edge and base.
View Solution

