Introduction|| Collection OF Data||Primary and Secondary Data|| classes|| Class interval|| Class size ( range )|| Presentation OF Group data & Single data ( ungrouped data )||Tally mark||Frequency distribution table
Step by step video solution for Introduction|| Collection OF Data||Primary and Secondary Data|| classes|| Class interval|| Class size ( range )|| Presentation OF Group data & Single data ( ungrouped data )||Tally mark||Frequency distribution table by Maths experts to help you in doubts & scoring excellent marks in Class 9 exams.
Updated on:21/07/2023समान प्रश्न
ज्ञान जांच
For a given data, frequency 5 is represented in tally mark as
A/////Bcancel("////")C D
D
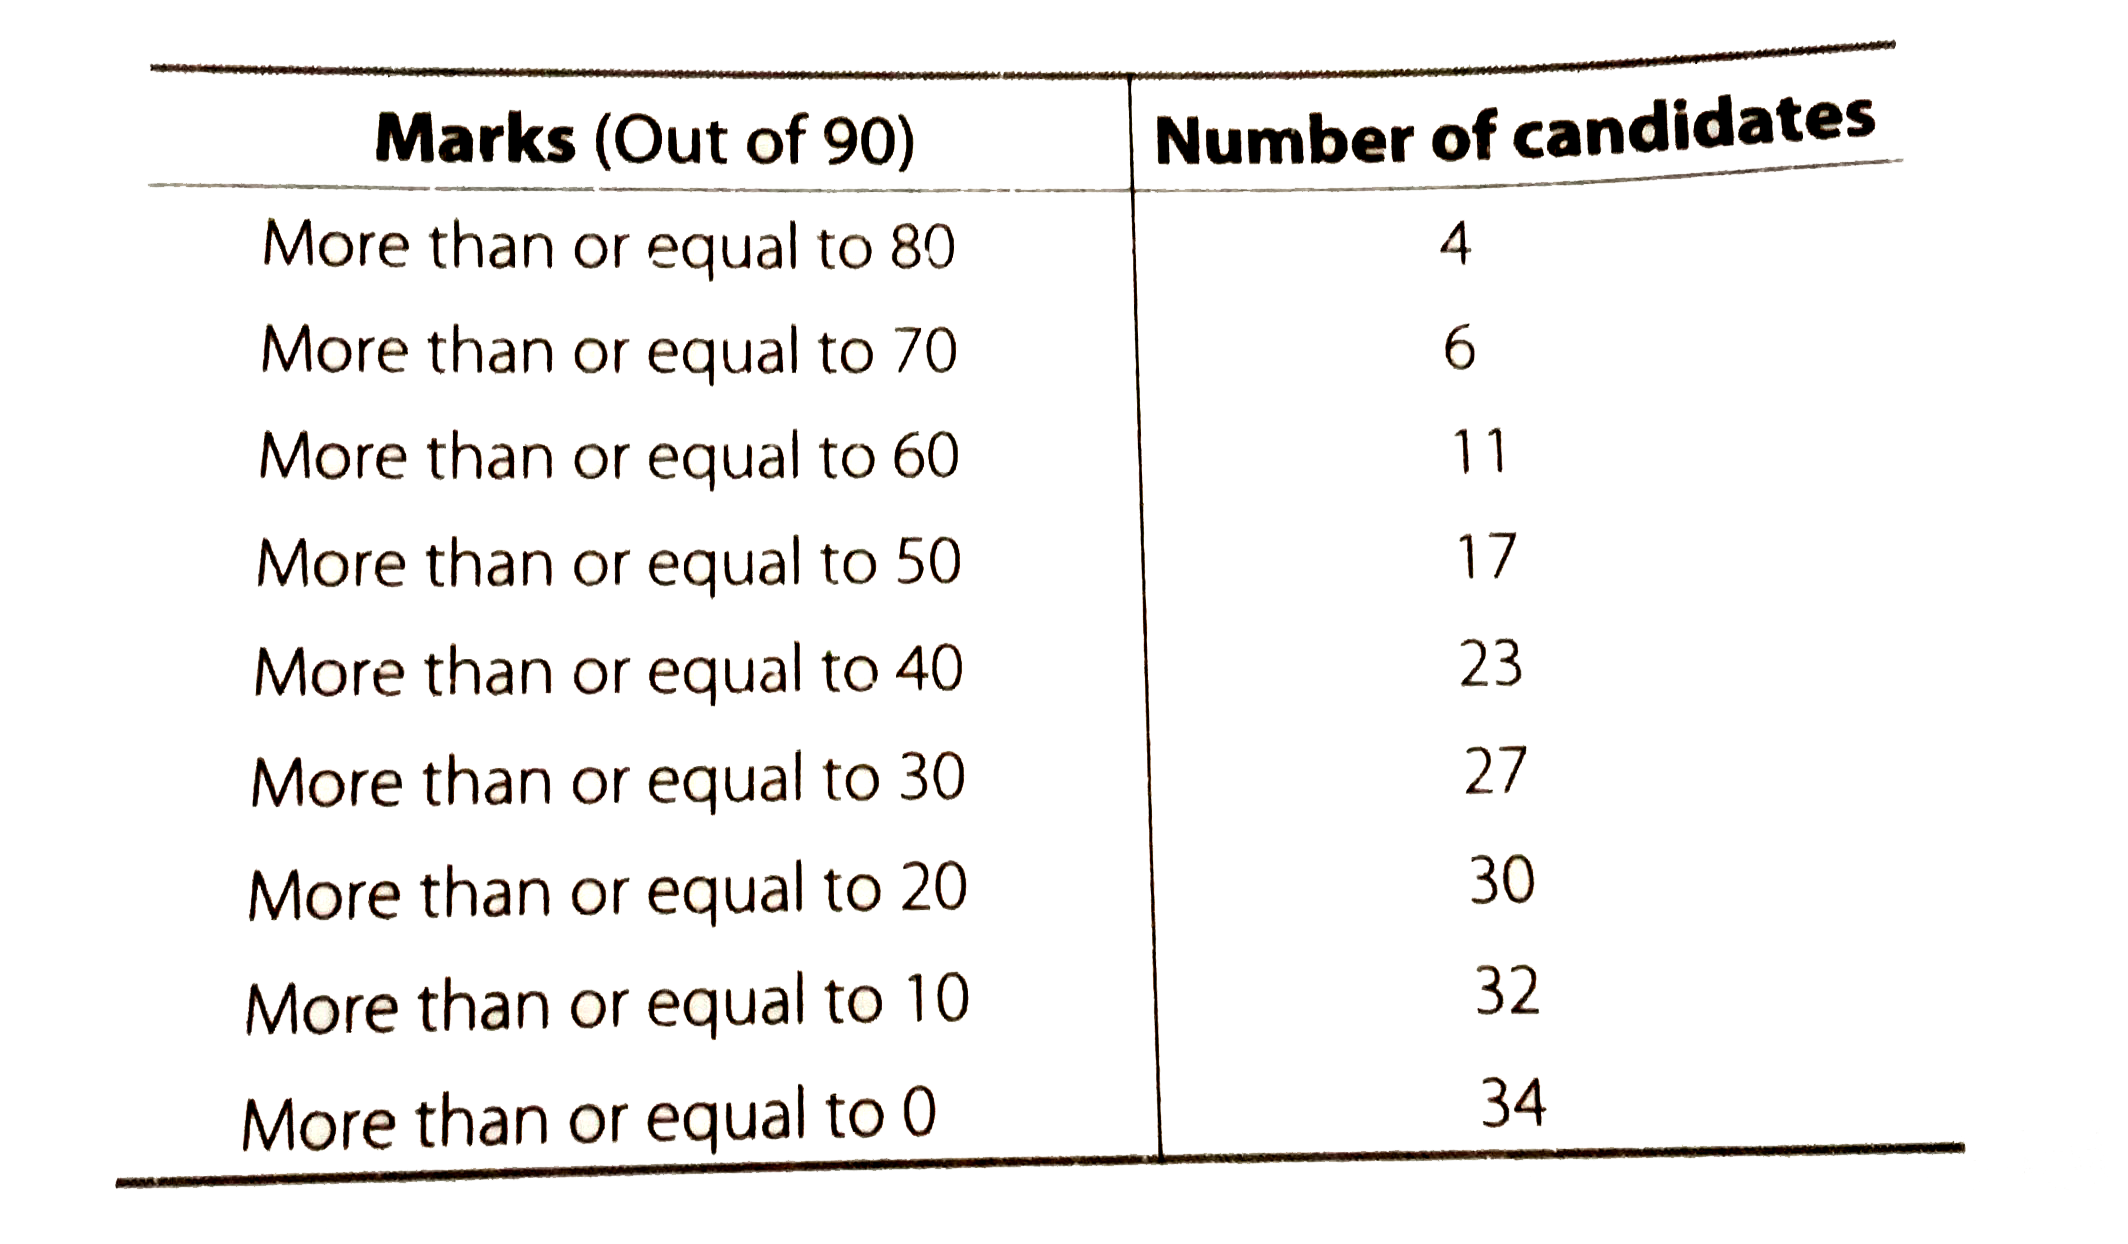
Write the following data into less than cummulative frequency distribution table.

View SolutionIntroduction|Data|Collection Of Data|Types Of Data|Statistics|Presentation Of Data|OMR
View SolutionDifferentiate between primary and secondary data.
View SolutionFrom the frequency distribution table from the following data

View SolutionIntroduction|Data|Collection Of Data|Types Of Data|Presentation Of Data|Statistics|Measure Of Central Tendency|Mean Of Ungrouped Data|Mean Of Grouped Data|Methods To Find Mean Of Grouped Data|Question (Direct Method)|OMR
View SolutionIntroduction|Types Of Data|Collecting Of Data|Organization Of Data|Representative Value|Central Tendency|OMR
View SolutionMean Of Grouped Data (With Class Intervals)|Practice Problems
View Solution
