Prepare a continuous grouped frequency distribution from the following data
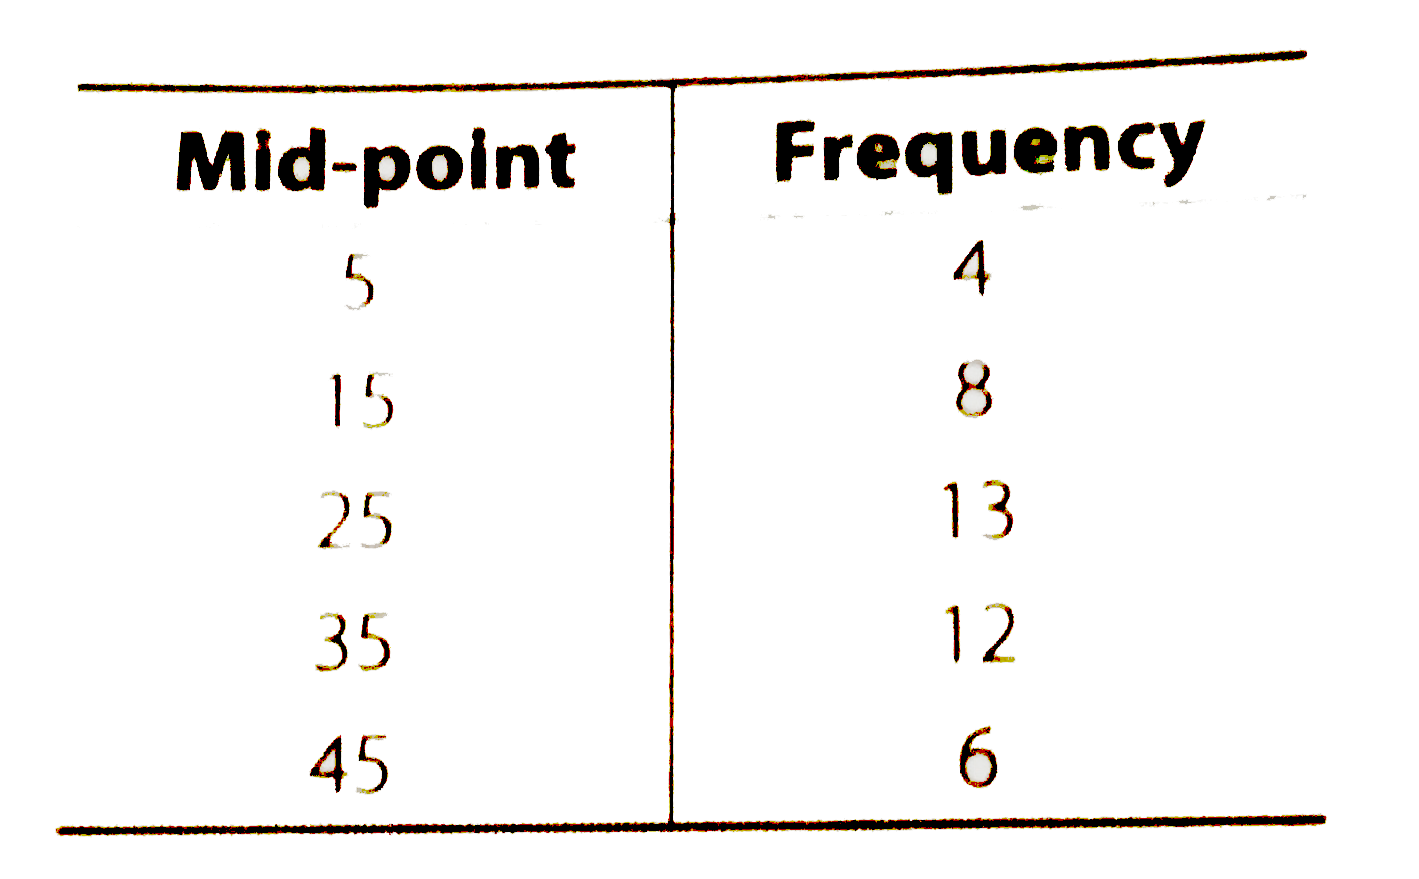
Also, find the size of class intervals.
Here, we see that the difference between two mid-points is 15-5 i.e., 10.
It means the width of the class interval is 10.
Let the lower limit of the first class interval be a.
Then, its upper limit =a+10
Now, mid value of the first class interval =5
⇒Mid value=Lower limit+Upper limit2
⇒5=a+a+102⇒2a+10=10
⇒2a=0⇒a=0
So, the first class interval is 0-10.
Now, we prepare a continous grouped frequency distribution table is given below
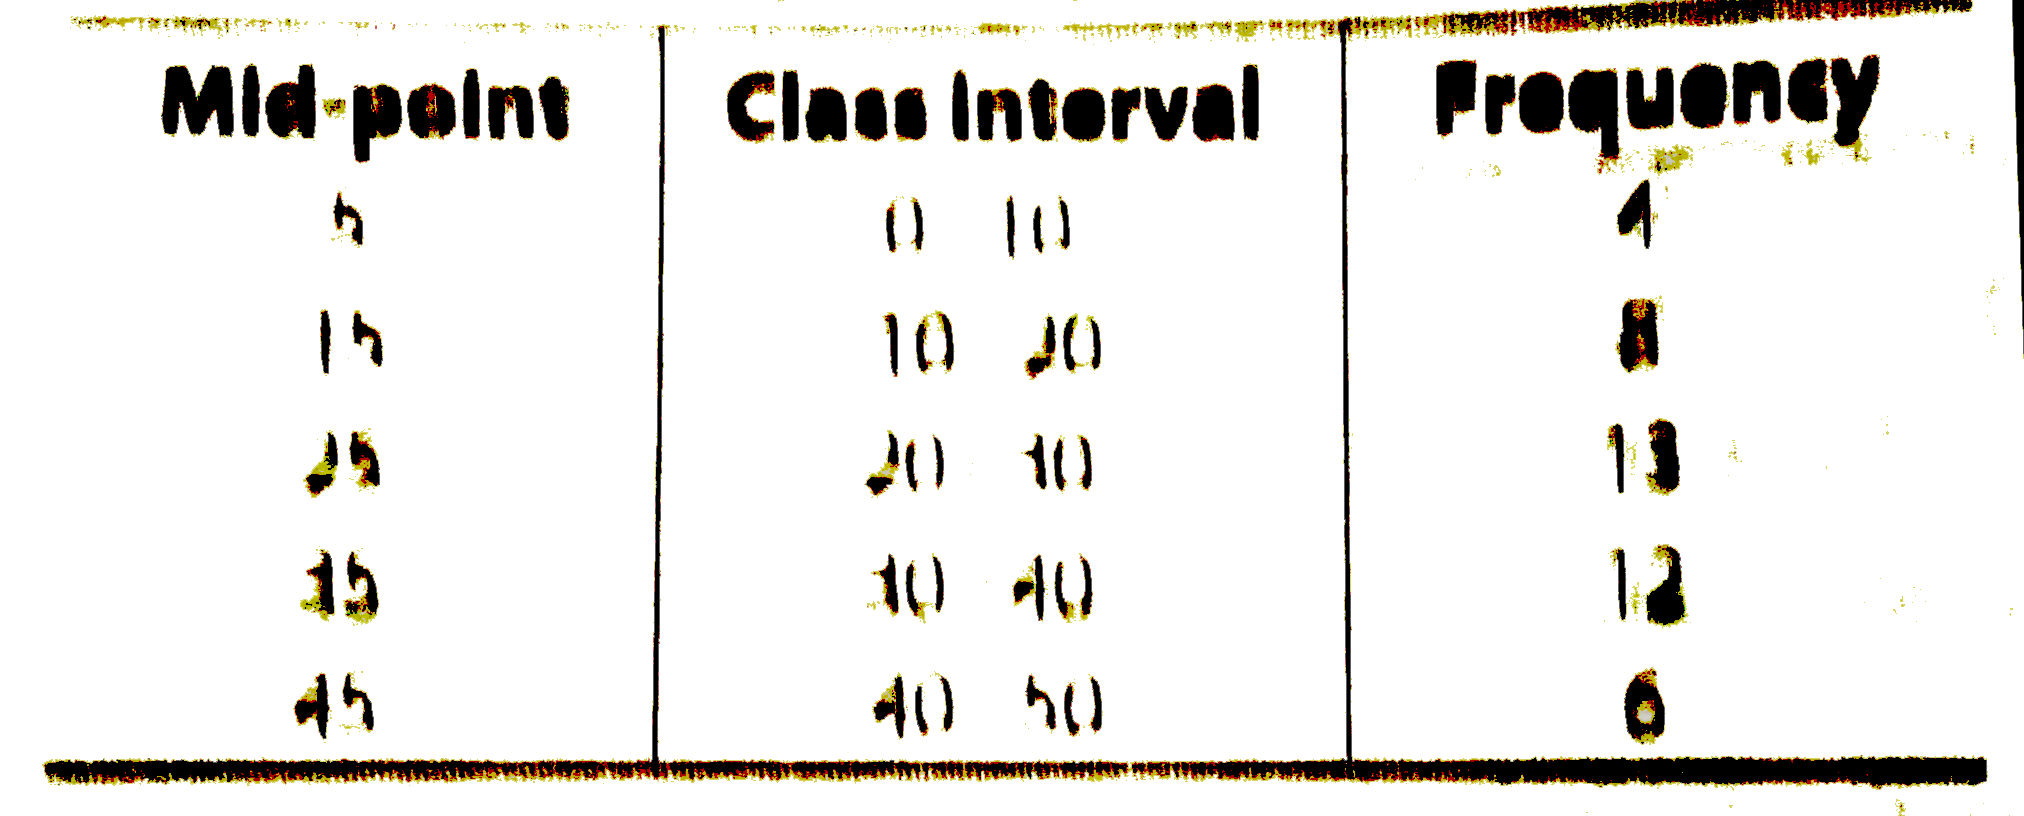
Hence, the size of the class interval is 10 i.e., 10-0.
Topper's Solved these Questions
- BOOK - NCERT EXEMPLAR ENGLISHCHAPTER - STATISTICS AND PROBABILITYEXERCISE - LONG ANSWER TYPE QUESTIONS12videos
STATISTICS AND PROBABILITY
- BOOK - NCERT EXEMPLAR ENGLISHCHAPTER - STATISTICS AND PROBABILITYEXERCISE - VERY SHORT ANSWER TYPES QUESTIONS10videos
STATISTICS AND PROBABILITY
- BOOK - NCERT EXEMPLAR ENGLISHCHAPTER - QUADRILATERALS EXERCISE - LONG ANSWER TYPE QUESTIONS18videos
QUADRILATERALS
- BOOK - NCERT EXEMPLAR ENGLISHCHAPTER - TRIANGLESEXERCISE - LONG ANSWER TYPE QUESTIONS21videos
TRIANGLES
Similar Questions
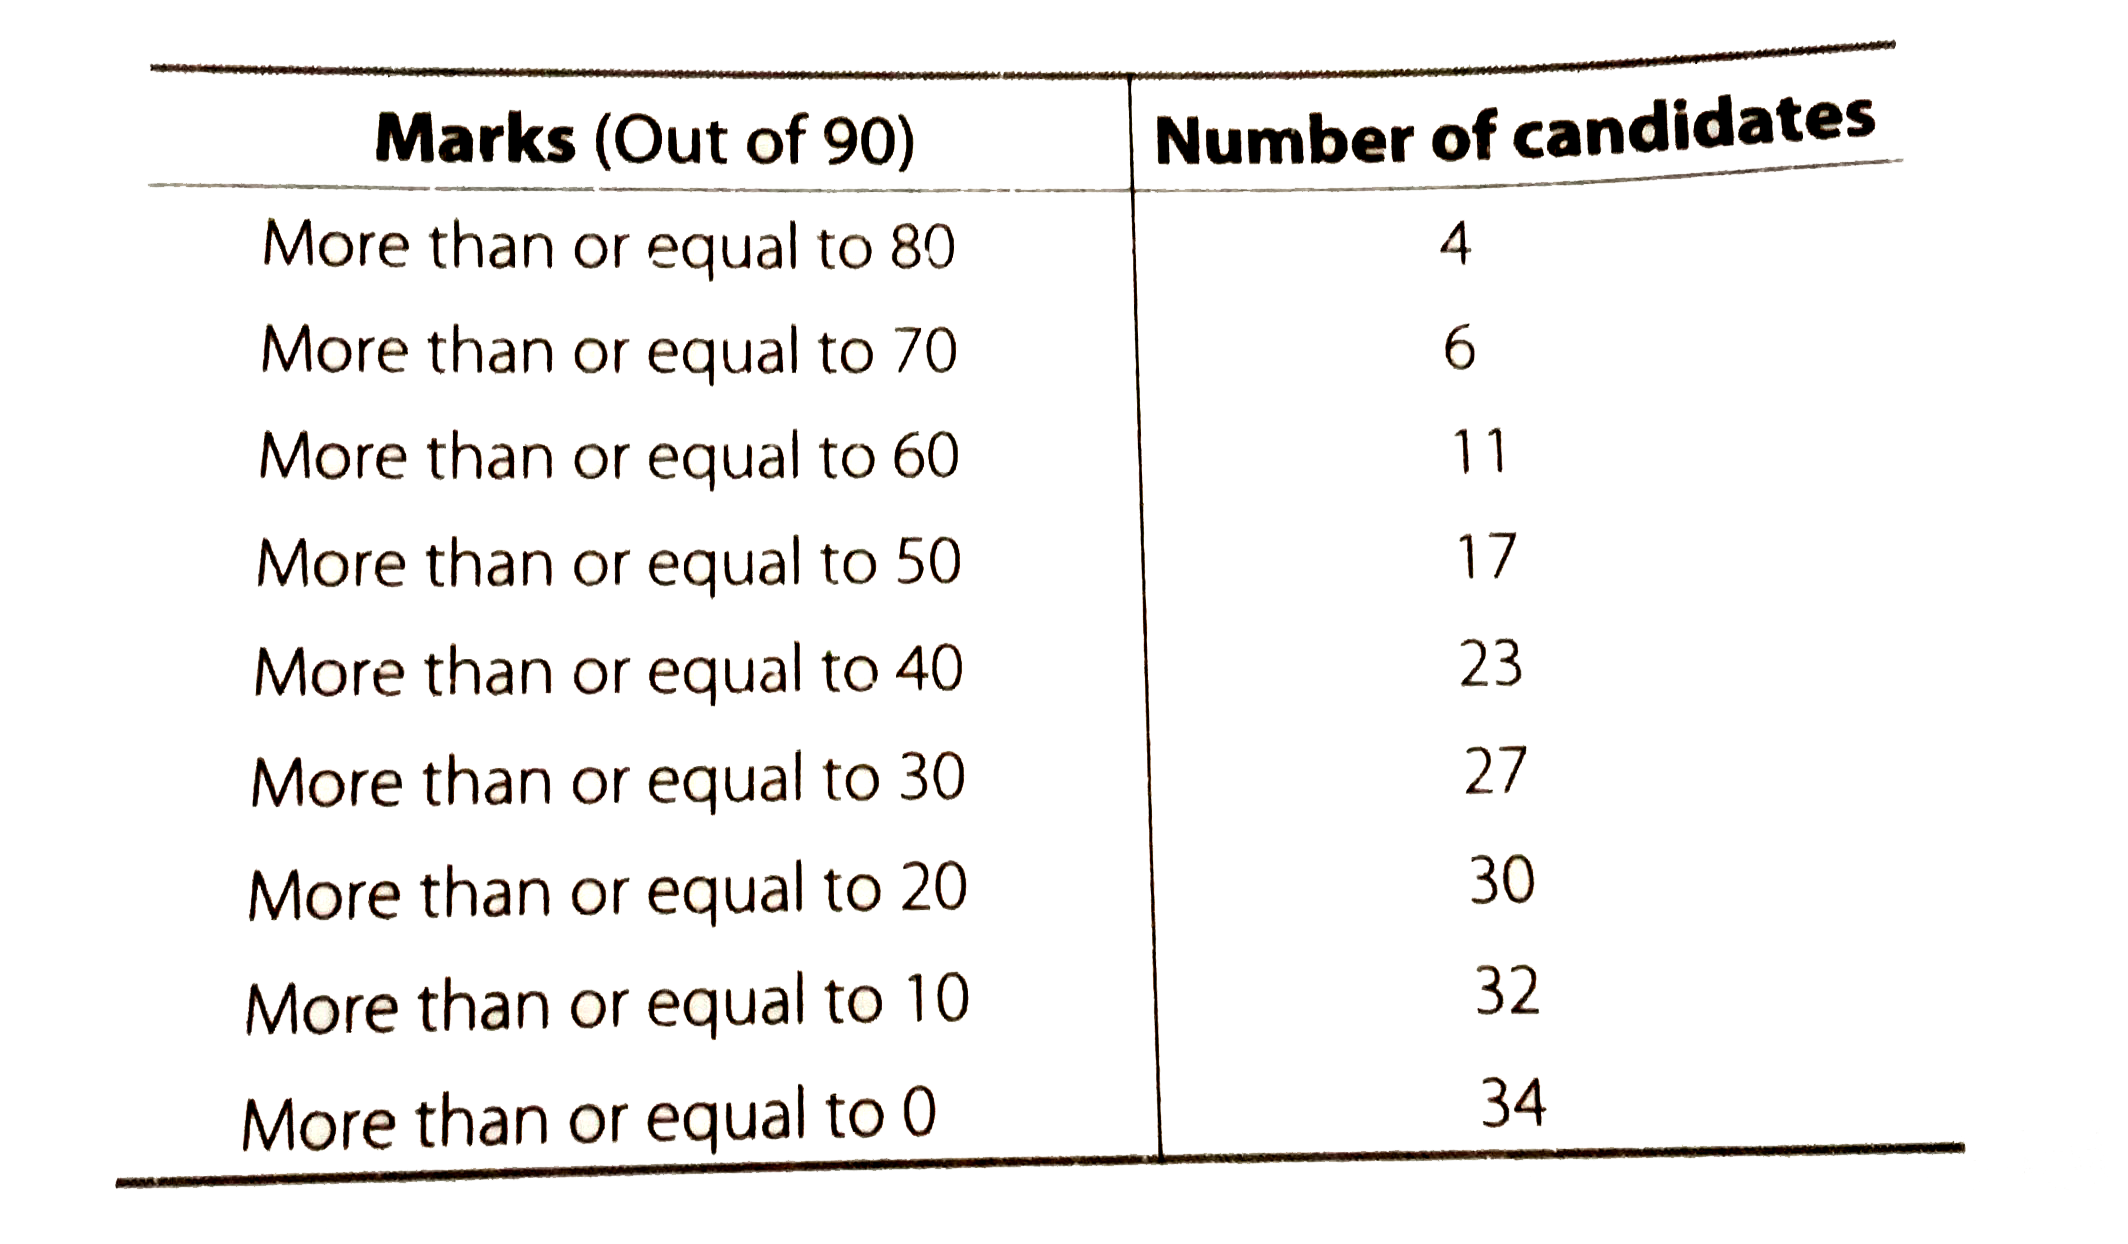
From the frequency distribution table from the following data
 View Solution
Draw a frequency polygon from the following data:
 View Solution
Draw a histogram and frequency polygon from the following data:
 View Solution
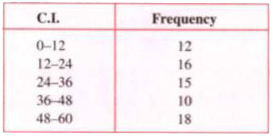
Contruct a cumulative frequency distributions table from the following frequency table:
 View Solution
Contruct a cumulative frequency distributions table from the following frequency table:
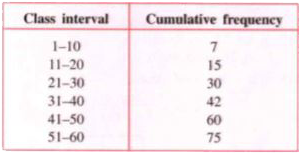 View Solution
The following are weights (in kg) of 50 children taken at the time of birth:

Make an inclusive form grouped frequency distribution table with 0.3 kg as the width of ' each class.
Also, find the true class limits of each class.View SolutionFor drawing a frequency polygon of a continuous frequency distribution, we plot the points whose ordinates are the frequencies of the respecitve classes and abscissae are, respectively
View SolutionConstruct a frequency distributions table from the following cumulatvive frequency table.
Class interval Cumulative Frequency 0−91510−192320−293830−395640−496850−5990View SolutionThe distance (in km) of 40 engineers from their residence to their place of work were found as follows.

Construct a grouped frequency distribution table with calss- size 5 for the data given above taking the first interval as 0-5 (5 not included).View SolutionA study was conducted to find out the concentration of sulphur dioxide in the air in parts per million (ppm) of a certain city. The data obtained for 30 days is a follows :

(i) Make a grouped frequency distribution table for this data with class-intervals as 0.00−0.04,0.04−0.08 and so on.
(ii) For how many day's was the concentration of sulphar dioxide more than 0.11 parts per million (ppm)?View Solution

