Tables, charts, graphs are useful in .....Solution in Telugu
Hypothesis
Experiment
Displaying data
Observing
Step by step video & image solution for Tables, charts, graphs are useful in ..... by Biology experts to help you in doubts & scoring excellent marks in Class 8 exams.
Updated on:21/07/2023Topper's Solved these Questions
Similar Questions
How is adolescence different from childhood?
View SolutionA doctor/nurse/health-worker is exposed to more sick people than others in the community. Find out how she/he avoids getting sick herself/himself. ( AS 1)
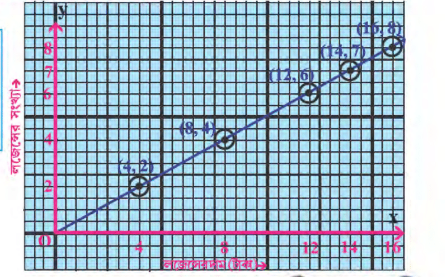
View Solutionছক কাগজের লেখচিত্রটি দেখে নীচের প্রশ্নটির উত্তর দাও | ছক কাগজের লেখচিত্রটি কোন বিষয়ের লেখো |

View Solutionনীচের ছকের তথ্যগুলির লেখচিত্র ছক কাগজে তৈরি করো ও লেখচিত্র রৈখিক কিনা দেখো |

View Solutionনীচের ছকের তথ্যগুলির লেখচিত্র ছক কাগজে তৈরি করো ও লেখচিত্র রৈখিক কিনা দেখো |

View Solutionনীচের ছকের তথ্যগুলির লেখচিত্র ছক কাগজে তৈরি করো ও লেখচিত্র রৈখিক কিনা দেখো |

View Solutionনীচের ছকের তথ্যগুলির লেখচিত্র ছক কাগজে তৈরি করো ও লেখচিত্র রৈখিক কিনা দেখো |

View Solutionনীচের ছকের তথ্যগুলির লেখচিত্র ছক কাগজে তৈরি করো ও লেখচিত্র রৈখিক কিনা দেখো |

View Solutionउपयुक्त पैमाने का प्रयोग करते हुए, निम्न तालिकाओं में दी गई राशियों के लिए आलेख बनाइए:

View SolutionBananas given using the following table. Draw the graph of the number of dozen and their value.
View SolutionDays of snow in a city:

Use the table to draw the graph.
View SolutionDraw a bar graph using the data given in the following table.
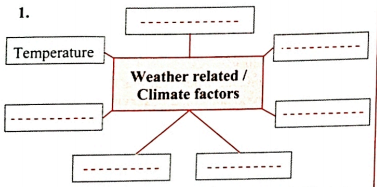
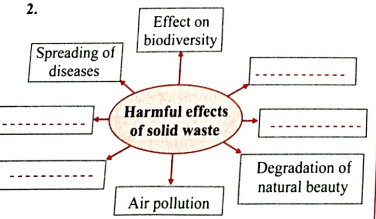
View SolutionComplete the given chart/table.

View SolutionComplete the given chart/table.

View SolutionComplete the given chart/table Complete the given flow chart.
View Solution
