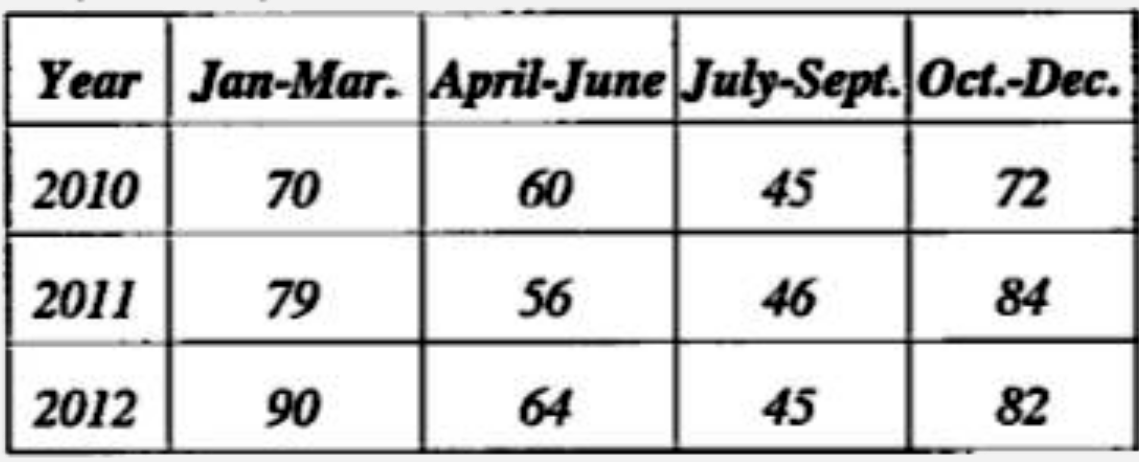
The following is a record of the rquarterly electrickty bill for 3 years for a household (to the nearest Rupees):

Plot these and four quarterly moving averages.
The correct Answer is:Trend values are 81.5, 89.5, 89.75, 89.75, 87.75, 86.38, 93.75, 101.75, 112.25
Topper's Solved these Questions
- MODEL TEST PAPER -3BOOK - ICSECHAPTER - MODEL TEST PAPER -3EXERCISE - Section A
21 Videos
- MODEL TEST PAPER -3BOOK - ICSECHAPTER - MODEL TEST PAPER -3EXERCISE - Section B
7 Videos
- MODEL TEST PAPER -3BOOK - ICSECHAPTER - MODEL TEST PAPER -3EXERCISE - SECTION -B
10 Videos
- MODEL TEST PAPER -2BOOK - ICSECHAPTER - MODEL TEST PAPER -2EXERCISE - Section C
8 Videos
- MODEL TEST PAPER -4BOOK - ICSECHAPTER - MODEL TEST PAPER -4EXERCISE - SECTION -C
10 Videos
Similar Questions
The table below gives details of the electricity generated in kilowatt hours in each quarter for the years 2012 to 2014

Calculate the four-quarterly moving averages and display these and the original figures on the same graph .
View SolutionThe number of road accidents in the city due to rash driving over a period of 3 years, is given in the following table :
Calculate four quarterly moving averages and illustrate them and original figures on one graph using the same axes for both.
View Solution
Knowledge Check
The following questions are based on the diagram given below showing four persons stationed at the four corners of a square piece of plot as shown.
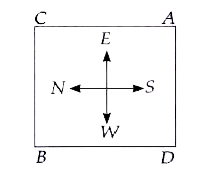
From the original position B and D move one and a half length of sides clockwise and anti-clockwise respectively. Which one of the following statements is true?AB and D are both at the midpoint between A and CBD is at the midpoint between A and C, and B at the comer originally occupied by CCB is at the midpoint between A and C, and D at the midpoint between original positions of Band CDB and Dare both at the midpoint between A and DStudy the following table and answer the questions based on it Below is the Household Expenditure (in Thousand Rupees) per annum.
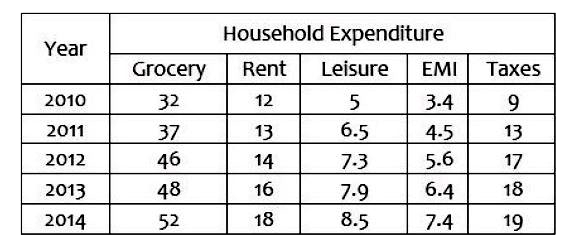
What is the average spending on Leisure per annum ?
A. Rs. 7,040
B. Rs. 6,500
C. Rs. 7,100
D. Rs. 7,400ABBCCADD
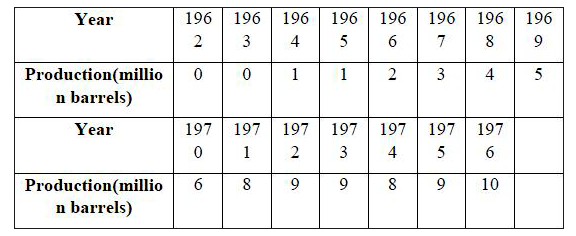
The following table shows the production of gasoline in U.S.A. for the years 1962 to 1976. Obtain trend values for the above data using 5-yearly moving averages.
View SolutionThe profits of a paper bag manufacturing company (in lakhs of rupees) during each month of a year are :
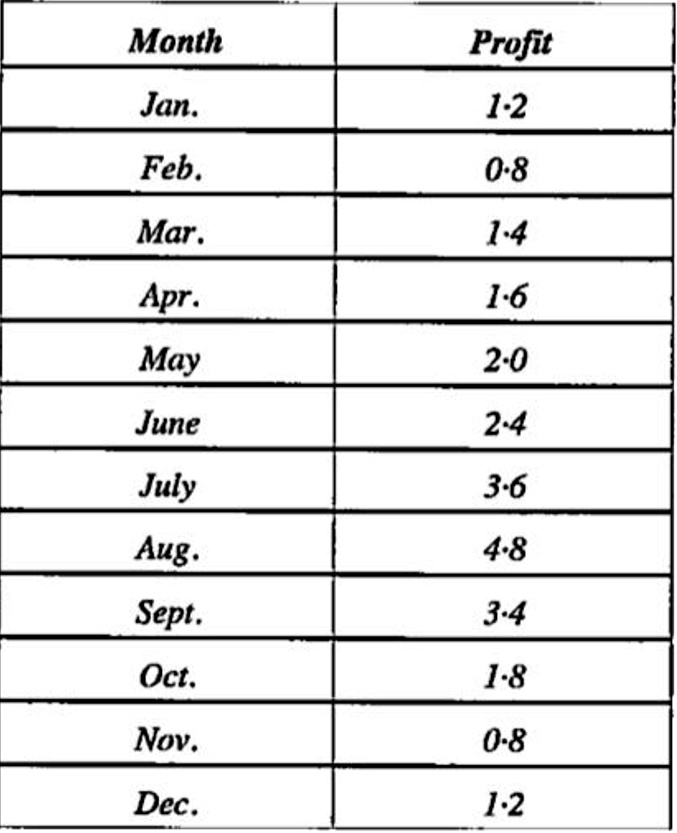
Calculate the four monthly moving averages.
View SolutionThe profit of a soft drink firm (in thousands of rupees) during each month of the year is as given below:
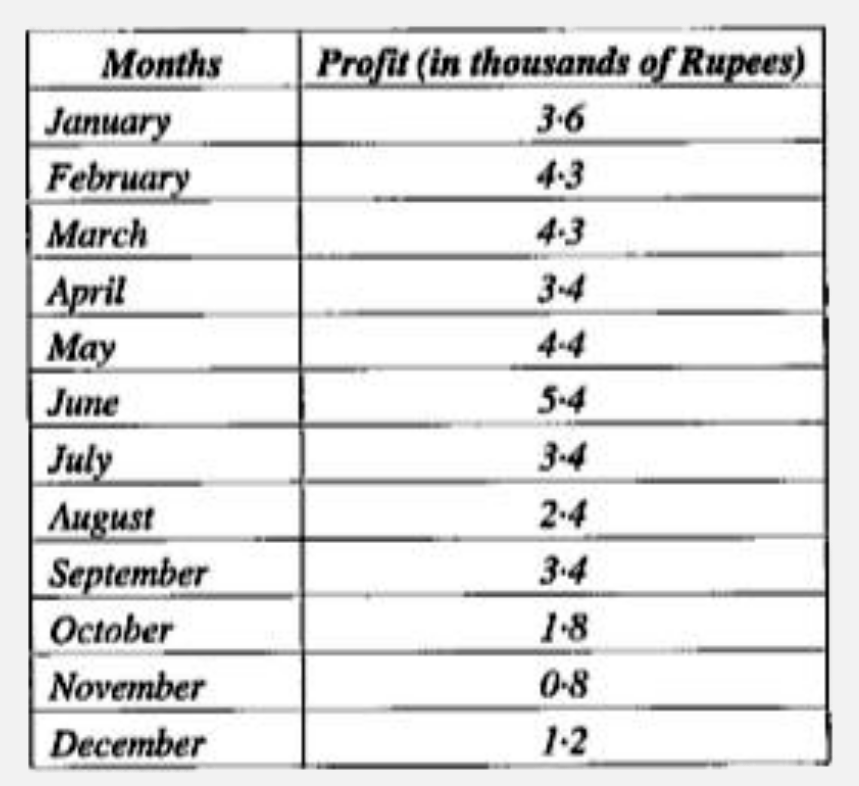
Calculate the four monthly moving averages .
View SolutionThe quarterly profits of a small scale industry (in thousands of rupees) is as follows:
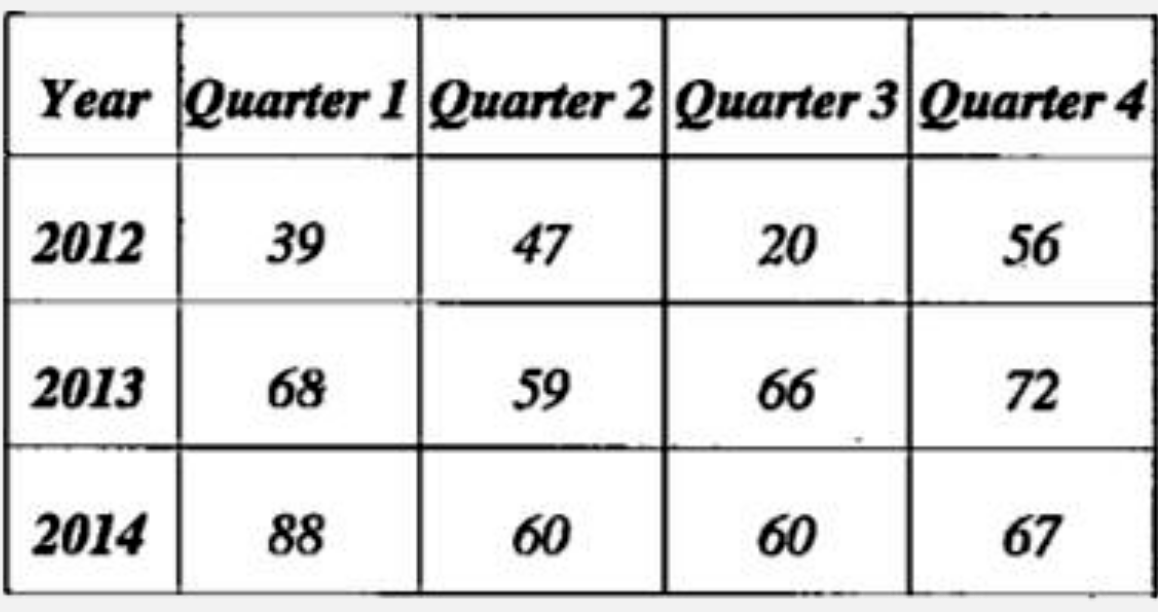
Calculate four quarterly moving averages. Display these and the original figures graphically on the same graphs sheet.
View SolutionStudy the following table and answer the questions based on it. Below is the Household is Expenditure (in Thousand Rupees) per annum
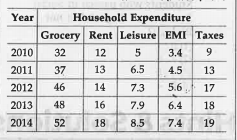
What is the average spending on Leisure per annum?
View SolutionThe production of cement by a firm in years 1 to 9 is given below:

Calculate the trend values for the above series by the 3 yearly moving average method.
View Solution
