The production of cement by a firm in years 1 to 9 is given below:

Calculate the trend values for the above series by the 3 yearly moving average method.
Step by step video & image solution for The production of cement by a firm in years 1 to 9 is given below: Calculate the trend values for the above series by the 3 yearly moving average method. by Maths experts to help you in doubts & scoring excellent marks in Class 11 exams.
Updated on:21/07/2023Topper's Solved these Questions
Similar Questions
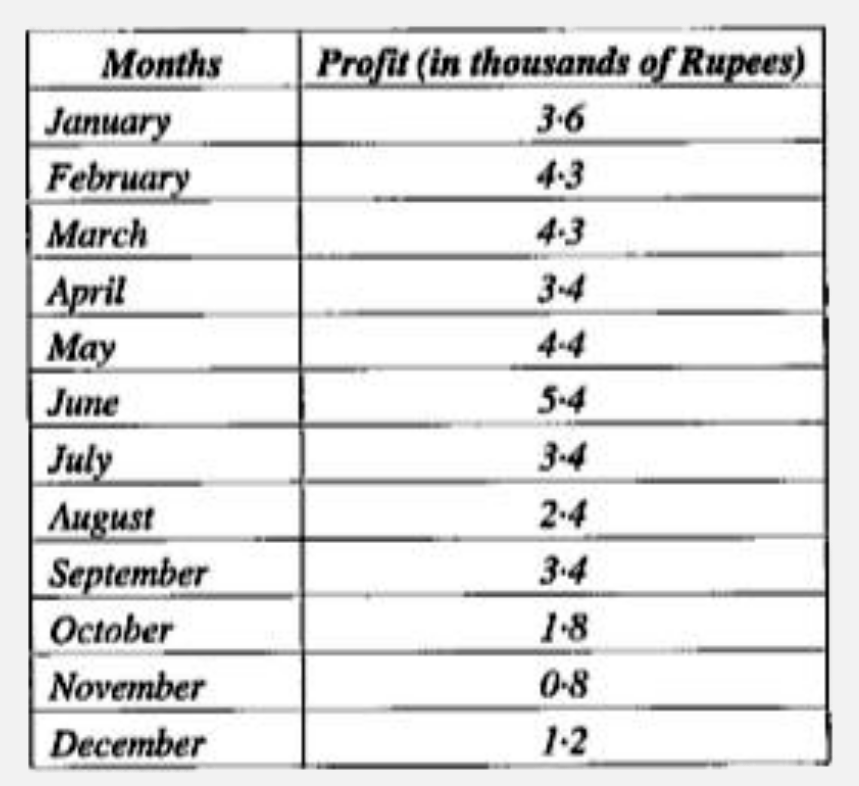
The profit of a soft drink firm (in thousands of rupees) during each month of the year is as given below:

Calculate the four monthly moving averages .
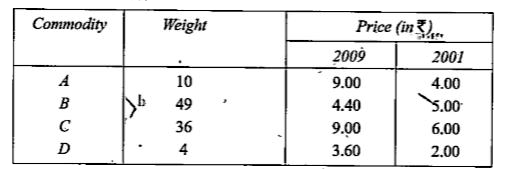
View SolutionThe price quotations of four different commodities for 2001 and 2009 are as given below, Calculate the index number for 2009 with 2001 as the base year by using weighted average of price relative method.

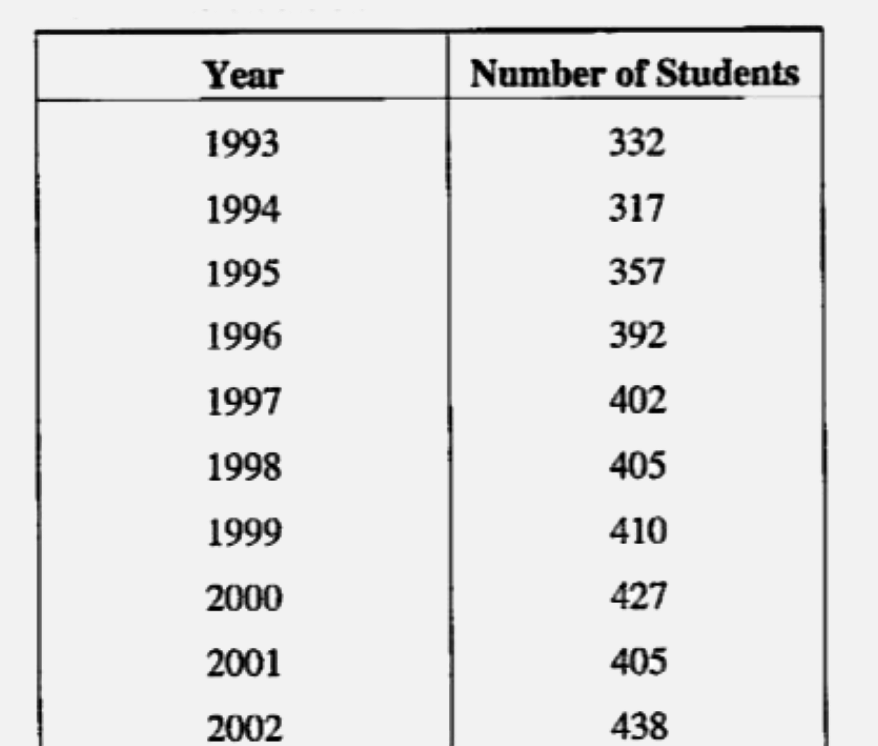
View SolutionFrom the details given below, calculate the five yearly moving averages of the number of students who have studied in a school.

View SolutionThe quotations for four different commodities for the years 2000 and 2005 are given below. Calculate the index number for 2005, with 2000 as the base year, by using the weighted average of price relatives method.

View SolutionCalculate the 5 yearly moving averages of the following time series of steel production

View SolutionThe relation between the acceleration and time for an object is given below. Calculate the velocity with which the object is moving at t = 1 s.
a=3t−4t2
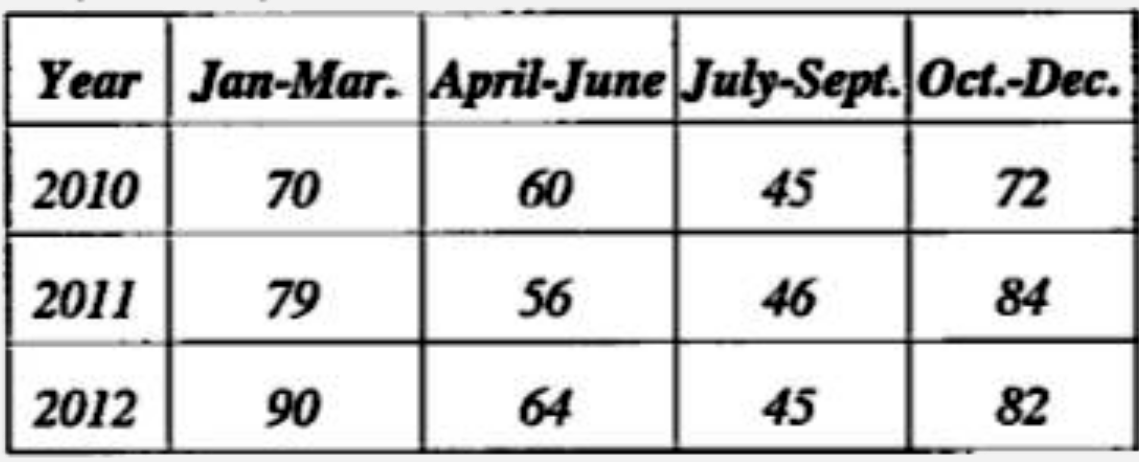
View SolutionThe number of road accidents in the city due to rash driving over a period of 3 years, is given in the following table :

Calculate four quarterly moving averages and illustrate them and original figures on one graph using the same axes for both.
View SolutionThe following table gives the number of failures of commercial industries in a country during the year 1975 to 1990

Draw a graph illustrating these figures. Calculate the 4 yearly moving averages and plot them on the same graph.
View SolutionThe following table gives the numbers of failures of commercial industries in a country during the years 2000 to 2015.

Draw a graph illustrating these figure.
Calculate the 4 yearly moving averages and plot them on the same graph.
View SolutionThe averge number , in thousands , of working hours lost in strikes each year of the period 2000-2009 was as under

. Calculate the three - yearly moving averages .
View Solution