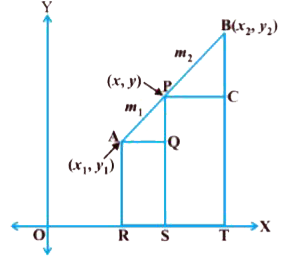
शिक्षक निम्नानुसार चित्र बनाकर प्रश्न पूछेंगें।

m1=m2=m लेकर x व y के मान निकालिये।
The correct Answer is:छात्र स्वयं हल करेंगे और x=x1+x22 , y=y1+y22 निकालेंगे
Step by step video, text & image solution for शिक्षक निम्नानुसार चित्र बनाकर प्रश्न पूछेंगें। m_(1) = m_(2) = m लेकर x व y के मान निकालिये। by Maths experts to help you in doubts & scoring excellent marks in Class 10 exams.
Topper's Solved these Questions
- BOOK - MP BOARD - PREVIOUS YEAR PAPERSCHAPTER - MODEL PAPER 2021EXERCISE - रचनाएँ7videos
MODEL PAPER 2021
- BOOK - MP BOARD - PREVIOUS YEAR PAPERSCHAPTER - MODEL PAPER 2021EXERCISE - त्रिकोणमिति का परिचय6videos
MODEL PAPER 2021
- BOOK - MP BOARD - PREVIOUS YEAR PAPERSCHAPTER - MODEL PAPER 2021EXERCISE - समांतर श्रेणी74videos
MODEL PAPER 2021
- BOOK - MP BOARD - PREVIOUS YEAR PAPERSCHAPTER - BOARD 2020EXERCISE - All Questions62videos
BOARD 2020
- BOOK - MP BOARD - PREVIOUS YEAR PAPERSCHAPTER - अनसॉल्वड पेपर्स (2011)EXERCISE - गणित46videos
अनसॉल्वड पेपर्स (2011)
Similar Questions
एक रेखा खण्ड बनाइये और उसे 3:2 में विभाजित करें।
01:37View Solutionसही जोड़ी बनाइये
 06:07View Solution
समांतर श्रेणी में इन प्रश्नों द्वारा पद ज्ञात करना तथा विभिन्न पदों में सम्बन्ध बनाने का प्रयास किया जाता है। किसी समान्तर श्रेणी का प्रथम पद a तथा सर्वान्तर d है तो
श्रेणी का 7 वाँ पद क्या होगा02:11View Solutionजब हो तो समीकरण निकाय(a1÷a2=b1÷b2=c1÷c2)तथा (a1X+b1Y+C1Z=0) तथा
01:31View Solutionसही विकल्प चुनकर अपनी उत्तर-पुस्तिका में लिखिए-
दो युगपत् रैखिक समीकरणों a1x+b1y+c1=0 एवं a2x+b2y+c2=0 का एक हल होगा, यदि-02:45View SolutionHow many lines of symmetry does the above figure have ?
02:17View SolutionWhich of the following are correct chain isomers of butane ? (i)
05:41View SolutionDetermine the point of symmetry of a regular hexagon.
02:10View SolutionDtermine the images of the following figure about the given line :
02:17View SolutionMatch the following Column A to Column B
 02:10View Solution
Match the following Column A to Column B
 04:23View Solution
Match the following Column A to Column B
 01:13View Solution
The inequation represented by the graph given below is :
03:04View SolutionThe inequation that best describes the graph given below is _________
01:50View SolutionThe inequation that best describes the following graph is _________
02:38View SolutionWhich inequations represent the shaded region in the given figure
02:34View Solution

