The following table shows the sales of a commodity during the years 2000 to 2006. Years:, 2000, 2001, 2002, 2003, 2004, 2005, 2006 Sales (in lakhs of Rs.), 1.5, 1.8, 2.4, 3.2, 5.4, 7.8, 8.6 Draw a graph of this information.
Step by step video & image solution for The following table shows the sales of a commodity during the years 2000 to 2006. Years:, 2000, 2001, 2002, 2003, 2004, 2005, 2006 Sales (in lakhs of Rs.), 1.5, 1.8, 2.4, 3.2, 5.4, 7.8, 8.6 Draw a graph of this information. by Maths experts to help you in doubts & scoring excellent marks in Class 8 exams.
Updated on:21/07/2023Topper's Solved these Questions
Similar Questions
The following table shows the amount of rice grown by a farmer in different years: Years:, 2000, 2001, 2002, 2003, 2004, 2005, 2006 Rice grown (in quintals):, 200, 180, 240, 260, 250, 200, 270 Plot a graph to illustrate this information.
View SolutionThe following table shows the number of patients discharged from a hospital with HIV diagnosis in different years: Years:, 2002, 2003, 2004, 2005, 2006 No. of Patients:, 150, 170, 195, 225, 230 Represent this information by a graph.
View Solution
Knowledge Check
In the following table, pass percentage of three schools from the year 2001 to the year 2006 are given. Which school students' performance is more consistent?
200120022003200420052006School X808979838465School Y929476758063School Z939767637085AXBYCZDX and YThe ratio of the total expenditure for the years 2000 and 2006 is 5:8. The cost of living index of 2006, taking 2000 as the base year, is ____
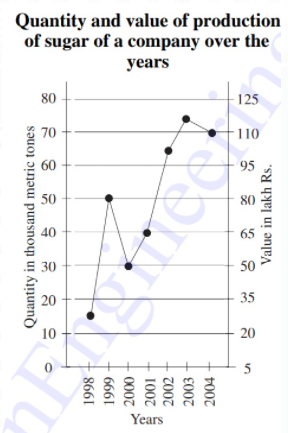
A125B62.5C160DCannot be determinedStudy the following graph carefully and answer the question given below-----

What was the difference between the average production of sugar during the years 1998,1999,2000 and 2001 and that of 2001,2002,2003 and 2004 in thousand metric tons ?A15B20C25DNone of these
The following table shows the interest paid by a company (in lakhs): Year, 1995-96, 1996-97, 1997-98, 1998-99, 1999-2000 Interest (in lakhs of rupees), 20, 25, 15, 18, 30 Draw the bar graph to represent the above information.
View SolutionThe following table expresses the age of eight students . Find the median age.
S. No.12345678Age (Years)18161411131092
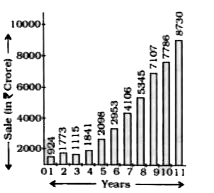
View SolutionThe following Bar chart shows the sales of a company XYZ (in Rs Crore). Study the chart and answer the following questions.

The sale in the year 4 is less than the sale in the year 8, by
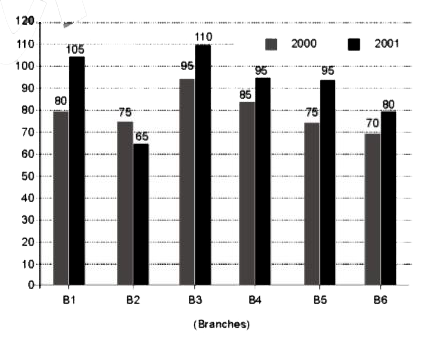
View SolutionThe given bar chart shows the sales of books from six branches of a publishing company during two consecutive years 2000 and 2001.

In the given bar chart, total sales of branches B1,B3 and B5 taken together for both the years is
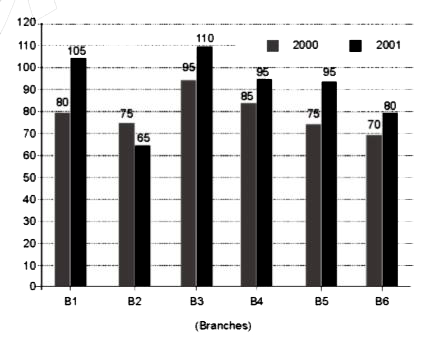
View SolutionThe given bar chart shows the sales of books from six branches of a publishing company during two consecutive years 2000 and 2001.

In the given bar chart, the ratio of total sales of all branches B1,B3 and B5 to total sales of branches B2,B4 and B5 taken together for both the years
View Solution