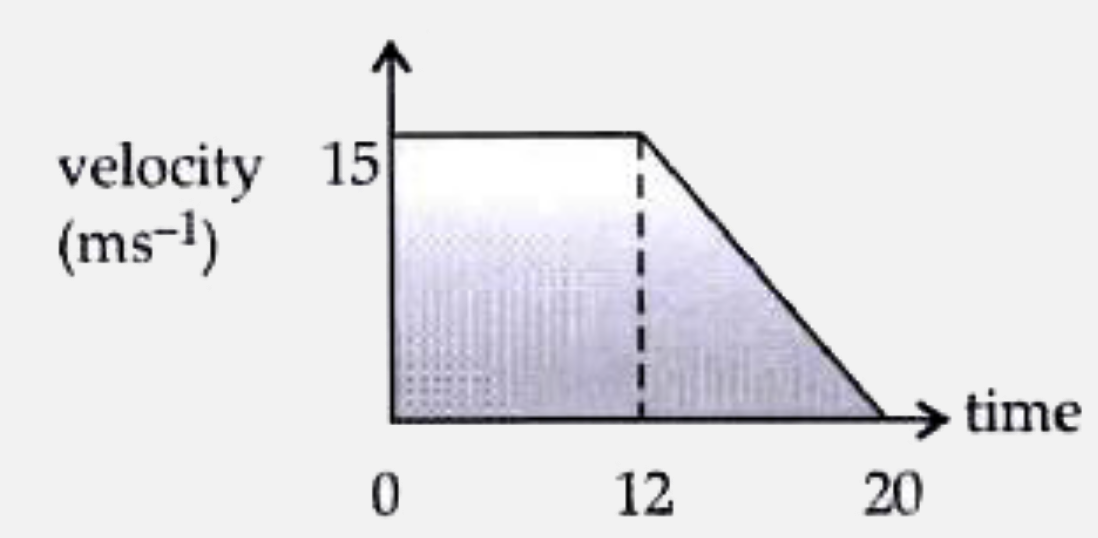
The velocity-time graph of a moving body is given below in Fig. 2.43.(i) the acceleration in parts AB, BC and CD. Find :
(ii) displacement in each part AB, BC, CD, and
(iii) total displacement.
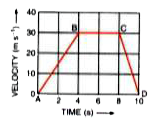
(i) AB:7.5ms−2BC:0ms−2,CD:−15ms−2 (ii) AB : 60 m , BC: 120 m CD: 30 m (iii) 210 m
Topper's Solved these Questions
- MOTION IN ONE DIMENSION BOOK - ICSECHAPTER - MOTION IN ONE DIMENSION EXERCISE - EXERCISE -2 (C)
3 Videos
- MOTION IN ONE DIMENSION BOOK - ICSECHAPTER - MOTION IN ONE DIMENSION EXERCISE - EXERCISE -2 (C) ( Multiple choice type :)
17 Videos
- MOTION IN ONE DIMENSION BOOK - ICSECHAPTER - MOTION IN ONE DIMENSION EXERCISE - EXERCISE -2 (B) ( Multiple choice type :)
3 Videos
- MEASUREMENTS AND EXPERIMENTATION BOOK - ICSECHAPTER - MEASUREMENTS AND EXPERIMENTATION EXERCISE - TOPIC 2 SIMPLE PENDULUM (4 Marks Questions )
1 Video
- PRESSURE IN FLUIDS AND ATMOSPHERIC PRESSUREBOOK - ICSECHAPTER - PRESSURE IN FLUIDS AND ATMOSPHERIC PRESSUREEXERCISE - Exercise -4(B)Numericals
5 Videos
Similar Questions
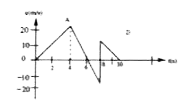
The velocity-time graph of a body moving in a straight line is shown in Fig. Find the displacement and distance travelled by the body in 10 sec.
View SolutionState how the velocity-time graph can be used to find (i) the acceleration of a body, (ii) the distance travelled by the body in a given time, and (iii) the displacement of the body in a given time.
View Solution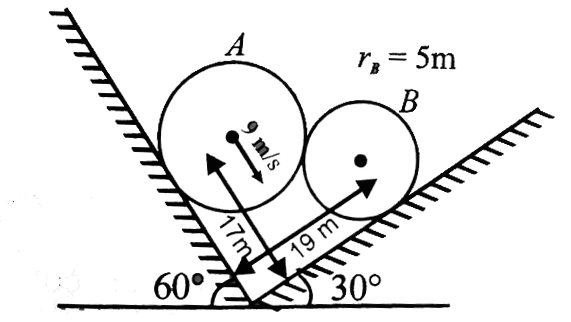
System is shown in the figure. Velocity of sphere A is 9 ms. Find the speed of sphere B.
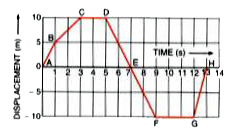
View SolutionFrom the displacement-time graph of a cyclist, given in Fig. 2.39, find :
(i) the average velocity in the first 4 s,
(ii) the displacement from the initial position at the end of 10 s,
(iii) the time after which he reaches the starting point.
View SolutionFig. 2.42 given below shows a velocity-time graph for a car starting from rest. The graph has three parts AB, BC and CD.
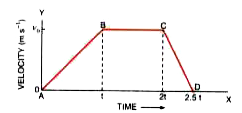
(i) State how is the distance travelled in any part determined from this graph.
(ii) Compare the distance travelled in part BC with the distance travelled in part AB.
(iii) Which part of graph shows motion with uniform (a) velocity (b) acceleration (c) retardation ?
(iv) (a) Is the magnitude of acceleration higher or lower than that of retardation ? Give a reason. (b) Compare the magnitude of acceleration and retardation.
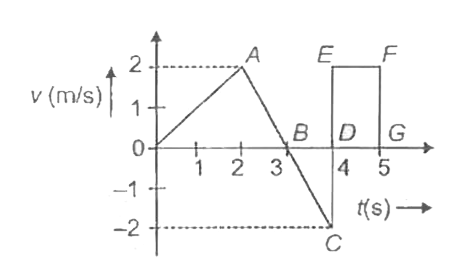
View SolutionThe velocity - time graph of a particle moving along a straight line is shown in the figure given below
The displacement of the particle in 5 second is
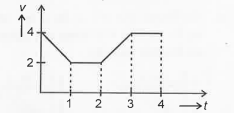
View SolutionThe velocity-time graph for a moving body is shown in figure below. If body moves in straight line along x-axis without changing its direction, then total displacement of body would be
View SolutionVelocity-time graph for the motion of a certain body is shown in Fig. Explain the nature of this motion. Find the initial velocity and acceleration and write the equation for the variation of displacement with time. What happens to the moving body at point B? How does the body move after this moment ?
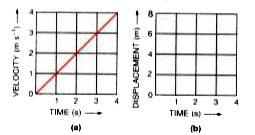
View SolutionFig. 2.41 (a) shows the velocity-time graph for the motion of a body. Use it to find the displacement of the body at t = 1 s, 2 s, 3 s and 4 s, then draw the displacement-time graph for it on Fig. 2.41 (b).
View SolutionThe figure below shows the velocity-time graph of a body moving in a straight line.
Find the total displacement of the body.
View Solution